
Gold (XAUUSD) awaits data: what will the US CPI reveal
Gold (XAUUSD) prices stabilised at 4,119 USD. US inflation data will provide new signals. Discover more in our analysis for 13 July 2026.
XAUUSD forecast: key takeaways
- Gold (XAUUSD) quotes react to macroeconomic data and uneven physical demand
- The market is awaiting the inflation report and conserving energy
- XAUUSD forecast for 13 July 2026: 4,100 or 4,206
Fundamental analysis
Gold (XAUUSD) is trading at 4,119 USD per troy ounce on Monday, down by about 1.5% for the week. Rising oil prices and tensions between the US and Iran are putting pressure on the precious metal, fuelling concerns that the Federal Reserve may keep interest rates high for longer.
Last week, oil prices rose by about 5% after a new exchange of strikes between the US and Iran. Increased inflation risks prompted the market to raise the probability of a Federal Reserve interest rate hike in September to almost 60%.
This week, investors will focus on the US Consumer Price Index (CPI) release and a speech by Federal Reserve Chairman Kevin Warsh, which may significantly adjust expectations for further monetary policy.
An additional signal came from the published minutes of the June Fed meeting, which showed growing concerns about inflation. Some policymakers had already advocated for a rate hike, although the rate was ultimately left unchanged.
The fundamental picture in the gold market remains mixed. Demand in India weakened due to high price volatility, while interest in the metal remains steady in China. Moreover, the People’s Bank of China increased its gold reserves in June at the fastest pace in more than two and a half years, continuing to support long-term demand for the precious metal.
The gold (XAUUSD) forecast is moderate.
Technical outlook
On the H4 chart, gold (XAUUSD) continues to trade in a broad range after recovering from the June lows. After failing to consolidate above the 4,206 resistance level, quotes came under pressure again and began to consolidate in the 4,100–4,120 area. Prices are holding near the middle Bollinger Band, reflecting balance between buyers and sellers in anticipation of new fundamental drivers.
The technical picture remains neutral with a moderately negative bias. The nearest support level is the 4,095–4,100 area, while the key resistance is located at 4,206, where sellers had previously become more active. As long as gold remains below this mark, the upside potential is limited. At the same time, holding above 4,100 allows the market to retain a chance of retesting the range’s upper boundary.
Indicators are giving mixed signals. MACD remains near the zero mark, reflecting the absence of a pronounced trend and the gradual weakening of the previous downward momentum. The Stochastic Oscillator has turned upwards after leaving oversold territory, suggesting a short-term rebound. The baseline scenario remains consolidation in the 4,100–4,206 range until the publication of US inflation data, which may determine the further direction of gold (XAUUSD).
XAUUSD overview
- Asset: XAUUSD
- Timeframe: H4 (Intraday)
- Trend: consolidation with a moderately negative bias
- Key resistance levels: 4,206 and 4,260
- Key support levels: 4,100 and 4,045
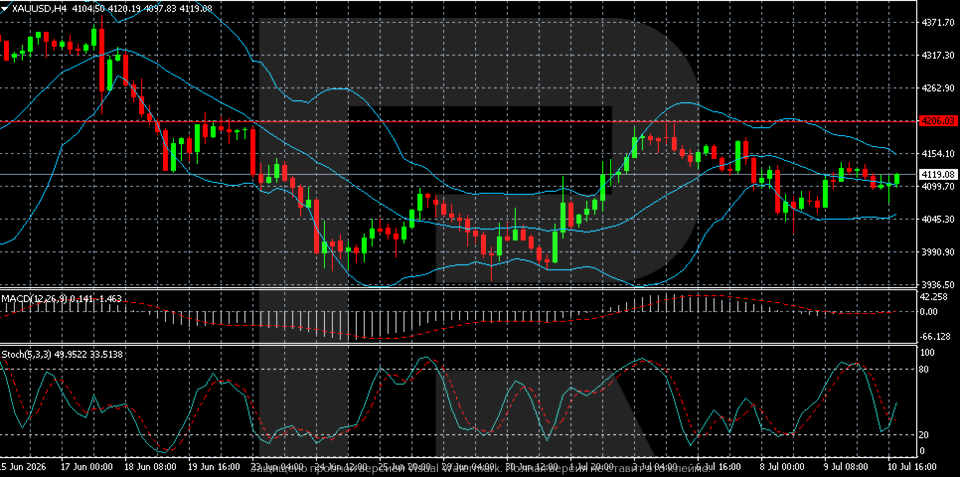
XAUUSD trading scenarios for today
Main scenario (Sell Stop)
Consolidation below 4,100 would confirm a downside breakout from the range and increase selling pressure ahead of US inflation data.
- Take Profit: 4,045
- Stop Loss: 4,125
Alternative scenario (Buy Stop)
A breakout above the 4,206 resistance level would signal renewed upward momentum and open the way to the next target.
- Take Profit: 4,260
- Stop Loss: 4,180
Risk factors
The main risk to the XAUUSD downside scenario remains stronger demand for gold as a safe-haven asset if the situation in the Middle East escalates further. Weaker-than-expected US inflation data may also support buyers, as it will reduce expectations of further Fed policy tightening and create conditions for a breakout above 4,206.
Summary
Gold prices rose and then paused. The XAUUSD forecast for today, 13 July 2026, suggests prices could remain within the 4,100–4,206 range.
Editors’ picks
 EURUSD forecast 2026–2027: technical analysis, price levels & predictions
The ECB holds rates at 2.15% while the Fed stays at 3.75% — and that divergence is the central driver of EURUSD in 2026. The pair is range-bound between 1.1400 and 1.1915, with Deutsche Bank targeting 1.2500 and Morgan Stanley calling for 1.3000 by year-end. We analyse the technicals, break down the macro factors, and outline three trading scenarios with specific entry levels.
 Gold (XAUUSD) forecast 2026: predictions based on fundamental and technical analysis
Gold has corrected over 25% from its all-time high of 5,597 USD and is now trading near 4,100 USD — testing a critical support zone. Is this the bottom, or will the downtrend continue? We break down the key levels (support 3,920 USD, breakout trigger 4,500 USD), three trading scenarios with entry levels, and what J.P. Morgan, Goldman Sachs and Deutsche Bank are forecasting for gold in 2026.
Forecasts presented in this section only reflect the author’s private opinion and should not be considered as guidance for trading. RoboForex bears no responsibility for trading results based on trading recommendations described in these analytical reviews.