Weekly technical analysis and forecast (27 April–1 May 2026)
In this weekly technical analysis, we review key chart patterns and levels for EUSUSD, USDJPY, GBPUSD, AUDUSD, USDCAD, gold (XAUUSD), and Brent oil to forecast developments for the upcoming week (27 April–1 May 2026)
Major technical levels to watch this week
- EURUSD: Support: 1.1660, 1.1574. Resistance: 1.1756, 1.1880
- USDJPY: Support: 159.20, 157.20. Resistance: 161.25, 162.40
- GBPUSD: Support: 1.3436, 1.3132. Resistance: 1.3598, 1.3618
- AUDUSD: Support: 0.7077, 0.6974. Resistance: 0.7204, 0.7327
- USDCAD: Support: 1.3613, 1.3550. Resistance: 1.3818, 1.3966
- Gold: Support: 4,550, 3,933. Resistance: 4,710, 5,010
- Brent: Support: 93.18, 88.40. Resistance: 102.30, 104.23
EURUSD forecast
The fundamental backdrop for EURUSD remains on the side of the US dollar. The European Central Bank (ECB) is showing caution in its next steps, as inflation in the eurozone is slowing and economic activity remains weak. The ECB is signalling a wait-and-see stance as it assesses the effects of previous decisions. At the same time, the US Federal Reserve continues to maintain hawkish rhetoric, as inflation remains above target levels and the labour market remains resilient. Rising US Treasury yields provide additional support to the dollar. Monetary policy divergence puts pressure on the euro, forming the baseline scenario in favour of a EURUSD decline.
EURUSD technical analysis
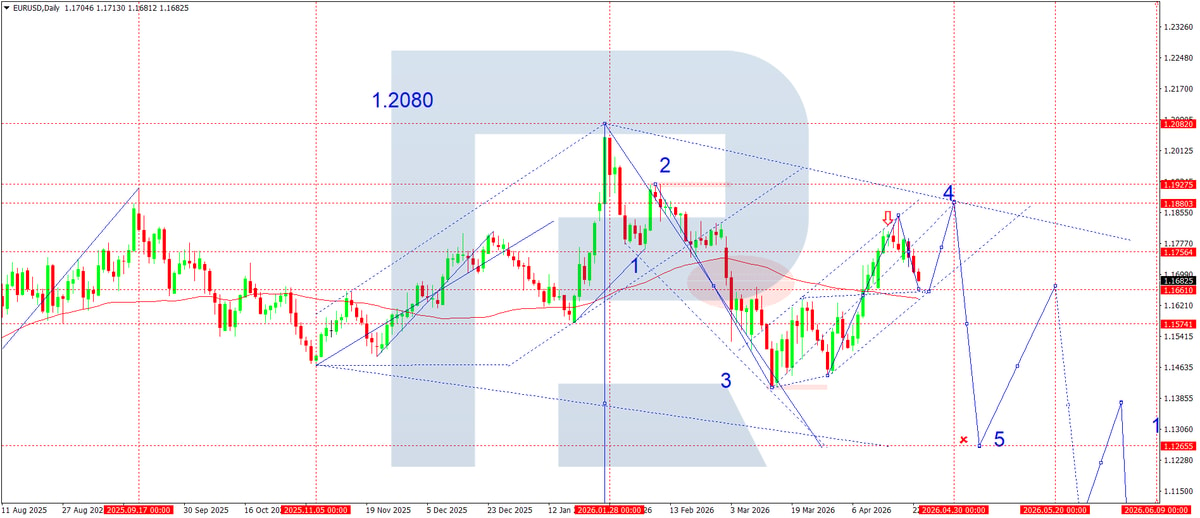
On the daily chart, the structure fully matches the scenario marked by the arrows. After forming a peak near 1.2080, the market entered a downward momentum phase, which is developing within a descending channel. The current structure indicates the completion of a corrective wave near 1.1756, where the price encountered a strong resistance zone.
The reversal zone from 1.1756, marked by the arrow, is confirmed by the price reaction and the formation of a local peak, after which the decline began. The current pullback to the 1.1660 area looks like a retest of the broken structure and balance zone, where the moving average runs. This zone acts as a key decision point for the market.
According to the structure, a downward impulse is expected to form with wave 5 developing towards 1.1265. This level coincides with the lower boundary of the channel and acts as the main target of the move. An intermediate pause is possible near 1.1574, where support previously formed.
It is important to note that the entire structure after testing the 1.1880 level looks like a distribution pattern with lower highs, which increases the probability of further decline. As long as the price remains below 1.1756, sellers retain control.
The alternative scenario, also marked on the chart, implies a short-term recovery from the 1.1660 zone with the price retesting the 1.1756–1.1880 area, but this scenario remains corrective and does not cancel the medium-term downtrend.
EURUSD forecast scenarios
Bearish (baseline): a decline from 1.1682 through 1.1660 towards 1.1574 and then to 1.1265.
Bullish (alternative): if the price consolidates above 1.1756, growth towards 1.1880 is possible.
USDJPY forecast
Last week, the key driver for USDJPY remained the difference in monetary policy between the US and Japan. The Federal Reserve maintains a cautiously hawkish tone despite signs of slowing inflation, which keeps US Treasury yields at relatively high levels. At the same time, the Bank of Japan continues to follow a loose policy despite a gradual rise in domestic inflation pressure. Comments from BoJ officials indicate a reluctance to tighten conditions quickly, which maintains yen weakness. Stable demand for the dollar as a safe-haven asset amid persistent geopolitical risks and global economic uncertainty has an additional influence. Therefore, the fundamental bias remains in favour of the dollar, although the market is increasingly pricing in the probability of corrective moves due to the pair being overbought.
USDJPY technical analysis
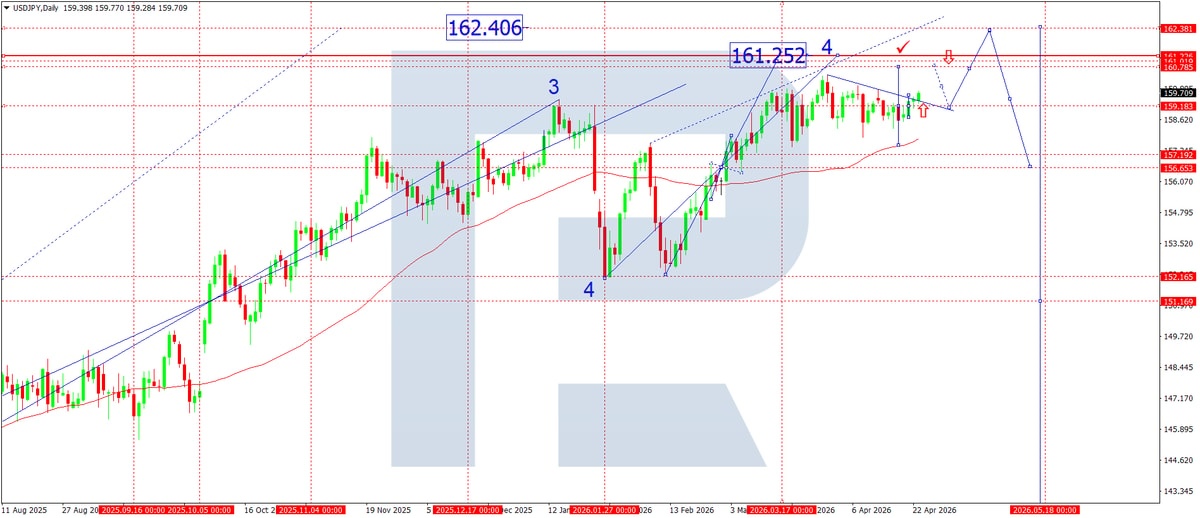
On the daily chart, the ascending structure remains intact, with a clearly defined impulsive wave. Wave 3 was completed near 161.25, after which the market entered a correction phase, forming wave 4 as a sideways range. The current dynamics point to consolidation below the key resistance level, while the price is holding above the ascending trendline and the moving average, confirming that the medium-term uptrend remains intact.
The 160.70–161.25 area acts as a strong resistance zone, where profit-taking previously occurred. At the same time, the local structure shows range compression, which often precedes an impulsive move. The potential completion of wave 4 creates conditions for the start of wave 5 with targets near 162.40 and above, coinciding with the upper boundary of the expanding channel.
On the other hand, failure to consolidate above 160.70 may deepen the correction. A breakout below the local support level near 159.20 will increase pressure and open the way to a test of 157.20, where more significant support and the buyer interest zone are located. It is important to note that the current correction remains technical and does not disrupt the main trend structure.
USDJPY forecast scenarios
Bullish (baseline): continued growth after the correction is completed, with a target at 161.25 and then 162.40.
Bearish (alternative): if the price breaks the 159.20 level, a correction towards 157.20 and then 156.60 is possible.
GBPUSD forecast
The fundamental backdrop for GBPUSD over the coming week is shaped around expectations for monetary policy and macroeconomic data from the US and the UK. The market continues to reassess the Fed’s rate path, with cautious rhetoric persisting amid slowing inflation but a resilient labour market. At the same time, the Bank of England faces weaker economic dynamics, which limits the scope for tight policy. The latest UK business activity data points to slowing growth, increasing pressure on the pound. Another factor is the fluctuation in US bond yields, which supports the dollar. Overall, the fundamental balance is tilted towards moderate dollar strengthening, although short-term corrections are possible amid position-taking and expectations of new data.
GBPUSD technical analysis
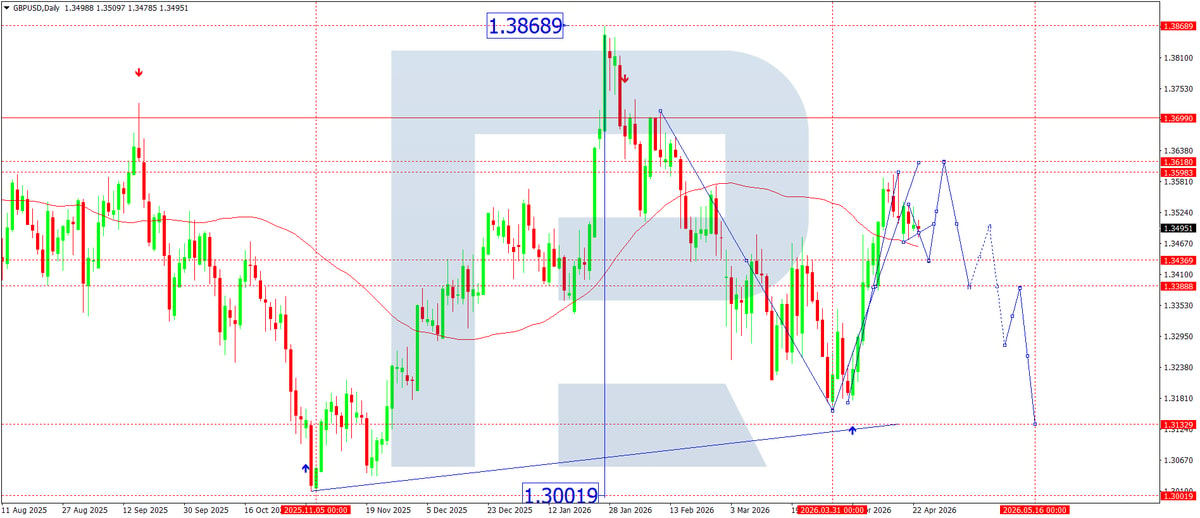
On the daily chart, the medium-term downwards structure remains in place after the formation of a peak near 1.3869. The price completed an impulsive move downwards and shifted into a corrective recovery phase. The current dynamics point to an upward correction within a downtrend, where the price is testing the 1.3598–1.3618 supply zone. This area coincides with the previously broken support level and now acts as key resistance.
Locally, a wave structure has formed with sequentially renewed highs, but the angle of the move remains corrective. The price is trading near the moving average, confirming the absence of a sustained uptrend. The scenario in which the correction ends in the 1.3598–1.3618 zone looks preferable, after which the downward impulse is expected to resume.
The key support below is 1.3436. A breakout of this level will confirm the end of the corrective phase and open the way for a decline towards 1.3132, where the long-term support line runs. The structure points to the formation of a potential downward wave aimed at renewing local lows.
GBPUSD forecast scenarios
Bearish scenario (main): a decline from 1.3598 towards 1.3436, followed by an impulse towards 1.3132.
Bullish scenario (alternative): if 1.3618 is broken, growth towards 1.3699 is possible.
AUDUSD forecast
The fundamental backdrop for the coming week is shaped by mixed factors. Market participants are mainly focused on Federal Reserve policy, as the Fed maintains a cautious approach to rate cuts amid persistent inflation in the US. The latest macroeconomic data show a moderate slowdown in the economy, although the labour market remains sufficiently strong, supporting the US dollar. At the same time, the Reserve Bank of Australia (RBA) is signalling a pause in tightening as it assesses slower domestic demand and the influence of China’s economy. Weak data from China, Australia’s key trading partner, continue to pressure the Australian dollar. Commodity market dynamics remain another factor, with metal prices showing instability. Together, this forms a restrained backdrop for AUD growth and supports demand for USD as a safe-haven asset.
AUDUSD technical analysis
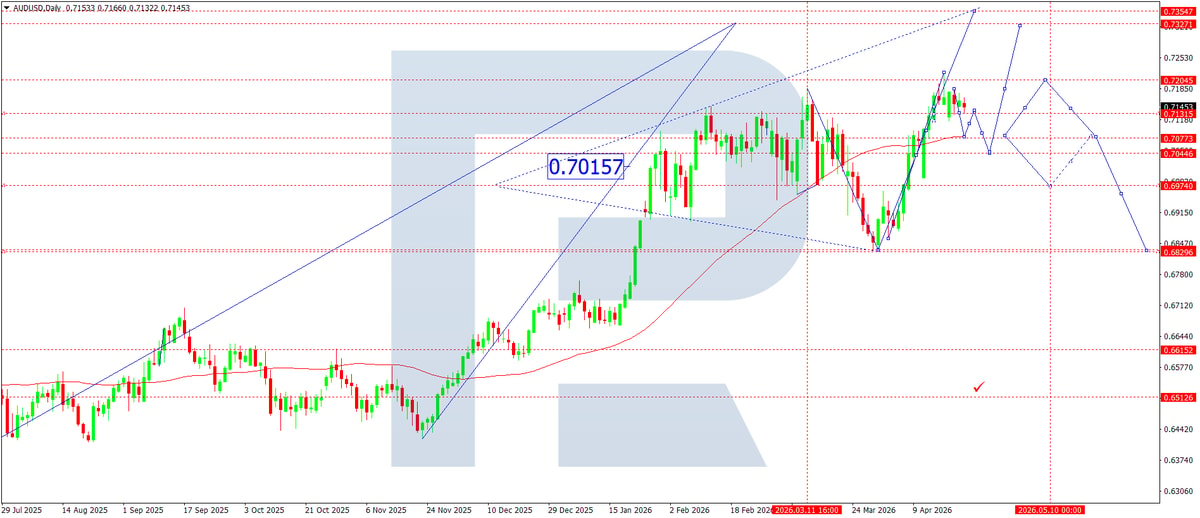
From a technical perspective, AUDUSD retains an ascending structure, although momentum is slowing near the 0.7200–0.7250 zone. After forming a local high near 0.7200, the price shifted into a corrective phase, testing the 0.6847 area, from where a confident rebound followed. The current structure points to the formation of an ascending channel supported by the 0.6974 area, which acts as the key Pivot Point. The moving average indicates that the medium-term uptrend remains intact, but the price is trading near resistance, increasing the probability of a correction.
Within the wave structure, the completion of the impulsive phase and a shift into correction can be assumed. The current 0.7131–0.7204 zone acts as a strong resistance cluster. If the market fails to consolidate above this area, a downward correction is likely to form with an initial target at 0.7077 and then 0.6974. The alternative scenario suggests a new impulse if the price consolidates above 0.7204, opening upside potential towards 0.7327 and then 0.7354. The channel structure confirms the possibility of both continued growth and a deep correction, depending on price reaction to the current levels.
AUDUSD forecast scenarios
Bearish scenario (baseline): a decline to 0.7077, with possible continuation to 0.6974.
Bullish scenario (alternative): if 0.7204 is broken upwards, growth towards 0.7327–0.7354 is possible
USDCAD forecast
Over the coming week, market participants will focus on monetary policy and commodity market dynamics. The US dollar retains support amid firm expectations that the US Federal Reserve will maintain a cautious approach to rate cuts because of persistent inflation pressure. At the same time, labour market macroeconomic data remain stable, limiting the potential for US dollar weakness. The Canadian dollar, in turn, is influenced by oil dynamics, which are showing signs of stabilisation after recent volatility. The Bank of Canada continues to signal readiness for policy easing, but is doing so cautiously as it assesses inflation risks. Overall, this creates a mixed fundamental backdrop for USDCAD, with a bias towards moderate US dollar strengthening.
USDCAD technical analysis
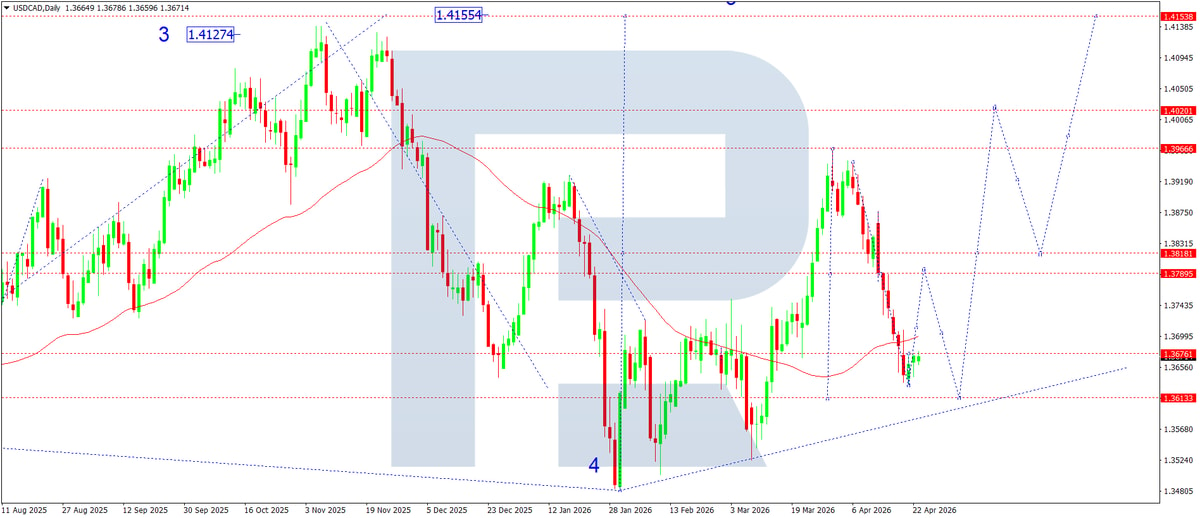
From a technical perspective, the daily chart maintains a medium-term corrective structure after the formation of a peak near 1.4155. Price tested the 1.3613 support zone and formed a local rebound, indicating an attempt to stabilise after the downward impulse. The moving average acts as dynamic resistance, and the current consolidation is taking place below it, keeping pressure on the pair. The structure resembles the formation of a corrective wave with the potential development of a sideways range.
The rebound from 1.3613 is accompanied by compressed volatility, which often precedes a new impulse. The nearest resistance zone is around 1.3789–1.3818, where active selling previously occurred. Consolidation above this area will open potential for movement towards 1.3966 and then 1.4020. The key support below remains 1.3613. A breakout of this level will increase downside pressure and may lead to a retest of the 1.3550 area and lower.
The wave structure indicates the completion of the downward phase and a shift to corrective growth, but confirmation through a breakout of key resistance is still absent. The channel is gradually narrowing, forming a potential base for the next directional move.
USDCAD forecast scenarios
Bullish (baseline): growth towards 1.3818, followed by a test of 1.3966.
Bearish (alternative): if 1.3613 is broken, a possible decline towards 1.3550 may follow.
XAUUSD forecast
Gold remains highly sensitive to US dollar dynamics and interest rate expectations. At present, the market is focused on signals from the Fed, where rhetoric remains moderately hawkish amid persistent inflation and a strong labour market. US Treasury yields have stabilised after their recent rise, which limits gold’s upside potential. Geopolitical tension acts as an additional factor, periodically supporting demand for safe-haven assets. At the same time, a stronger dollar is putting pressure on XAUUSD prices. Ahead of the new week, market participants will closely monitor US macroeconomic statistics, including inflation and business activity data, which may set a short-term impulse for the metal.
XAUUSD technical analysis
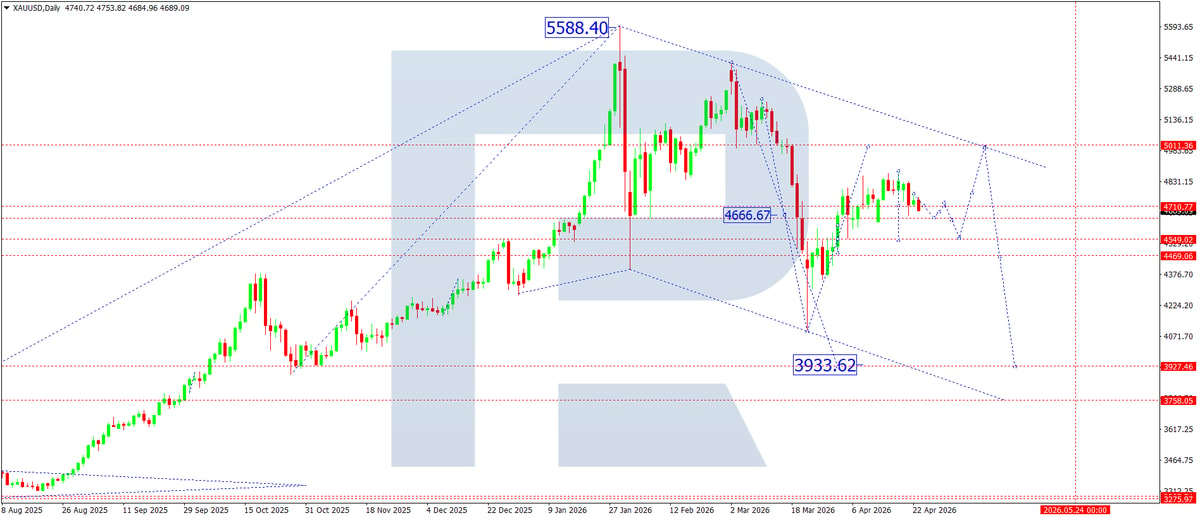
On the daily chart, XAUUSD retains a downwards corrective structure after forming a local high in the 5,588.40 area. From this level, price shifted into a decline, followed by the formation of a volatile sideways range. The current price remains below the key resistance zone of 4,710–4,750, indicating continued seller pressure.
From a wave structure perspective, a corrective model is developing after the impulsive rise. The 4,666 level acts as an intermediate Pivot Point, from which a local rebound previously formed. At the same time, the deeper downside target is located near 3,933, which corresponds to the lower boundary of the descending channel.
Price is also moving inside a descending channel, where the upper boundary limits attempts to rise. Each new attempt to consolidate above 4,800 meets selling pressure, confirming the dominance of the bearish scenario. In the short term, consolidation is forming between 4,550 and 4,710, which can be viewed as accumulation ahead of the next move.
It should also be noted that the structure of highs and lows remains descending, increasing the probability of continued decline. Only a confident consolidation above 5,000 would shift the medium-term picture in favour of buyers.
XAUUSD forecast scenarios
Bearish (baseline): a decline with a breakout of 4,550 and further movement towards 3,933.
Bullish (alternative): if prices break above the 4,710 level, growth towards 5,010 is possible.
Brent forecast
The oil market is ending the week in a state of elevated volatility, influenced by several fundamental factors at once. Market participants are mainly focused on OPEC+ policy, where a high level of discipline in limiting production remains in place, continuing to support prices. The market is also reacting to geopolitical tension in the Middle East, which creates risks of supply disruptions. On the other hand, pressure comes from the strengthening US dollar amid hawkish Federal Reserve rhetoric, which traditionally reduces the appeal of commodity assets. Investors are also closely monitoring US oil inventory data, which are showing unstable dynamics and increasing uncertainty. Overall, the fundamental backdrop remains mixed, but with a bias towards supporting prices in the medium term.
Brent technical analysis
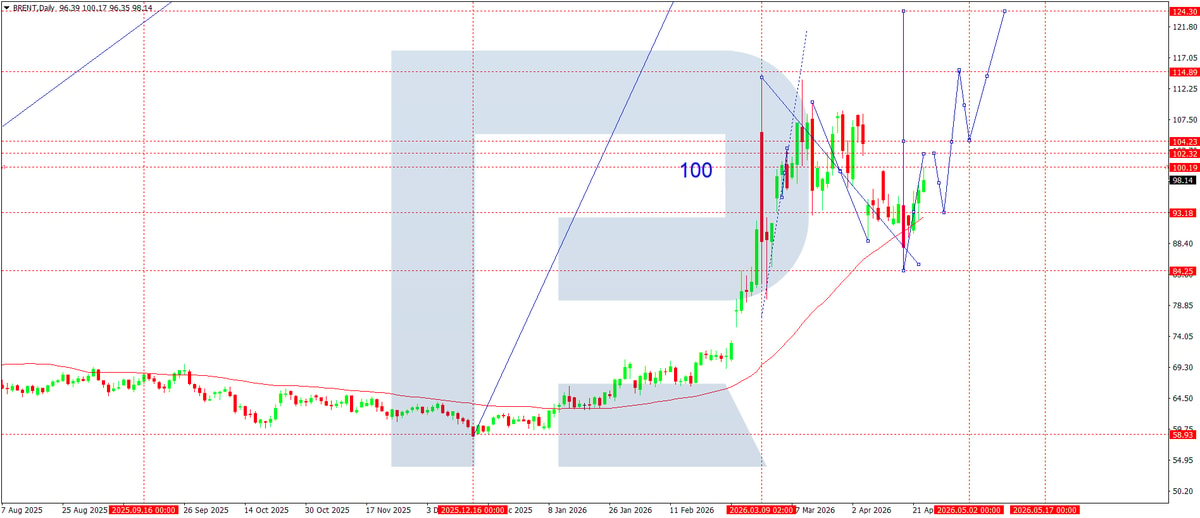
On the daily chart, Brent retains an ascending structure after an impulsive rise from the 70.00–75.00 area, where a reversal base was formed. Price reached the key 104.20–104.80 zone, after which it entered a correction and consolidation phase. At present, a local corrective pattern is forming with support at 93.18, which acts as intermediate support.
The movement of recent weeks can be interpreted as the development of a corrective wave after the impulse was completed. A decline into the 88.40–84.25 area looks like a potential correction completion zone, where support from the ascending channel and the dynamic average also runs. The market has already shown a rebound from this zone, indicating that buyer interest remains.
The upper boundary of the range runs through 104.23, which acts as key resistance. A breakout of this zone will open the way to the next target at 114.89, and in the broader perspective towards 124.30, which corresponds to the projection of the next impulsive wave.
At the same time, failure to consolidate above 100.00–102.30 increases the risk of a continuation of the sideways correction with a retest of lower levels. The current structure looks more like accumulation ahead of the next directional move.
Brent forecast scenarios
Bullish scenario (main): if prices consolidate above 102.30, growth towards 104.23 is possible, followed by movement to the 114.89 area and then 124.30.
Bearish scenario (alternative): a decline from current levels, with prices returning to 93.18 and possibly testing 88.40.
Editors’ picks
 EURUSD 2026-2027 forecast: key market trends and future predictions
This article provides the EURUSD forecast for 2026 and 2027 and highlights the main factors determining the direction of the pair’s movements. We will apply technical analysis, take into account the opinions of leading experts, large banks, and financial institutions, and study AI-based forecasts. This comprehensive insight into EURUSD predictions should help investors and traders make informed decisions.
 Gold (XAUUSD) forecast 2026 and beyond: expert insights, price predictions, and analysis
Dive deep into the Gold (XAUUSD) price outlook for 2026 and beyond, combining technical analysis, expert forecasts, and key macroeconomic factors. It explains the drivers behind gold’s recent surge, explores potential scenarios including a move toward 4,500 to 5,000 USD per ounce, and highlights why the metal remains a strong hedge during global uncertainty.
Forecasts presented in this section only reflect the author’s private opinion and should not be considered as guidance for trading. RoboForex bears no responsibility for trading results based on trading recommendations described in these analytical reviews.