Weekly technical analysis and forecast (20–24 October 2025)
This weekly technical analysis highlights the key chart patterns and levels for EURUSD, USDJPY, GBPUSD, AUDUSD, USDCAD, gold (XAUUSD), and Brent crude oil to forecast market moves for the upcoming week (20–24 October 2025)
Major technical levels to watch this week
- EURUSD: Support: 1.1542, 1.1630. Resistance: 1.1727, 1.1780
- USDJPY: Support: 149.75, 146.55. Resistance: 153.25, 154.10
- GBPUSD: Support: 1.3247, 1.3152. Resistance: 1.3500, 1.3644
- AUDUSD: Support: 0.6400, 0.6340. Resistance: 0.6530, 0.6590
- USDCAD: Support: 1.4030, 1.3940. Resistance: 1.4090, 1.4160
- Gold: Support: 4,135, 3,940. Resistance: 4,475, 4,636
- Brent: Support: 60.00, 59.70. Resistance: 64.74, 67.40
EURUSD forecast
The euro stays under pressure amid persistent political and economic turbulence. Markets focus on the prolonged budget fight in the US Congress and shutdown threats, which have turned into a chronic uncertainty factor for global markets. Despite the risk of temporary suspensions in federal agencies, the dollar keeps its safe-haven status, supported by liquidity demand and a strong corporate sector.
Trump-era trade wars add fuel: the White House expands tariff pressure on a range of European and Asian goods, which weighs on export-oriented EU economies, particularly Germany. That undermines manufacturing activity and weakens the euro through a deteriorating regional trade balance.
The Fed’s higher-for-longer stance keeps US yields elevated and widens the rate differential in favour of the dollar. The ECB, in contrast, takes a cautious line: slowing inflation and weak GDP limit any scope to tighten.
As a result, the backdrop favours the dollar. Political chaos in the US does not derail USD demand, while the eurozone loses momentum. The euro reacts more to the external backdrop than to internal drivers and stays within a medium-term downward cycle.
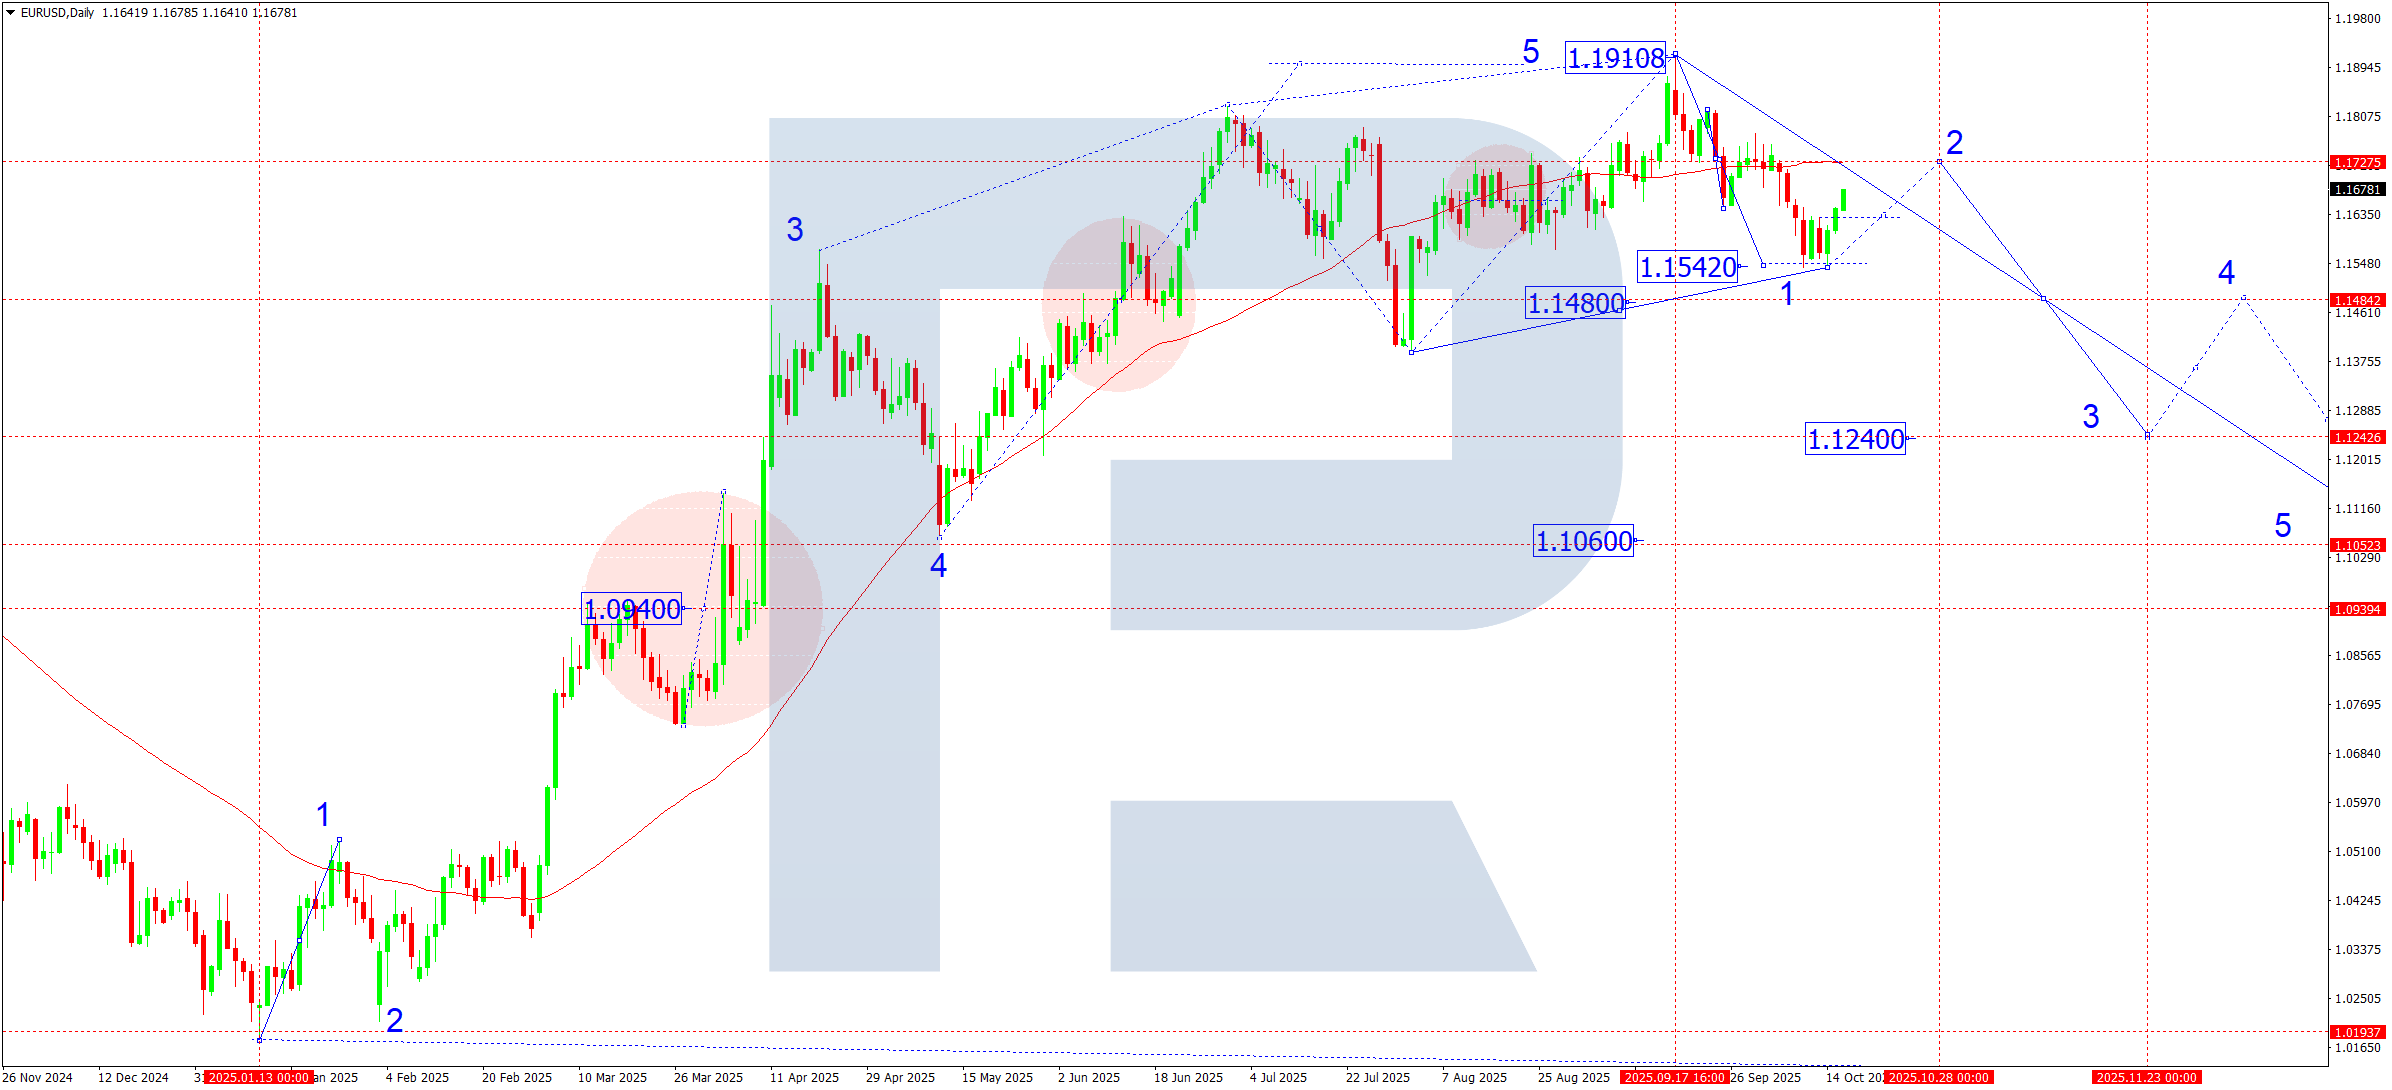
EURUSD technical analysis
On the daily chart, the EURUSD pair dipped to 1.1542 and built a consolidation range above it. Last week, the price broke above the range’s upper boundary at 1.1630, signalling a corrective structure in play. This week, the pair is expected to climb to 1.1727, the key correction level. From there, a new downward wave is likely towards 1.1480. A breakout below 1.1480 would open the path for the third downward wave with a target at 1.1240.
EURUSD forecast scenarios
Bearish (baseline) scenario: a downward wave is forming towards 1.1060.
Wave 1: target 1.1520 (completed earlier)
Wave 2: correction towards 1.1727 (expected this week)
Wave 3: decline to 1.1240
Bullish (alternative) scenario: if the price breaks above 1.1780, the market can extend a move to 1.1820 and then 1.1920, which would reshape the structure and delay the downward wave in the short term.
USDJPY forecast
The yen remains pressured by a widening yield differential: 10-year US Treasuries hold near 4.8–4.9%, while JGB yields stay constrained by the Bank of Japan’s curve control. Markets read Tokyo’s occasional verbal interventions as attempts to slow the pace of weakening rather than reverse the trend.
Shutdown risk in the US and a new wave of Trump-era trade war (tariffs against China and threats towards Japan and South Korea’s auto sectors) lift demand for the dollar as a liquidity tool. However, continued political turbulence in Washington can trigger short phases of flight to quality, leading to short-term demand for the yen. Overall, the backdrop still favours the dollar, but volatility around the 149–150 area may rise on any new BoJ signals and market reactions to US fiscal risks.
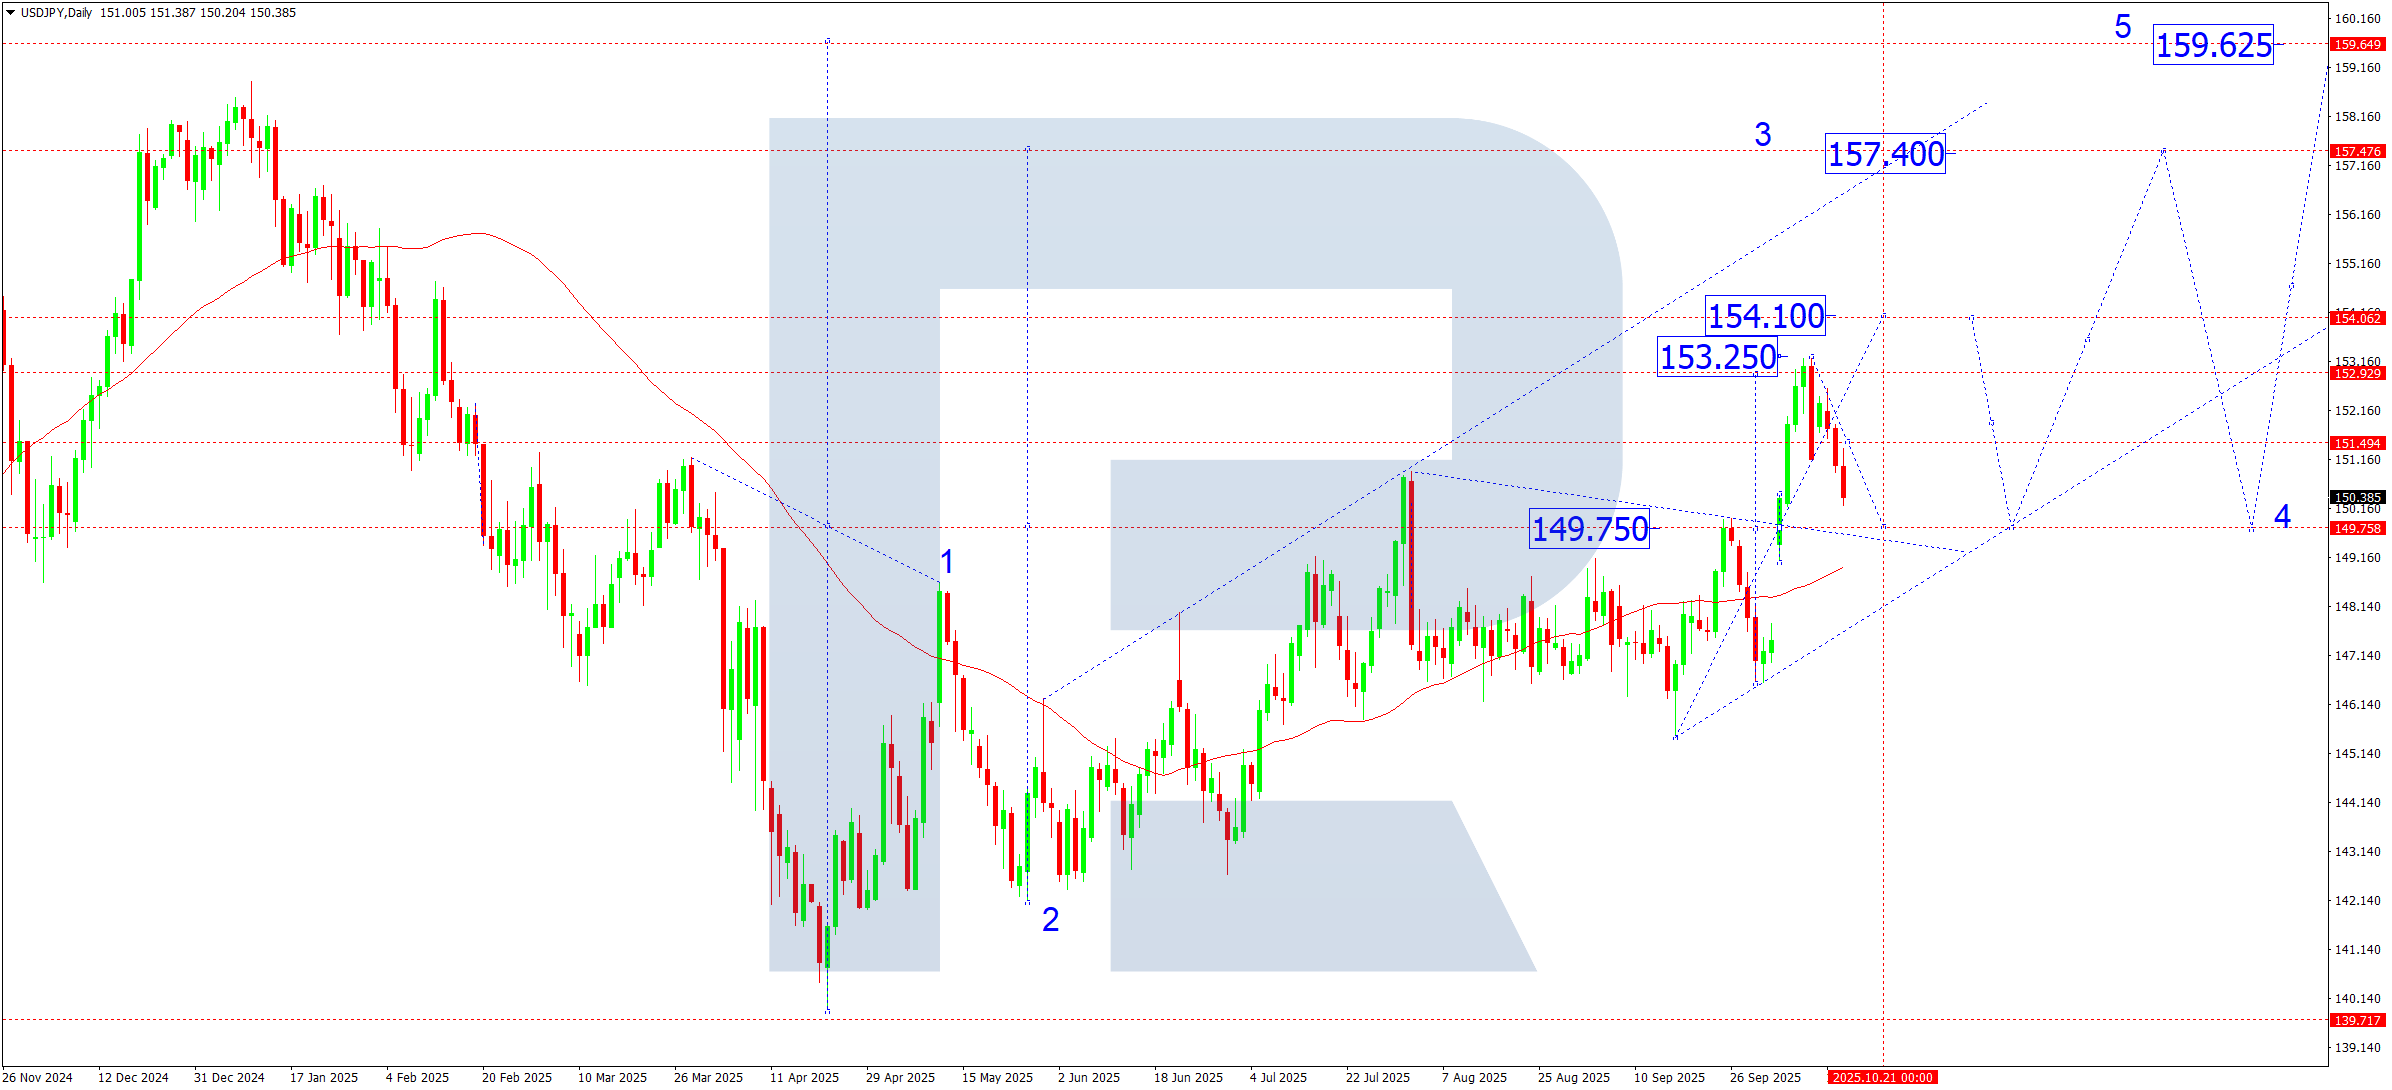
USDJPY technical analysis
On the daily chart, the USDJPY pair broke above the 149.75 level and hit the local wave target at 153.25. Last week, a correction developed to 150.20. This week, an upswing to 151.50 can form, followed by another dip to retest the 149.75 level from above. After the correction, the pair is expected to start a new upward move towards 154.10, potentially extending the trend to 157.40. The 154.10 level is a local target of the third wave, with 157.40 acting as the key target of the current upward cycle.
USDJPY forecast scenarios
Bullish (main) scenario: the breakout above the 149.75 level confirmed the third growth wave.
- target 1: 154.10 (local within the structure)
- target 2: 157.40 (main third-wave target)
Bearish (alternative) scenario: a firm breakout below the 149.00 level on rising volumes would open the door for a deeper correction towards 146.55, where a new base for growth can form.
GBPUSD forecast
The pound’s backdrop remains mixed. US shutdown strain and dollar instability continue to pressure the GBP, yet global capital flows continue to support demand for safe-haven assets rather than risky currencies. UK data stays weak: manufacturing and services slow, increasing expectations for a softer Bank of England tone. Markets are gradually pricing in a rate cut as early as December, which caps sterling’s upside.
Trump-style tariff talk towards Europe adds uncertainty to US-UK relations, leaving the UK vulnerable after Brexit. Sellers keep control, while rebounds still look technical.
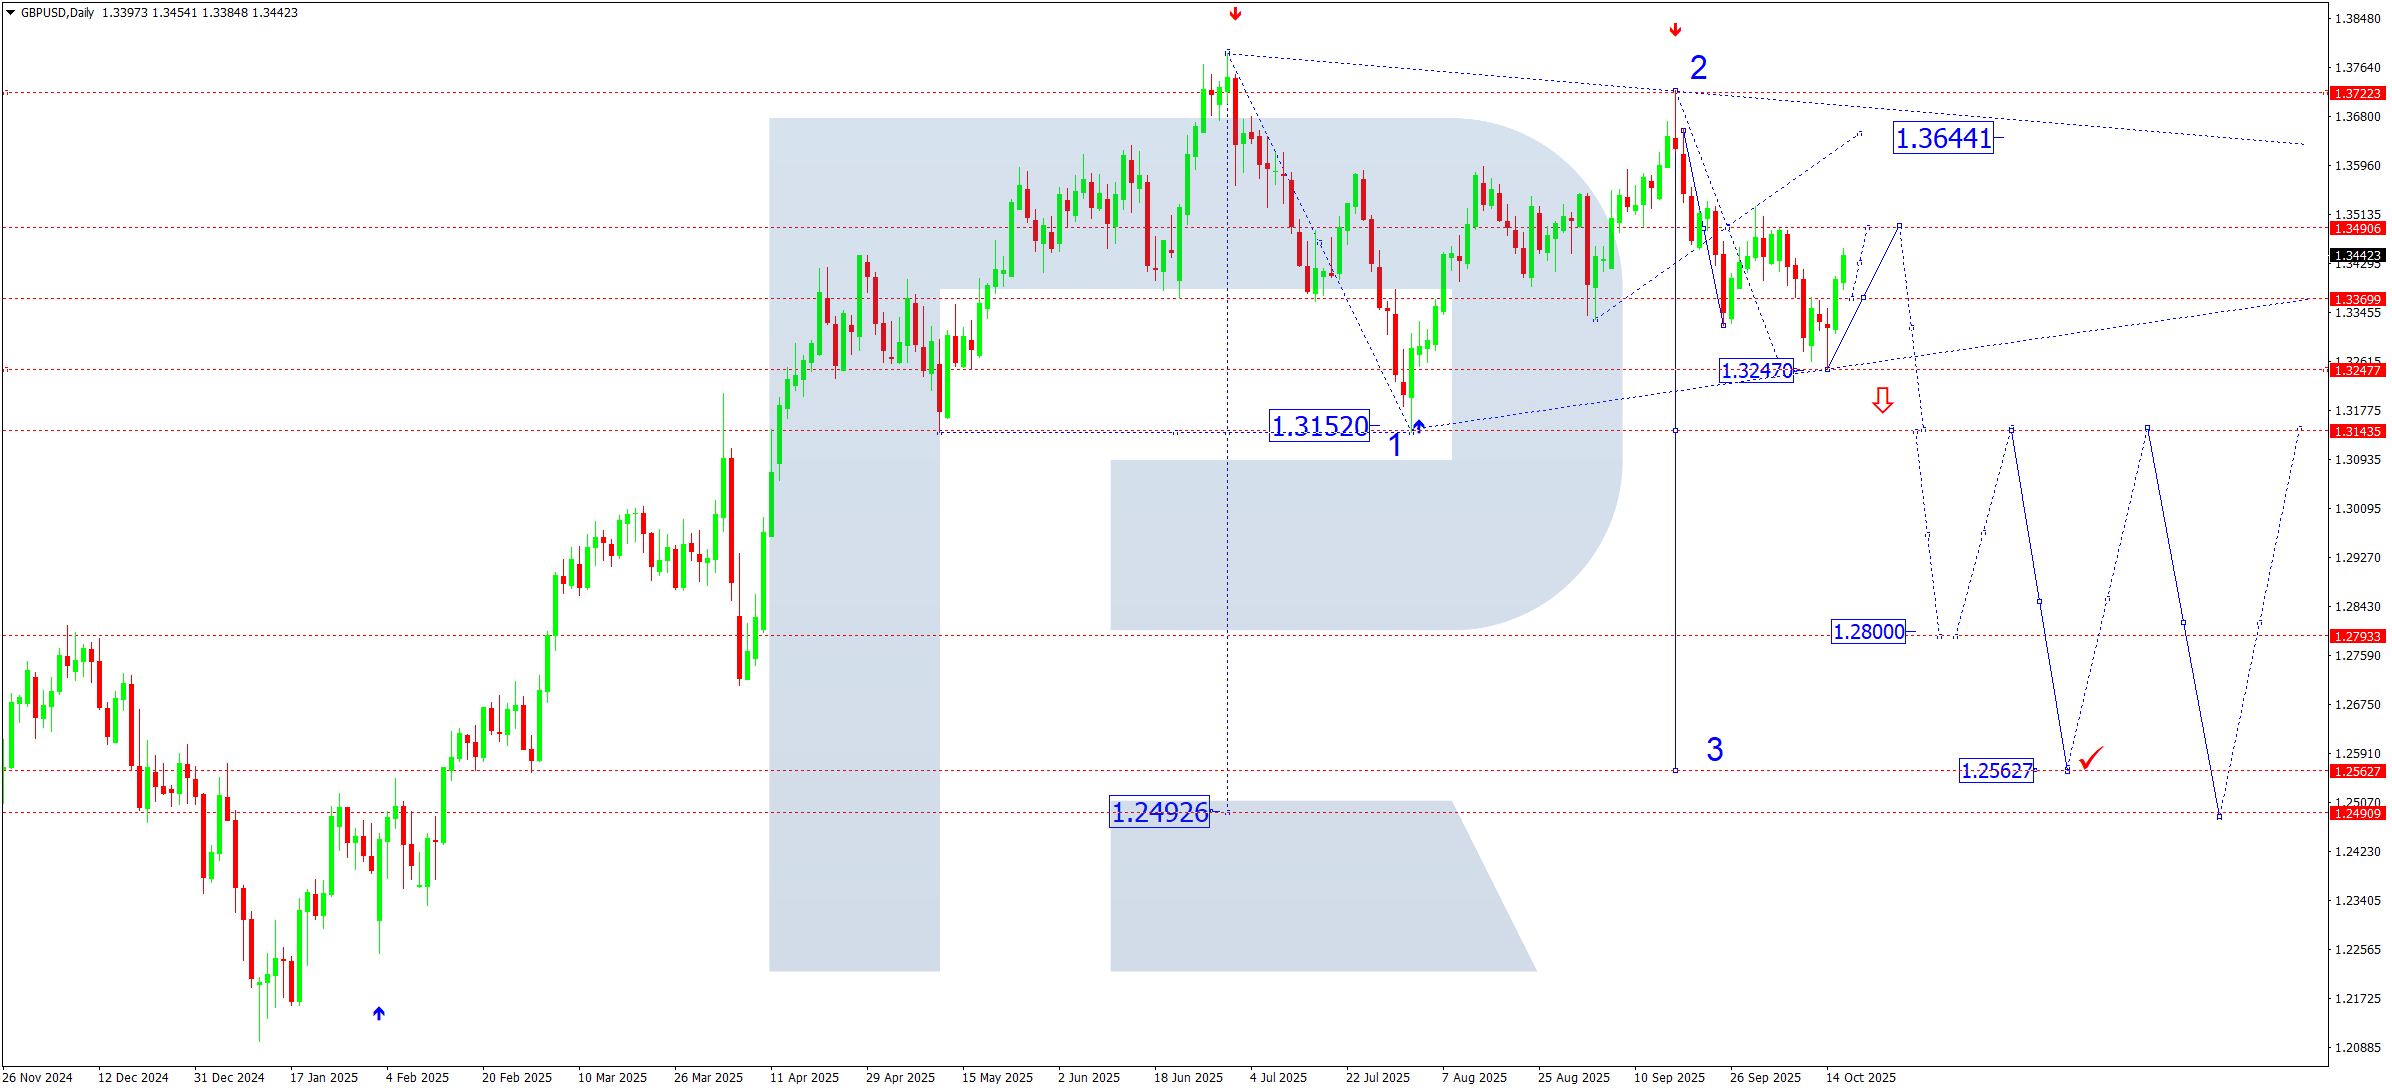
GBPUSD technical analysis
On the daily chart, the GBPUSD pair is forming a wide consolidation range around 1.3490. The market completed a downward move towards 1.3247. Last week, a correction started towards 1.3490 (testing from below). After this corrective leg, bearish momentum is expected to resume, with a target at 1.3150. A breakout below this level would open room to extend the third wave down with a local estimated target at 1.2562.
GBPUSD forecast scenarios
Bearish (main) scenario: the five-wave decline stays in priority.
The market is developing the third wave with a nearby target at 1.3152, likely only the first part. The wave’s main target stands at 1.2562.
Bullish (alternative) scenario: a sustained consolidation above 1.3500 would unlock a rise to 1.3644, the top of the consolidation triangle. However, this scenario is viable only if a breakout is confirmed and risk appetite persists.
AUDUSD forecast
The Australian dollar remains under external pressure from several factors. First, US budget uncertainty and recurring shutdown threats drive swings in Treasury yields and increase demand for the dollar as a safe-haven asset. Second, the Trump-era trade war is in the spotlight again, with tariff initiatives against Asian manufacturers raising risks for Australia’s export-commodity economy oriented towards China.
Additional pressure comes from a cooling in China’s industrial sector: the September PMI hovers near 50, hurting iron ore export prospects. The RBA keeps a mild tone; markets increasingly expect any tightening cycle to start no earlier than mid-2026, which limits demand for the AUD as a growth currency. Domestically, the labour market looks steady, but slower credit growth and a cooling housing market signal a weak internal impulse.
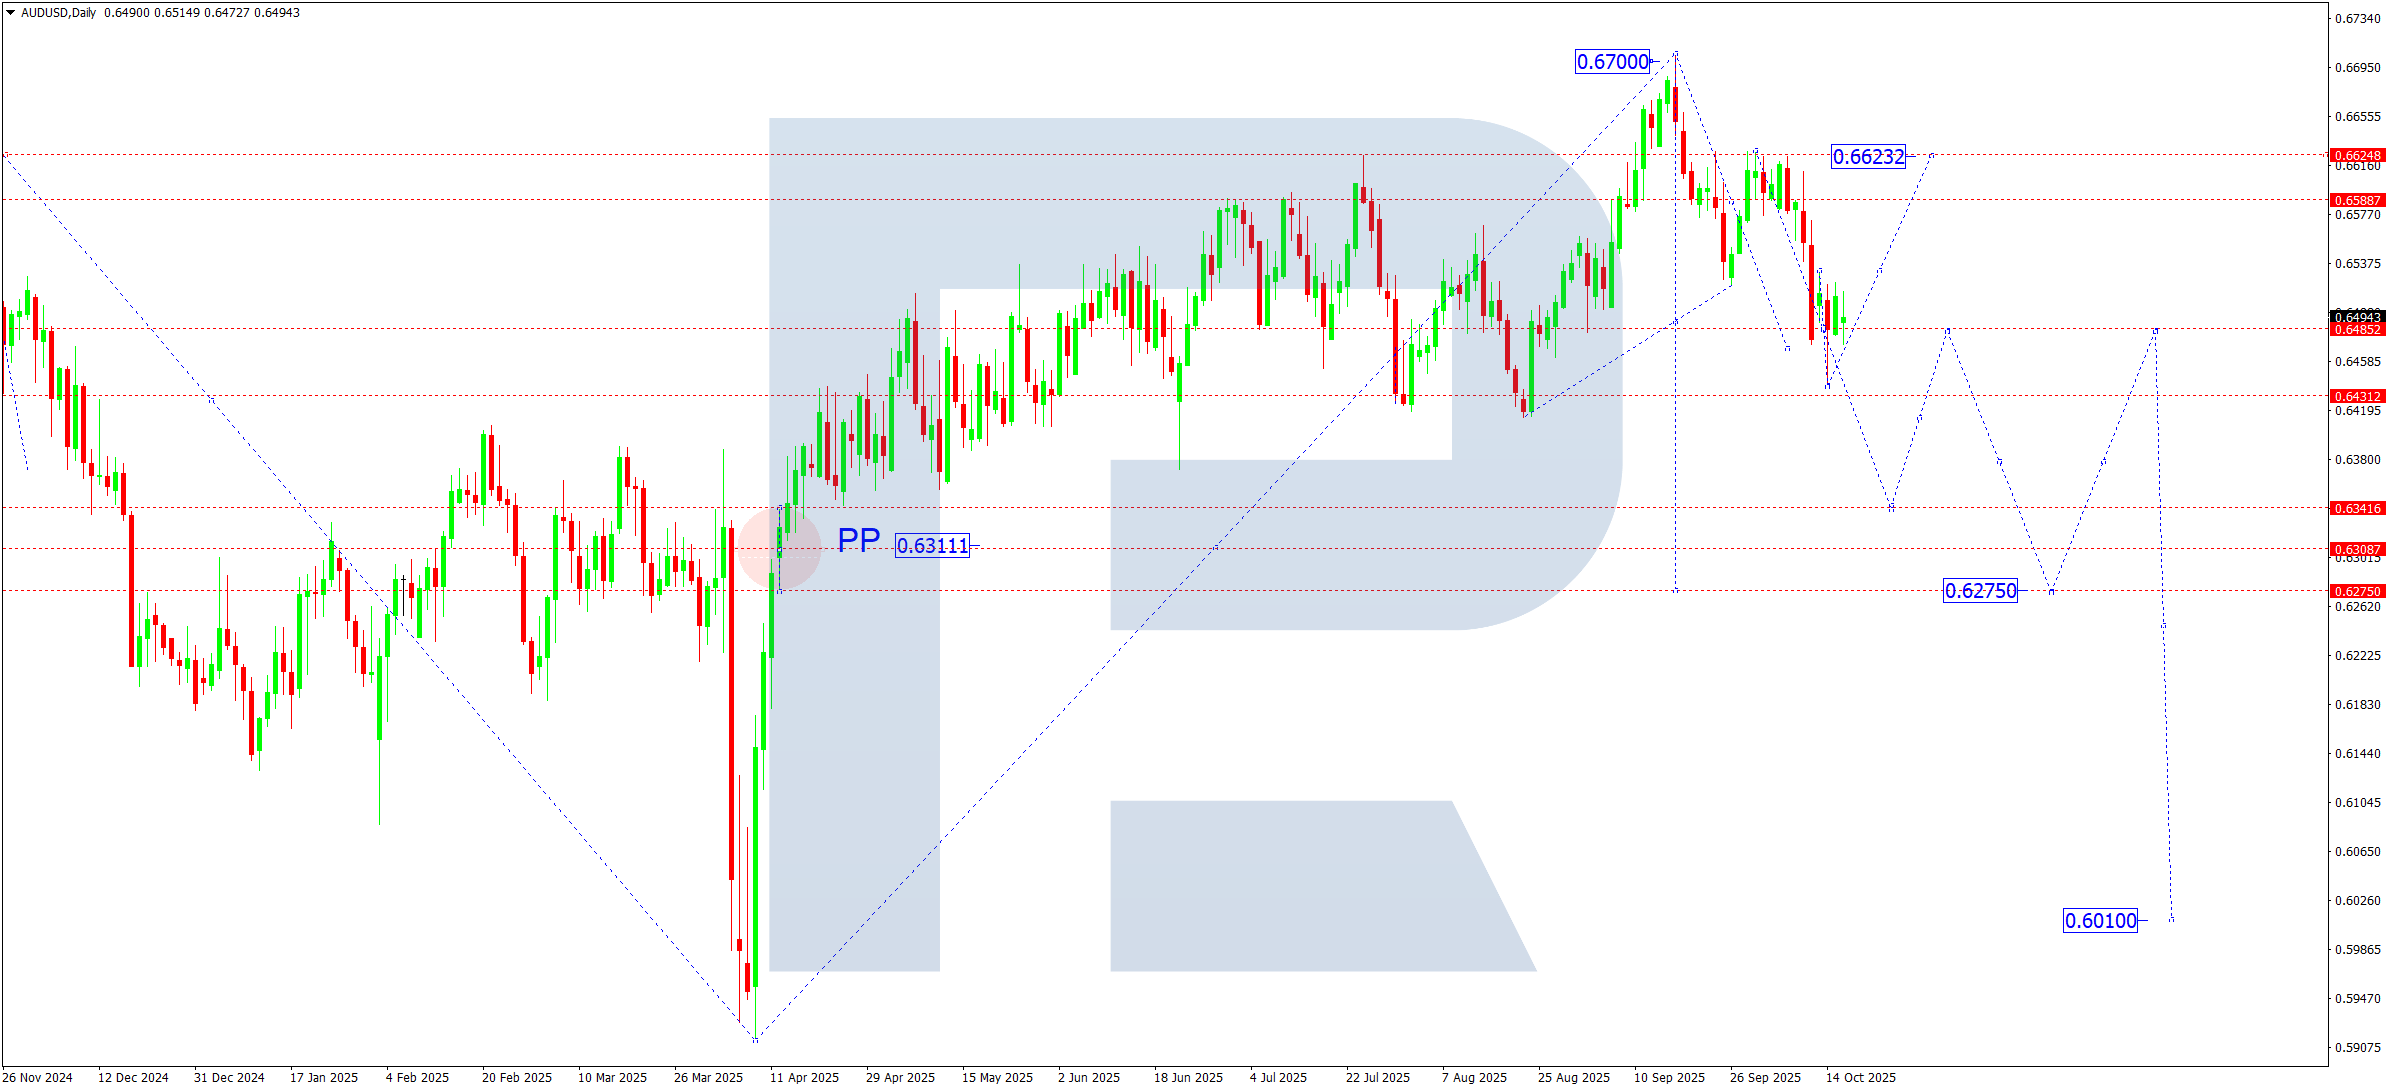
AUDUSD technical analysis
On the daily chart, the AUDUSD pair continues to form a wide consolidation range around 0.6485. This week, the range can extend down to 0.6440. A breakout below 0.6440 would open the door for a downward move towards 0.6340, a local estimated target. If the price breaks out of the range upwards, a corrective leg to 0.6623 is possible. After the correction, the pair is expected to slip towards at least 0.6340.
AUDUSD forecast scenarios
Bearish (main) scenario:
- #.0.6400 – intermediate target. Confirmation of a new pivot point at 0.6485 for the current downward wave
- #.0.6340 – target of the third downward wave
Bullish (alternative) scenario: a firm consolidation above 0.6530 would open the path to 0.6623.
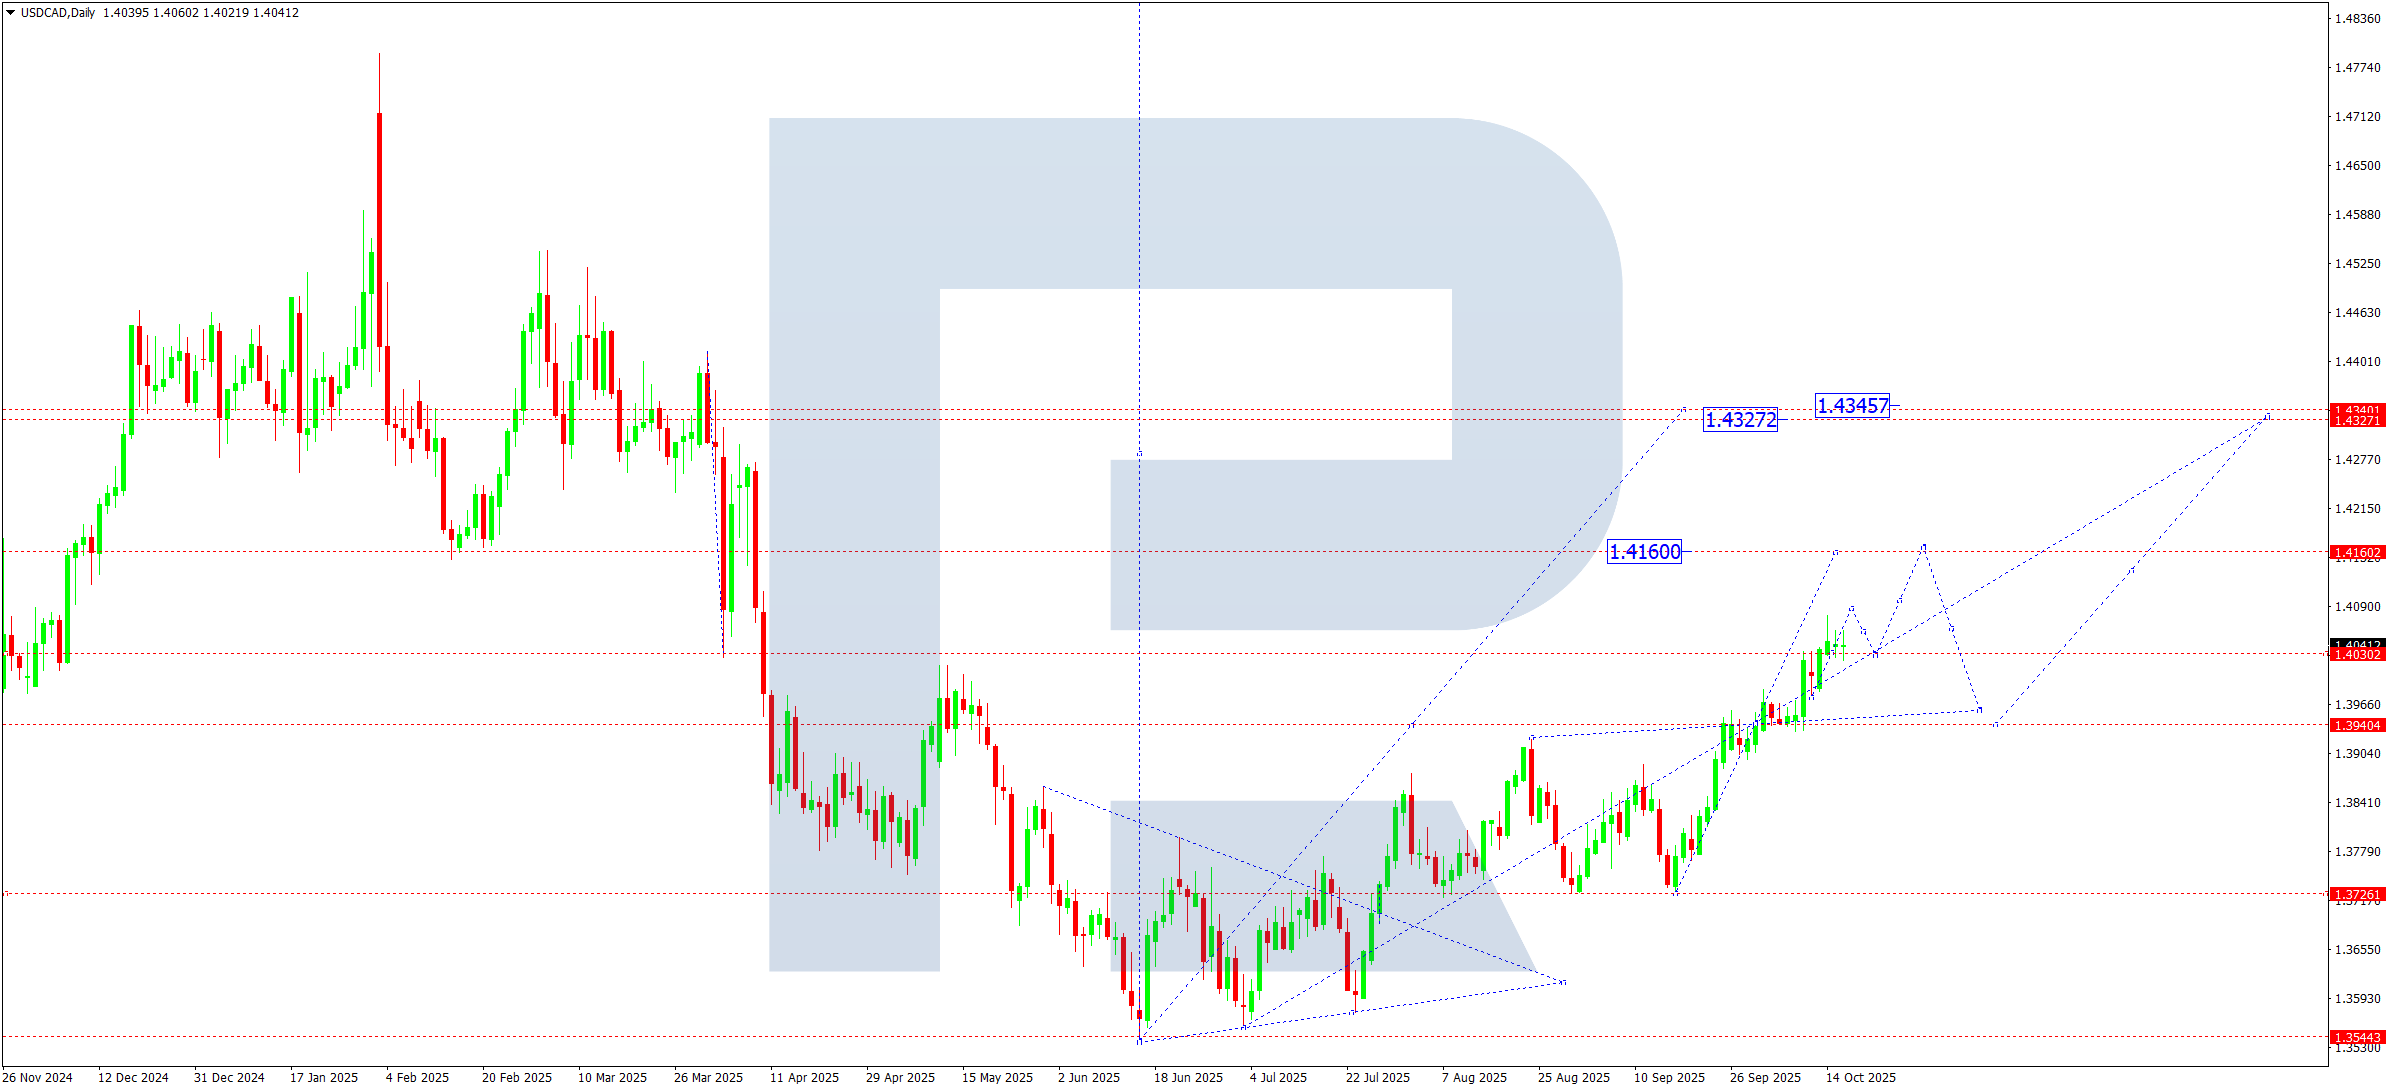
USDCAD forecast
The Canadian dollar remains pressured as oil prices soften and US yields rise. Markets watch for signs of a Canadian slowdown while the Bank of Canada keeps signalling the need to hold rates higher to control inflation. With a stronger USD and rising geopolitical strain (trade tensions with China and US shutdown risk), the appetite for commodity-based currencies remains limited. Weak global demand for commodities adds to pressure due to the growing risk of recession in Europe and Asia.
USDCAD technical analysis
On the daily chart, the USDCAD pair finished to form a wide consolidation range around 1.3939 and broke upwards, marking a pivot point for the current medium-term upward wave. Last week, the price extended the impulse and broke the 1.4030 level, building a compact consolidation range around it, which signals volume accumulation before trend continuation. It is relevant to consider the development of the third growth wave with an estimated target at 1.4160 and scope to extend towards 1.4325 – the key local target of the current impulse.
USDCAD forecast scenarios
Bullish (main) scenario: a breakout and consolidation above 1.4030 confirm the potential for the next upward move towards 1.4160, with the prospect of extending the momentum to 1.4325.
Bearish (alternative) scenario: a sharp pullback and breakout below 1.3900 can trigger a correction towards 1.3727, where a new base for the next advance may form.
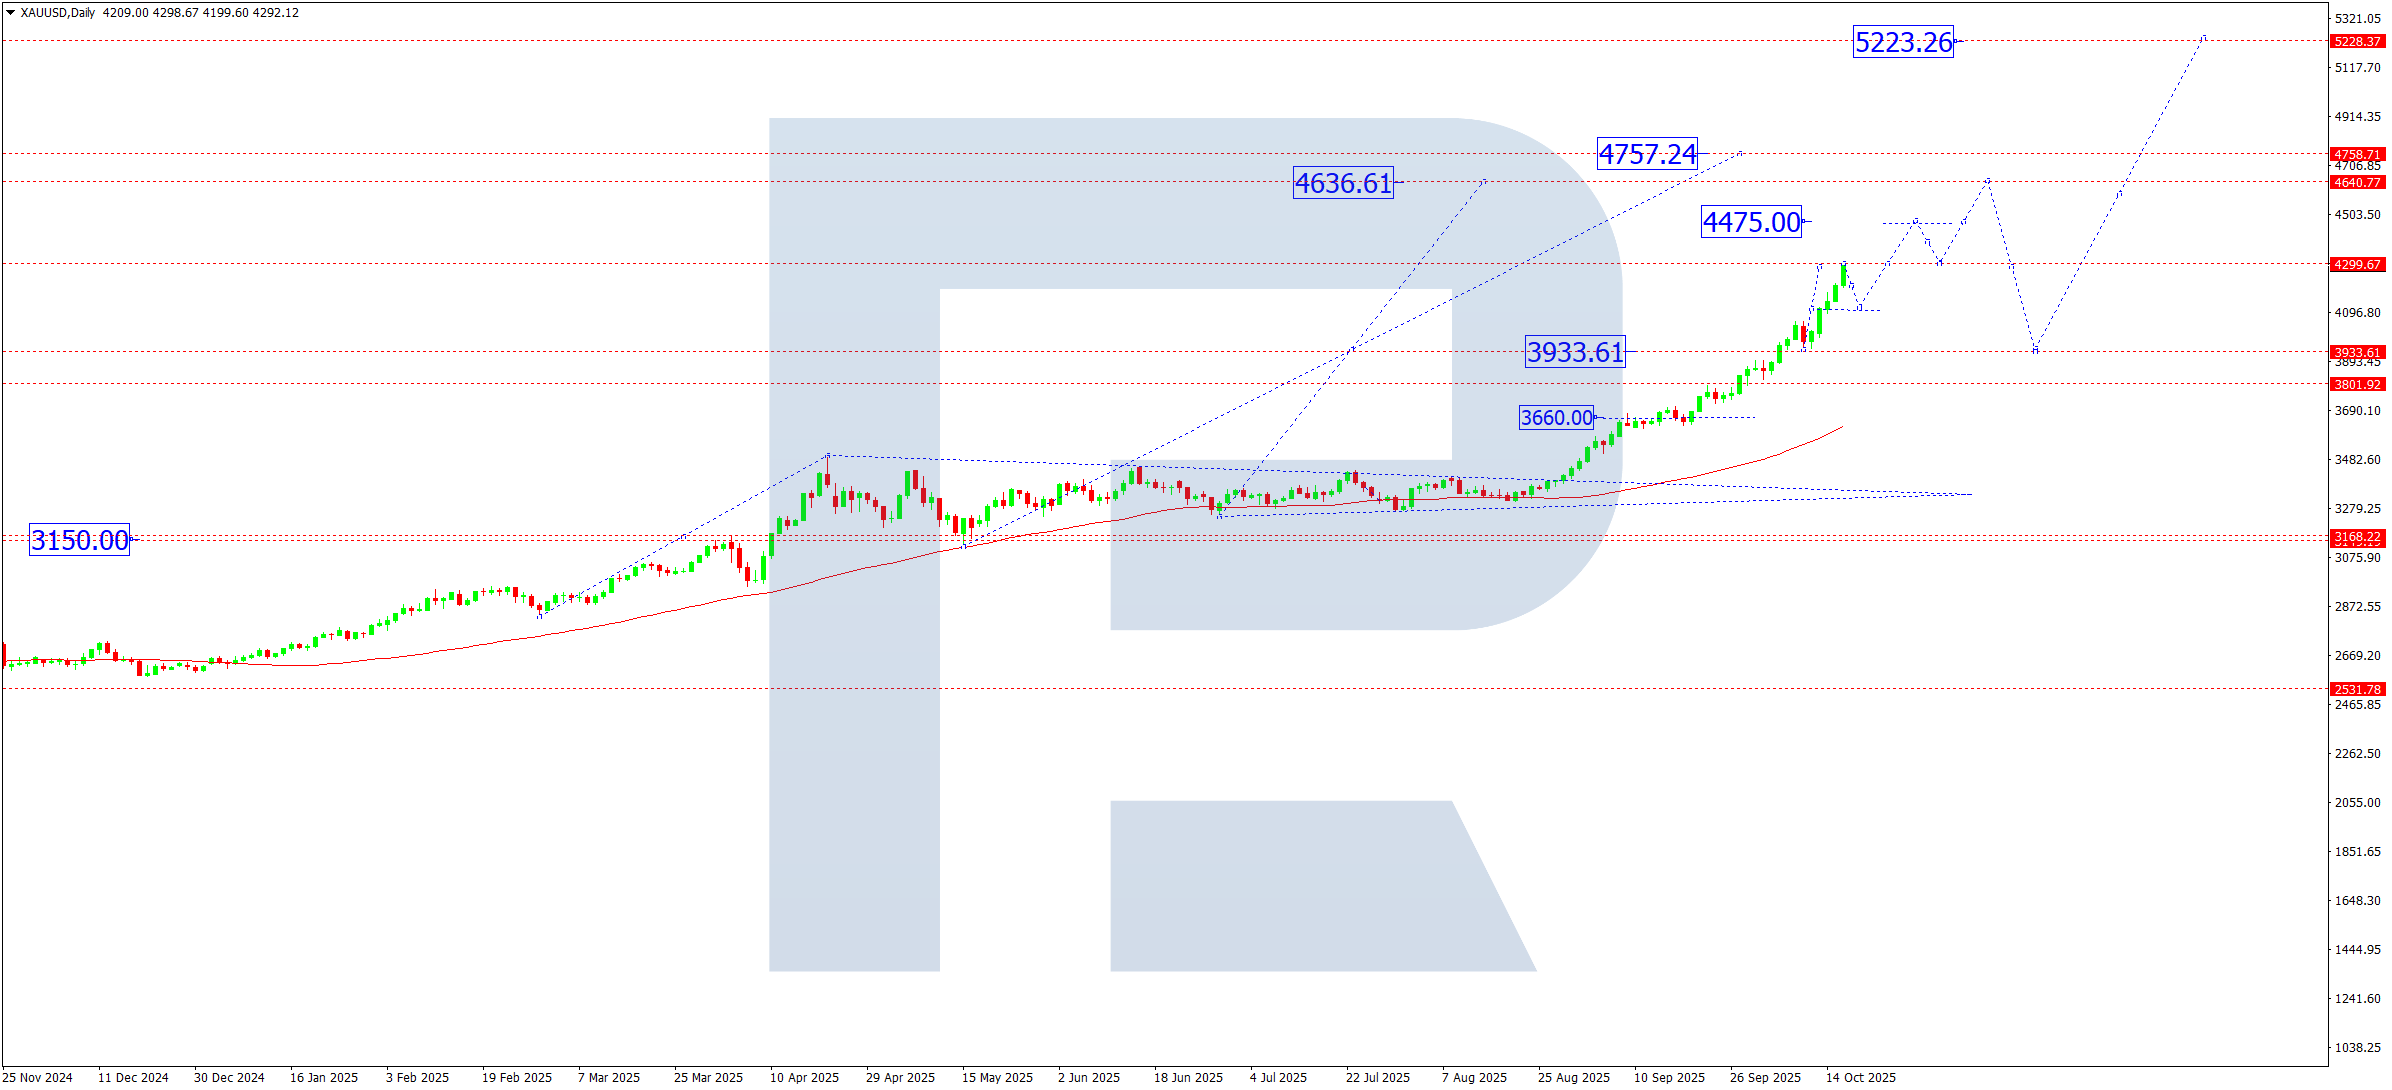
XAUUSD forecast
Markets still expect the Fed to pivot soon. Participants price in the start of a rate-cut cycle in the coming months, which supports demand for reliable assets. Gold keeps its safe-haven role. Shutdown wrangling in the US and a revived Trump-style trade war heighten geopolitical and financial tensions, creating a supportive backdrop for gold’s upward momentum.
XAUUSD technical analysis
On the daily chart, after breaking above the 3,940 level, gold rallied to 4,300 and continues a strong bullish momentum. Prices are currently trading in an active growth phase and can extend the wave towards 4,475, 4,636, 4,757 and further to 5,000. The market has not yet created conditions for a major correction: momentum stays firmly bullish, and consolidations are short-term, used to build positions in line with the trend
XAUUSD forecast scenarios
Bullish (main) scenario: consolidation above 3,940 confirmed upside potential with nearby targets at 4,475, 4,636 and 4,757. In the long term, the momentum may continue towards 5,000.
Bearish (alternative) scenario: a breakout and consolidation below 4,135 would open the door for a decline towards 3,940 (intermediate support) and 3,660 (zone of technical and fundamental correction).
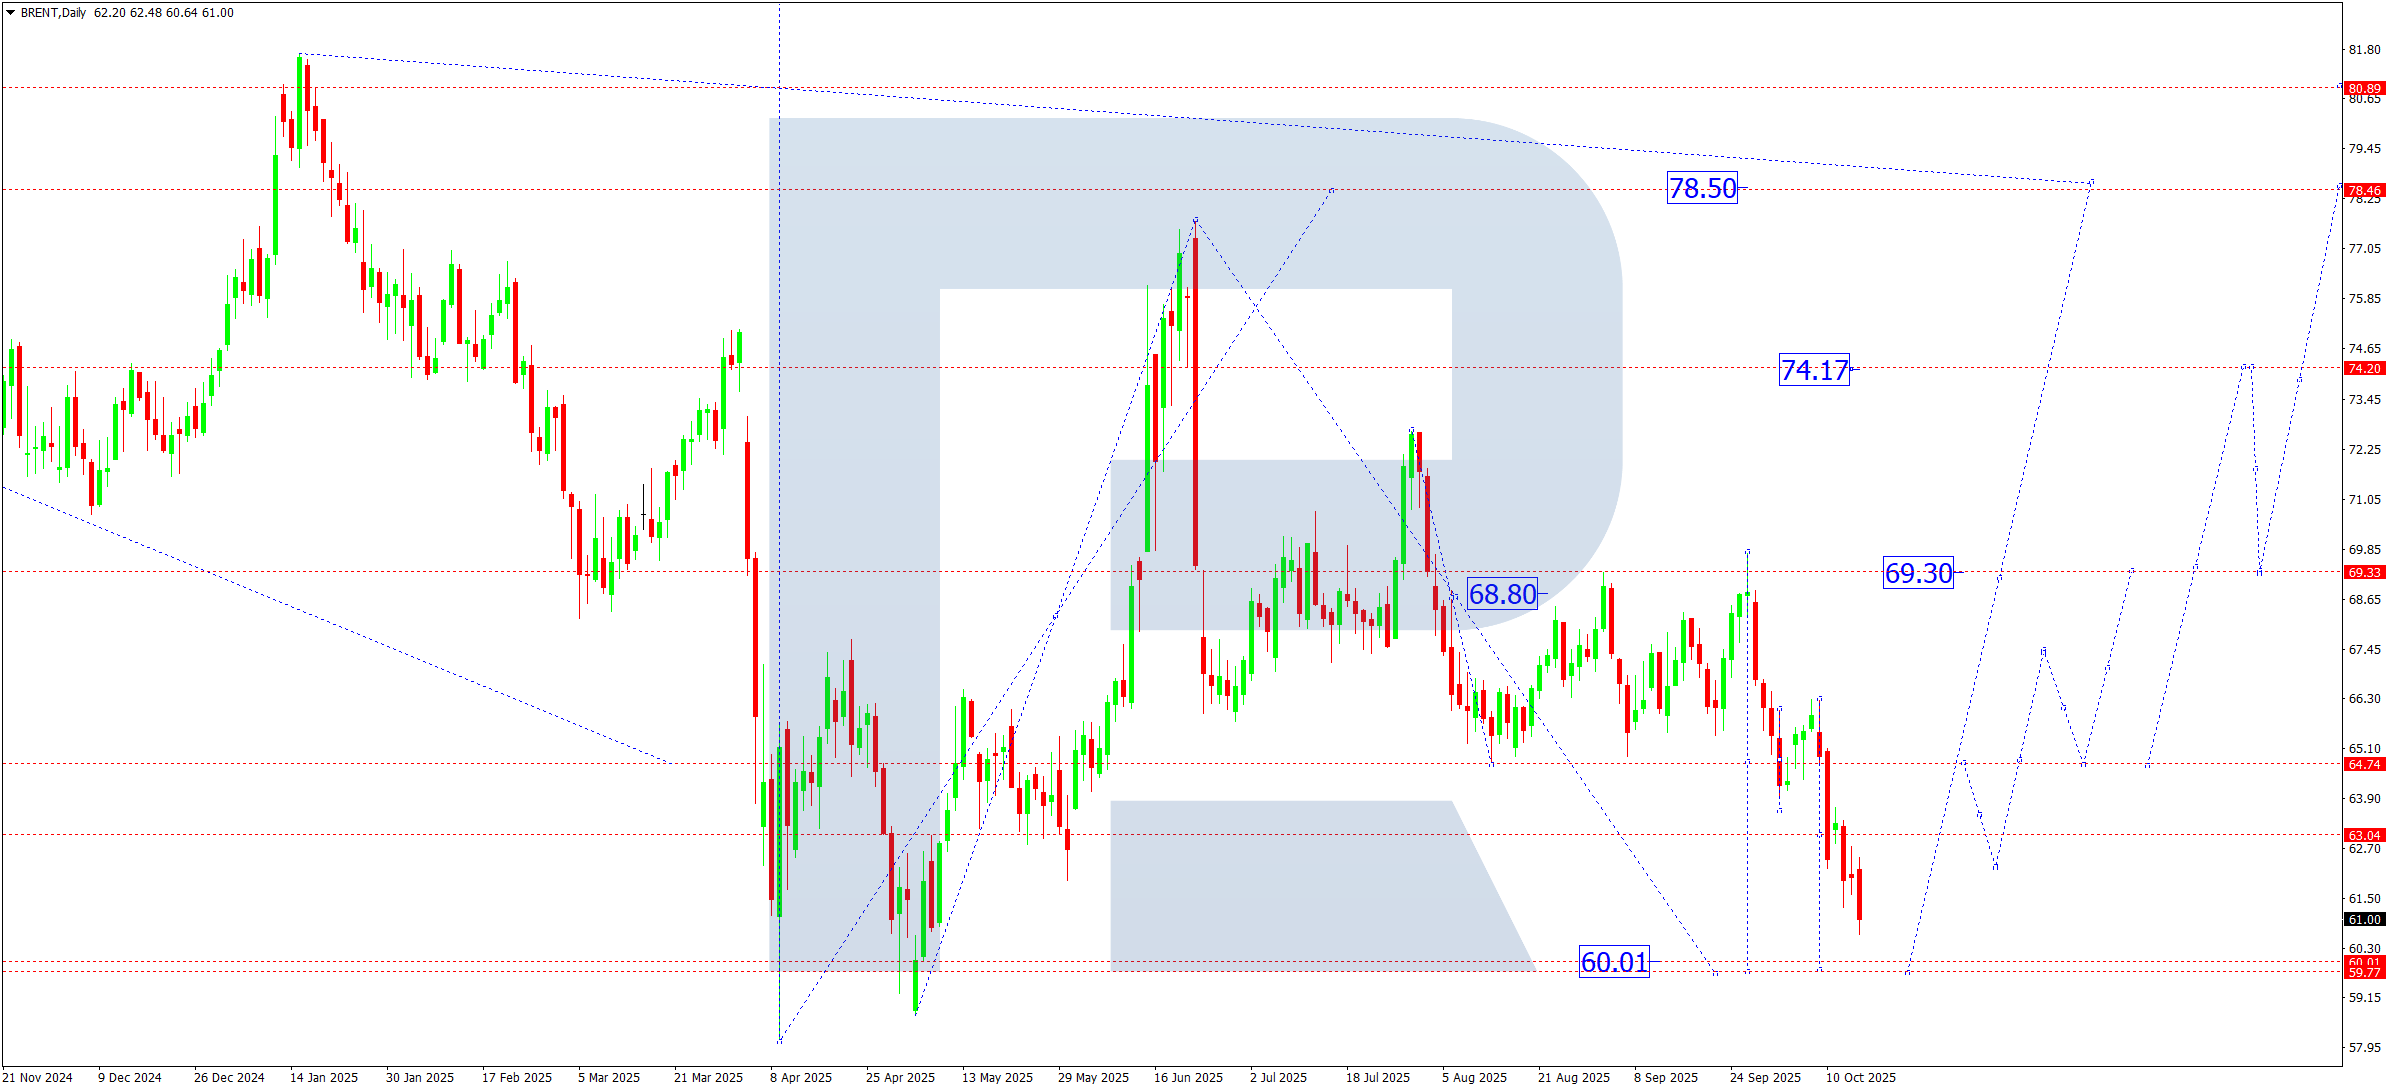
Brent forecast
Oil stays volatile under a mix of factors – high uncertainty on global demand amid weaker industrial activity in China and Europe, set against persistent geopolitical risks that quietly support prices. Investors watch rising tensions in the Middle East, where supply disruption risks remain. Venezuela’s internal political clashes also lift the odds of export cuts. Talks between the US and several OPEC+ countries on output levels have yet to deliver concrete results. In the US, shutdown risk and widening trade frictions with China add to volatility in crude prices.
Brent technical analysis
On the daily chart, Brent decisively broke below the 63.00 level and, after consolidating, extended the decline to 60.00, the main target of the current corrective structure. From this support area, prices are expected to rebound to 64.74 as the first target and a potential base for a turn towards a new upward wave targeting 69.30 and higher.
Brent forecast scenarios
Bearish (base) scenario: a breakout below 63.00 confirms development of the fourth corrective wave with a main downside target at 60.00.
Bullish (alternative) scenario: given elevated geopolitical tensions in Europe, the Middle East and around Venezuela, a sharp price spike cannot be ruled out. In this case, growth targets sit at:
- 69.00 – first recovery target
- 74.17 – second target
- 78.50 – main target of the presumed first growth wave
Forecasts presented in this section only reflect the author’s private opinion and should not be considered as guidance for trading. RoboForex bears no responsibility for trading results based on trading recommendations described in these analytical reviews.