Weekly technical analysis and forecast (13–17 October 2025)
This weekly technical analysis highlights the key chart patterns and levels for EURUSD, USDJPY, GBPUSD, AUDUSD, USDCAD, gold (XAUUSD), and Brent crude oil to forecast market moves for the upcoming week (13–17 October 2025)
Major technical levels to watch this week
- EURUSD: Support: 1.1515, 1.14Resistance: 1.1650, 1.1780
- USDJPY: Support: 152.00, 151.Resistance: 154.10, 155.75
- GBPUSD: Support: 1.3120, 1.294Resistance: 1.3330, 1.3550
- AUDUSD: Support: 0.6500, 0.638Resistance: 0.6630, 0.6700
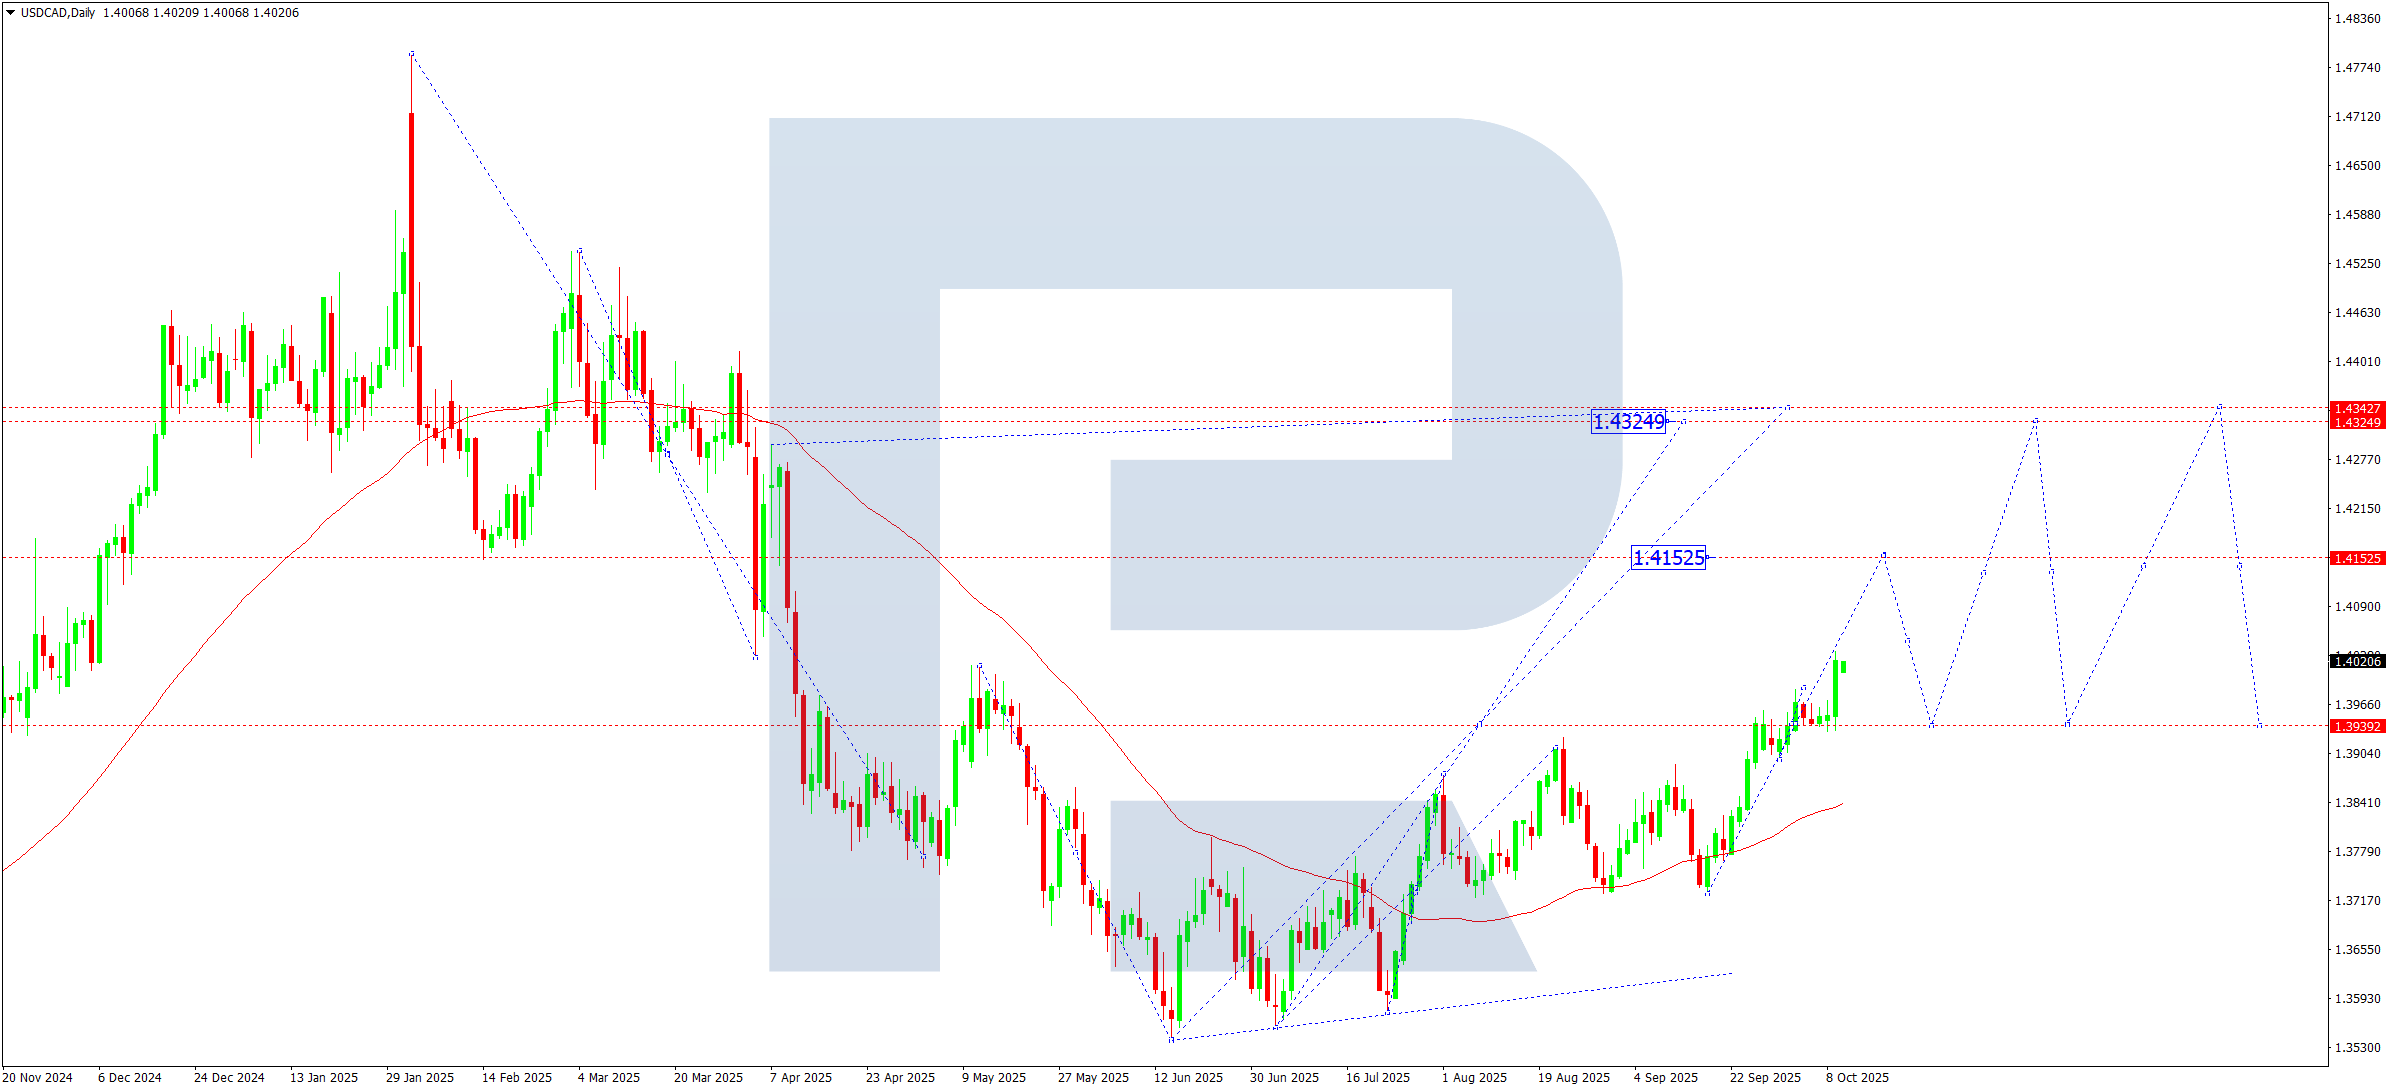
- USDCAD: Support: 1.3939, 1.385Resistance: 1.4150, 1.4325
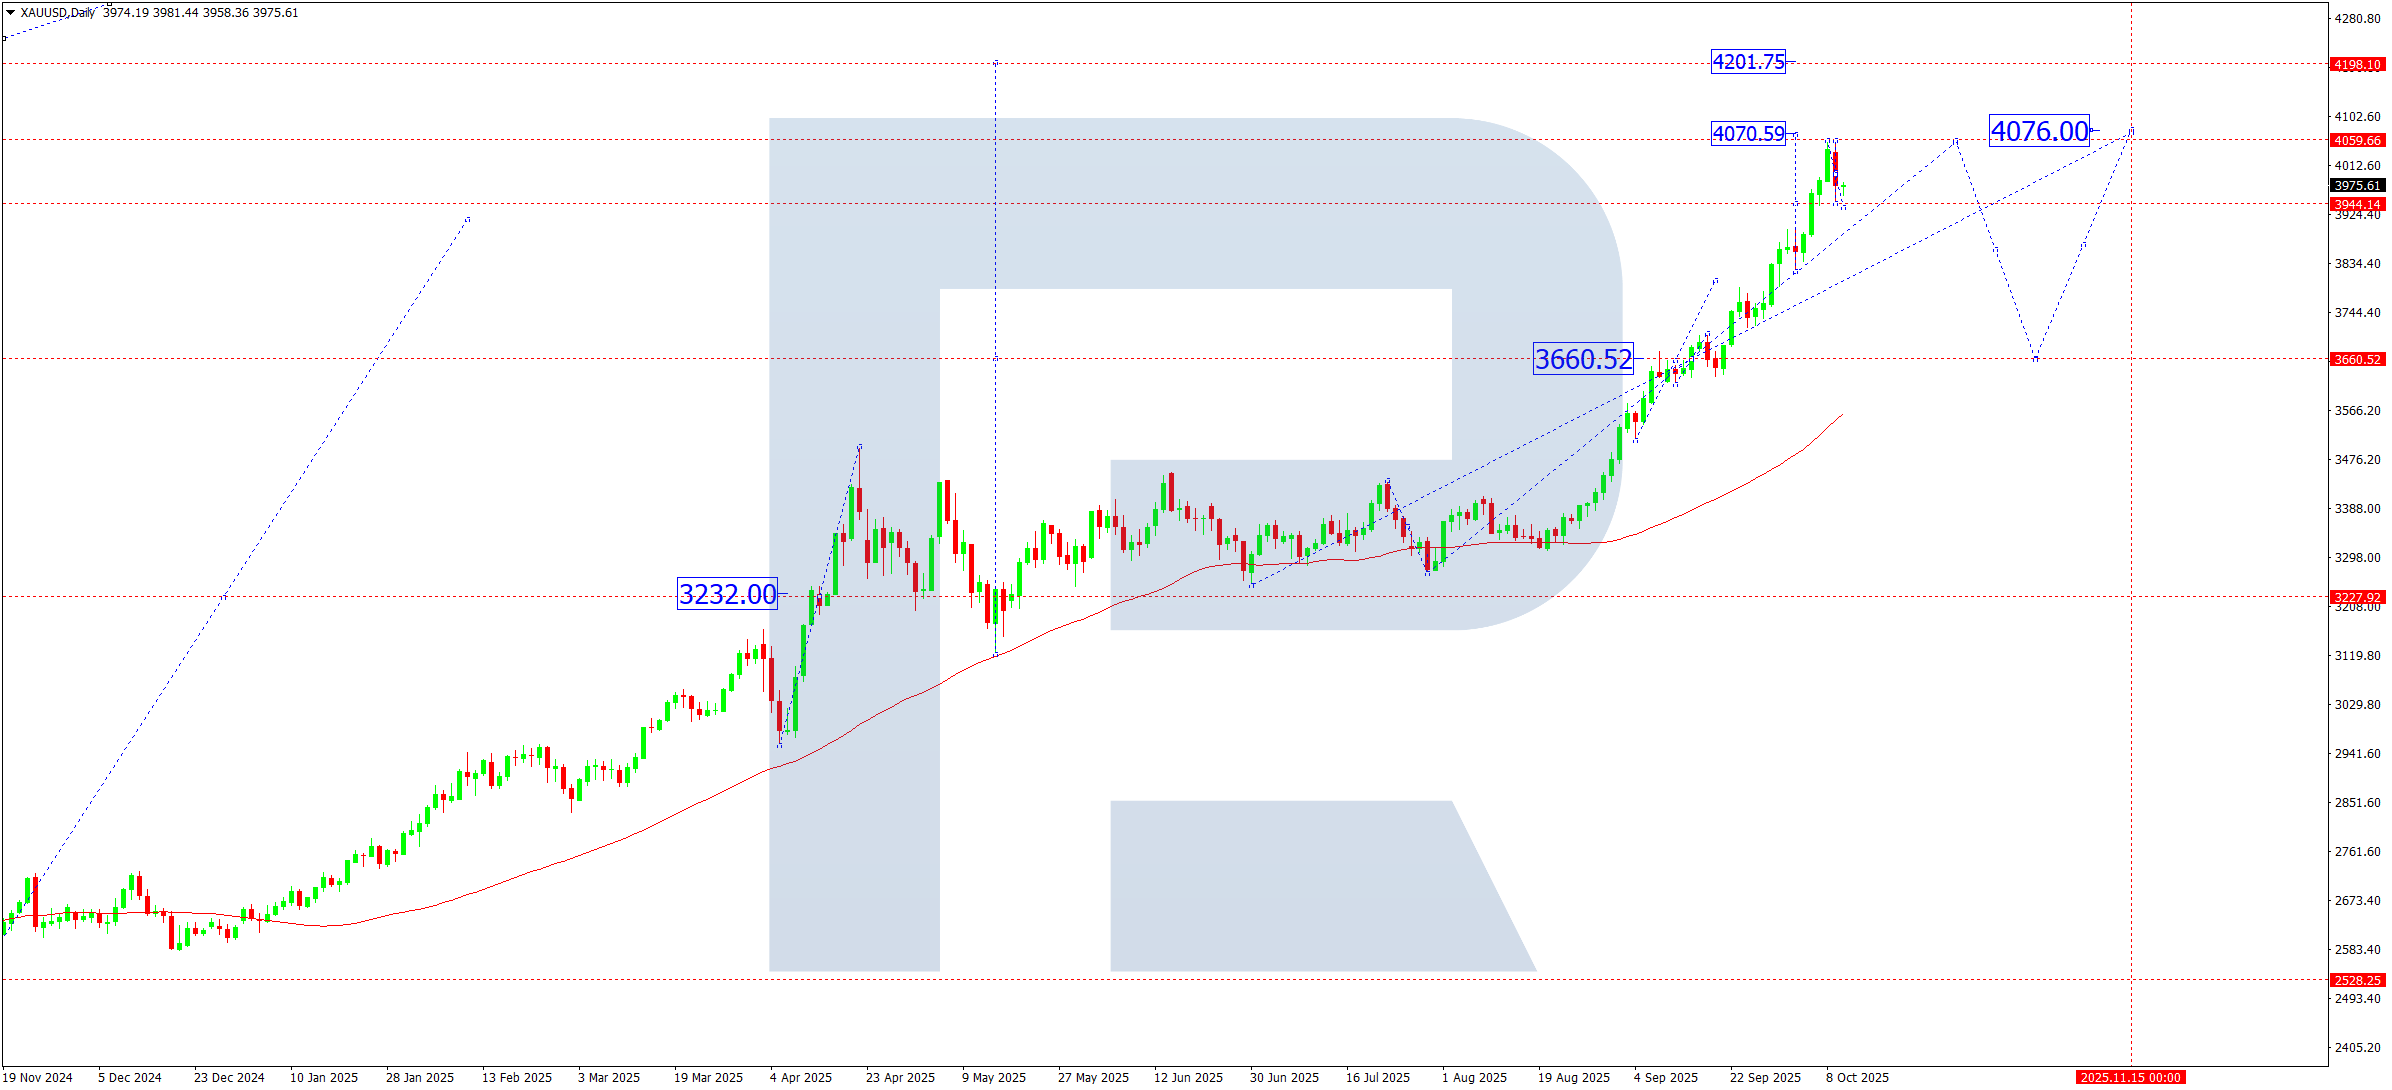
- Gold: Support: 3,940, 3,8Resistance: 4,070, 4,076
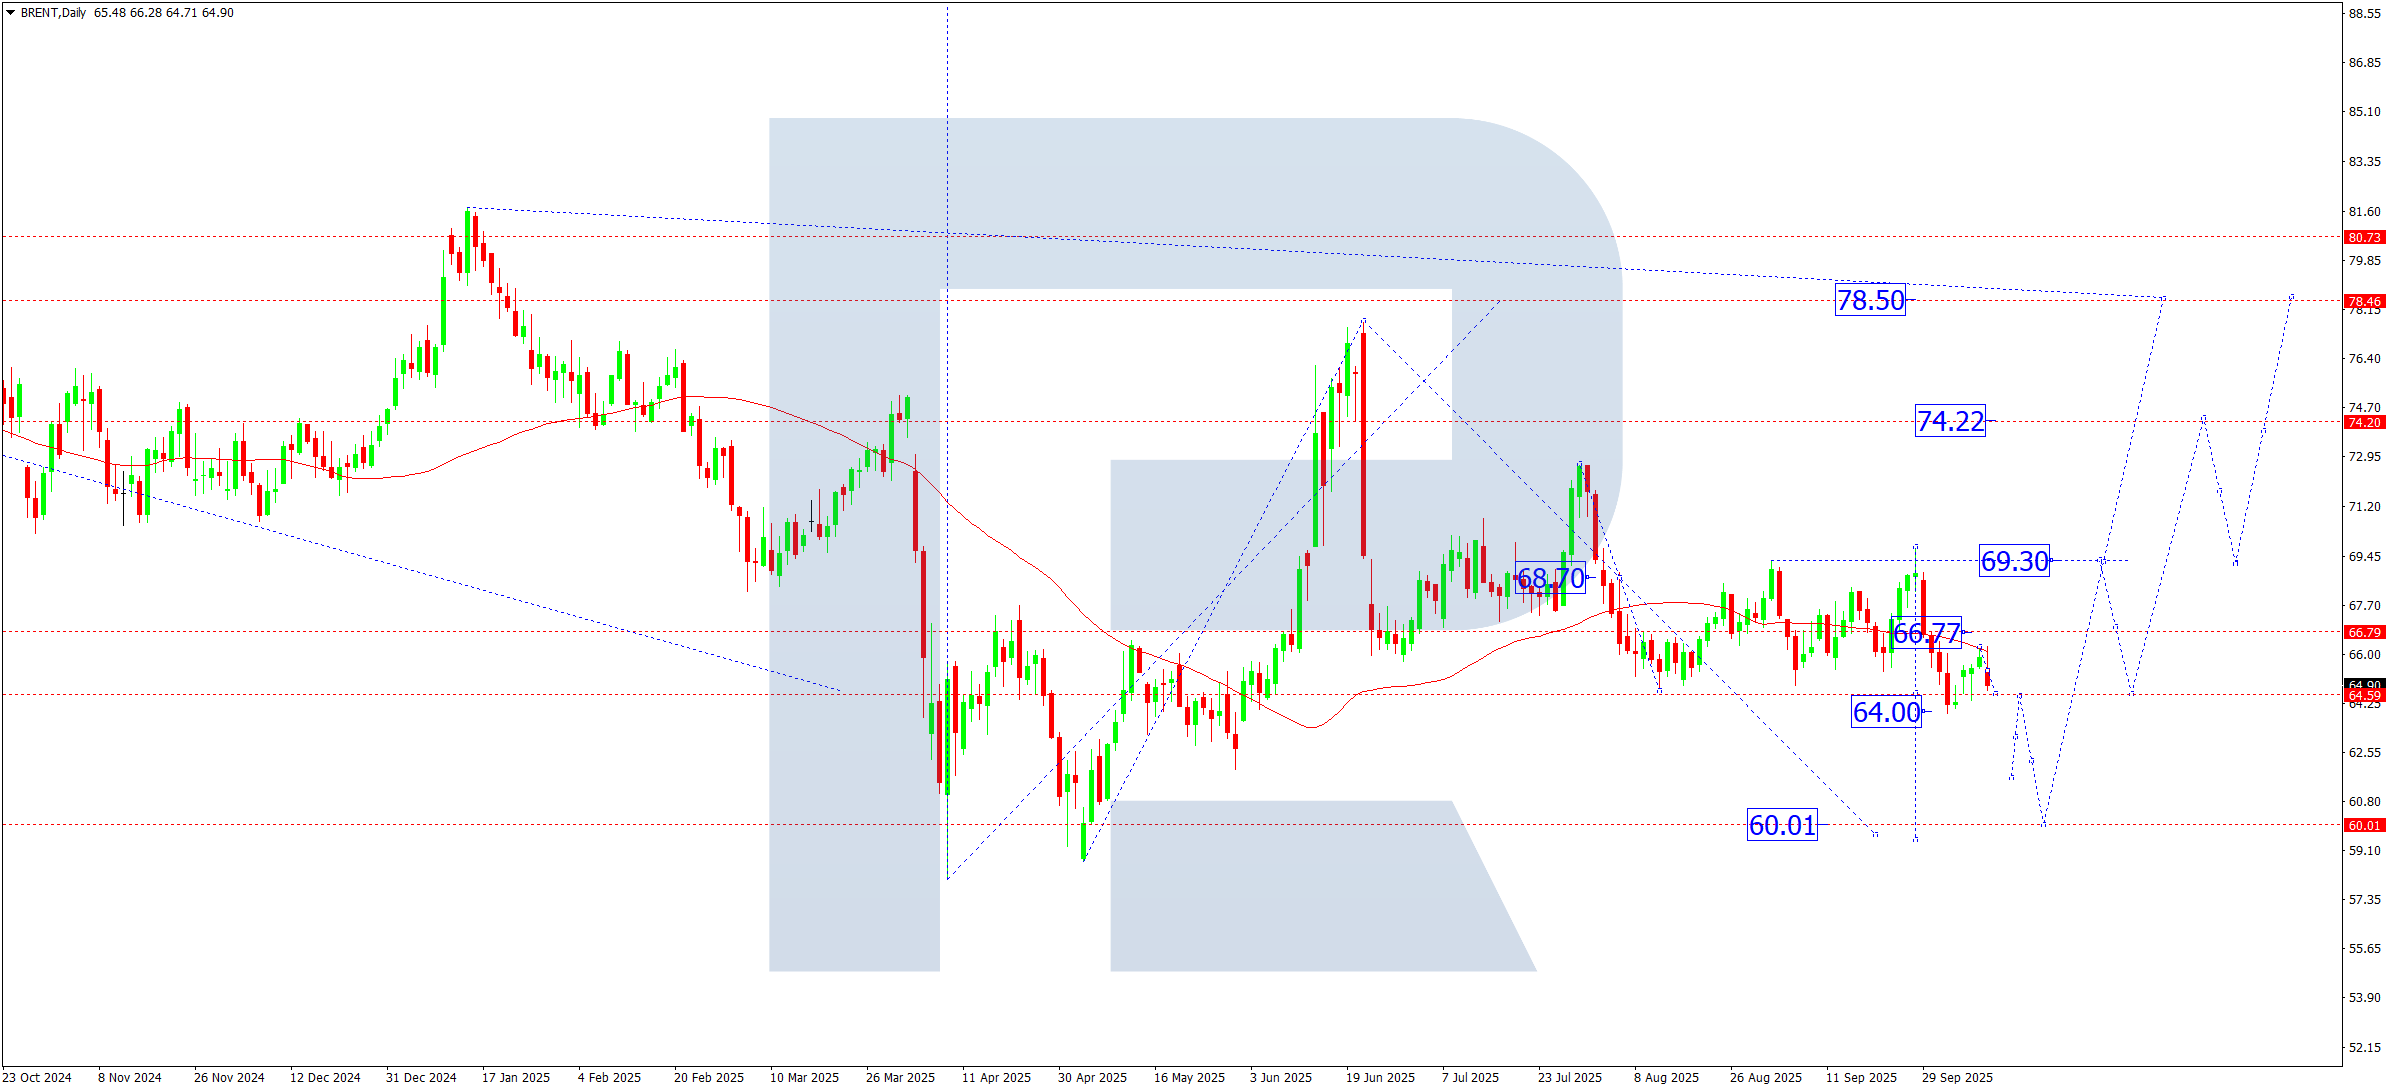
- Brent: Support: 64.00, 62.Resistance: 69.00, 74.22
EURUSD forecast
Pressure on the euro remains amid the resilience of the dollar index and fading expectations of a near-term Fed easing. Eurozone industrial production and the ZEW index may drive short bursts of volatility, but the overall bias for the pair stays moderately bearish.
EURUSD technical analysis
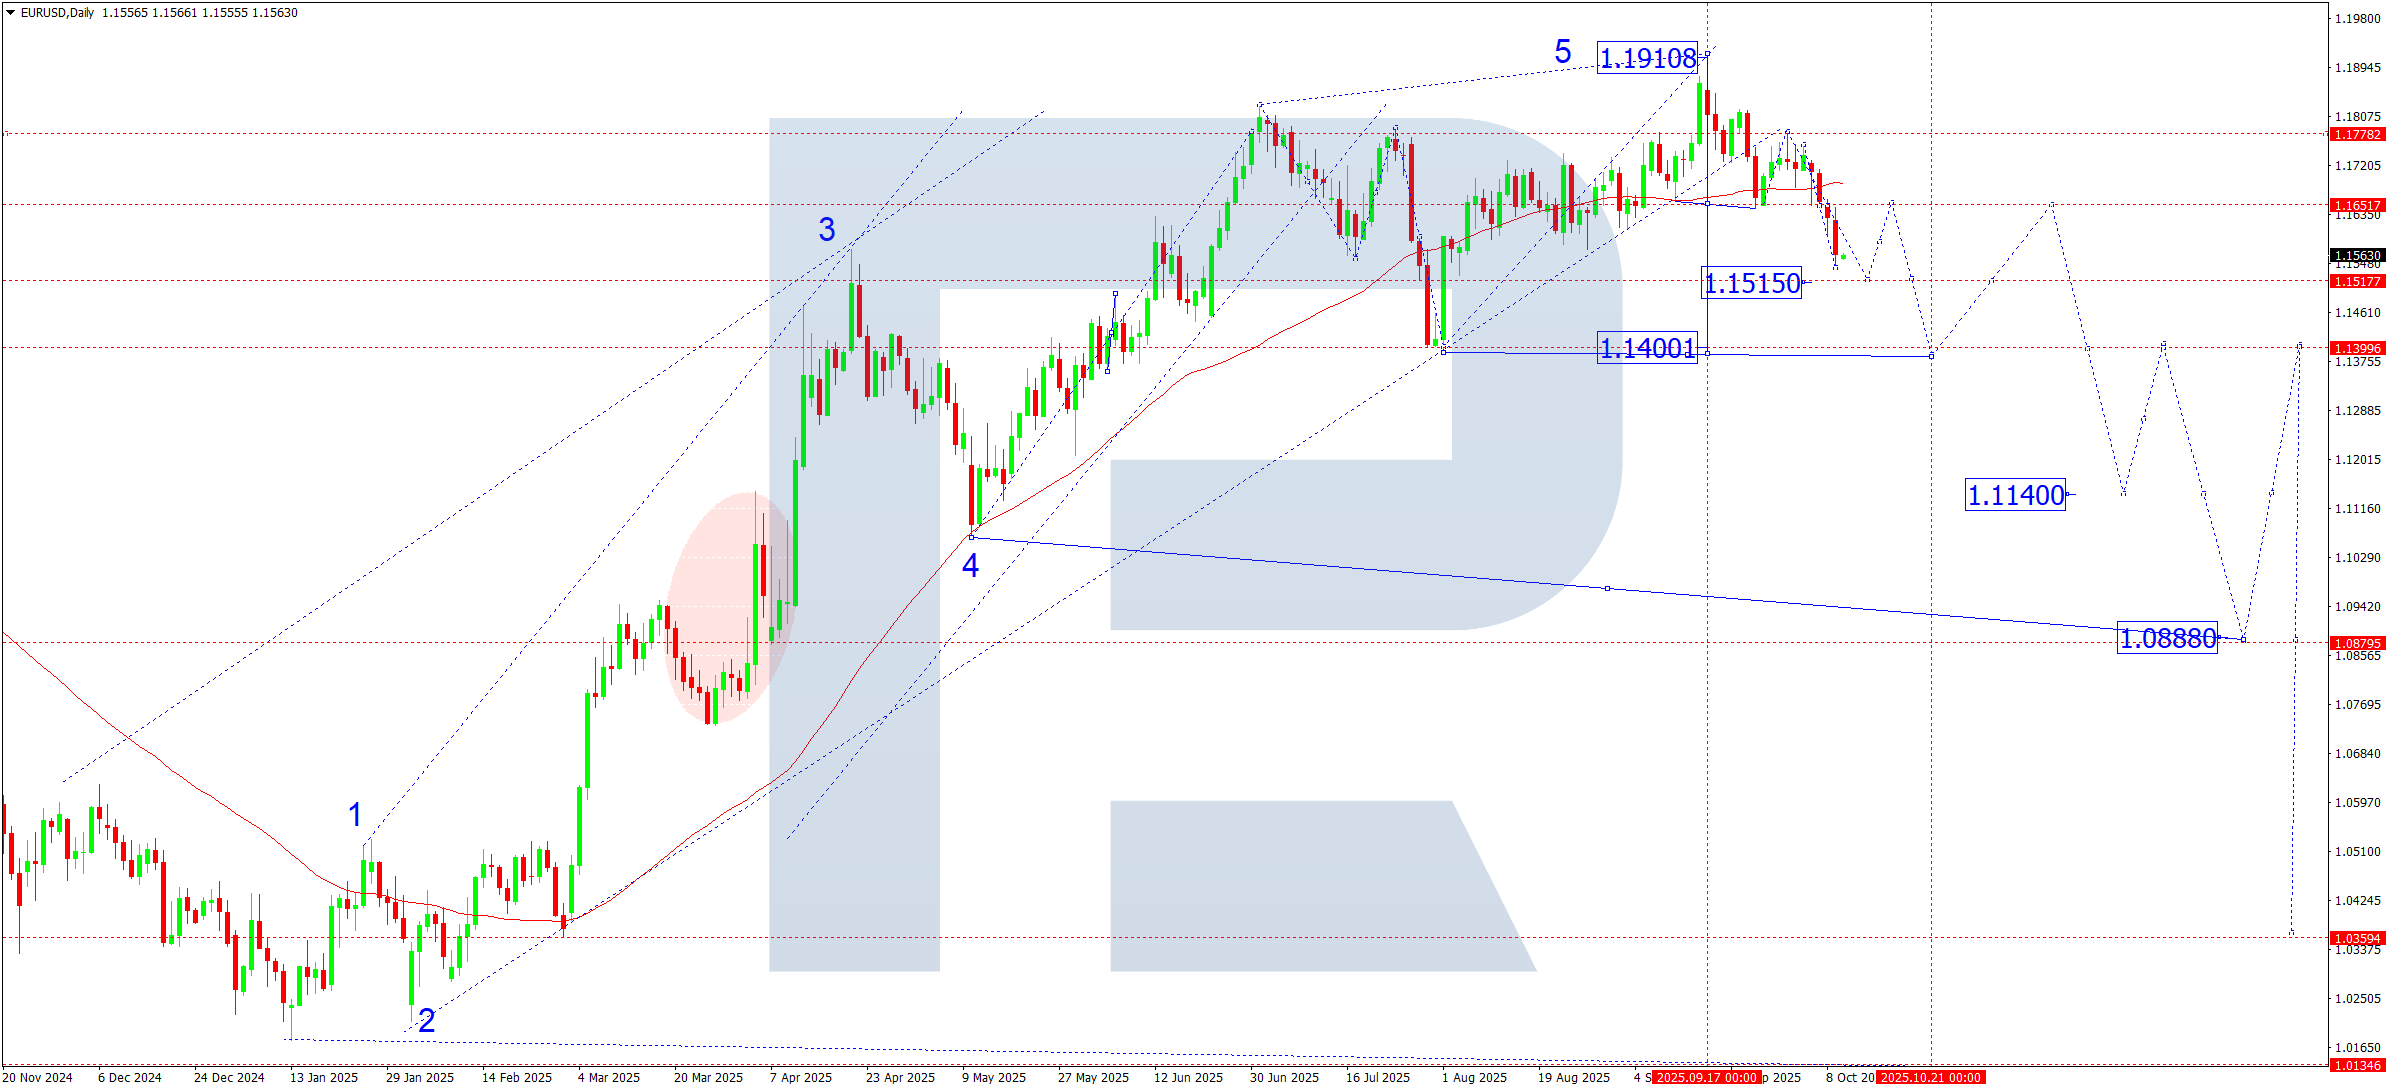
On the daily chart, the EURUSD pair consolidated below 1.1650 and built a downward structure. A breakout below the 1.1650 support level opened room for a decline towards 1.1515 as the first target of the current wave. This week, the price is expected to finish the move to 1.1515 and then stage a corrective pullback to 1.1650 (testing from below). After the correction, the next bearish impulse could develop with a local target at 1.1400 – the first estimated target of the medium-term wave.
EURUSD forecast scenarios
Bearish (baseline) scenario:
A downward wave is forming, with
- target 1 at 1.1515 – completion of the current impulse
- target 2 at 1.1400 – the week’s main objective, then a correction is likely
Bullish (alternative) scenario:
If the market consolidates above 1.1660, upside potential appears towards 1.1780 and 1.1919. However, this scenario looks limited without a strong fundamental driver.
USDJPY forecast
Mixed forces continue to drive the pair: expectations that the Federal Reserve will keep a firm stance support the dollar, while potential currency interventions from the Bank of Japan cap the pace of gains. This week, US inflation data and Fed commentary will be in focus and may shape the dollar’s short-term trajectory.
USDJPY technical analysis
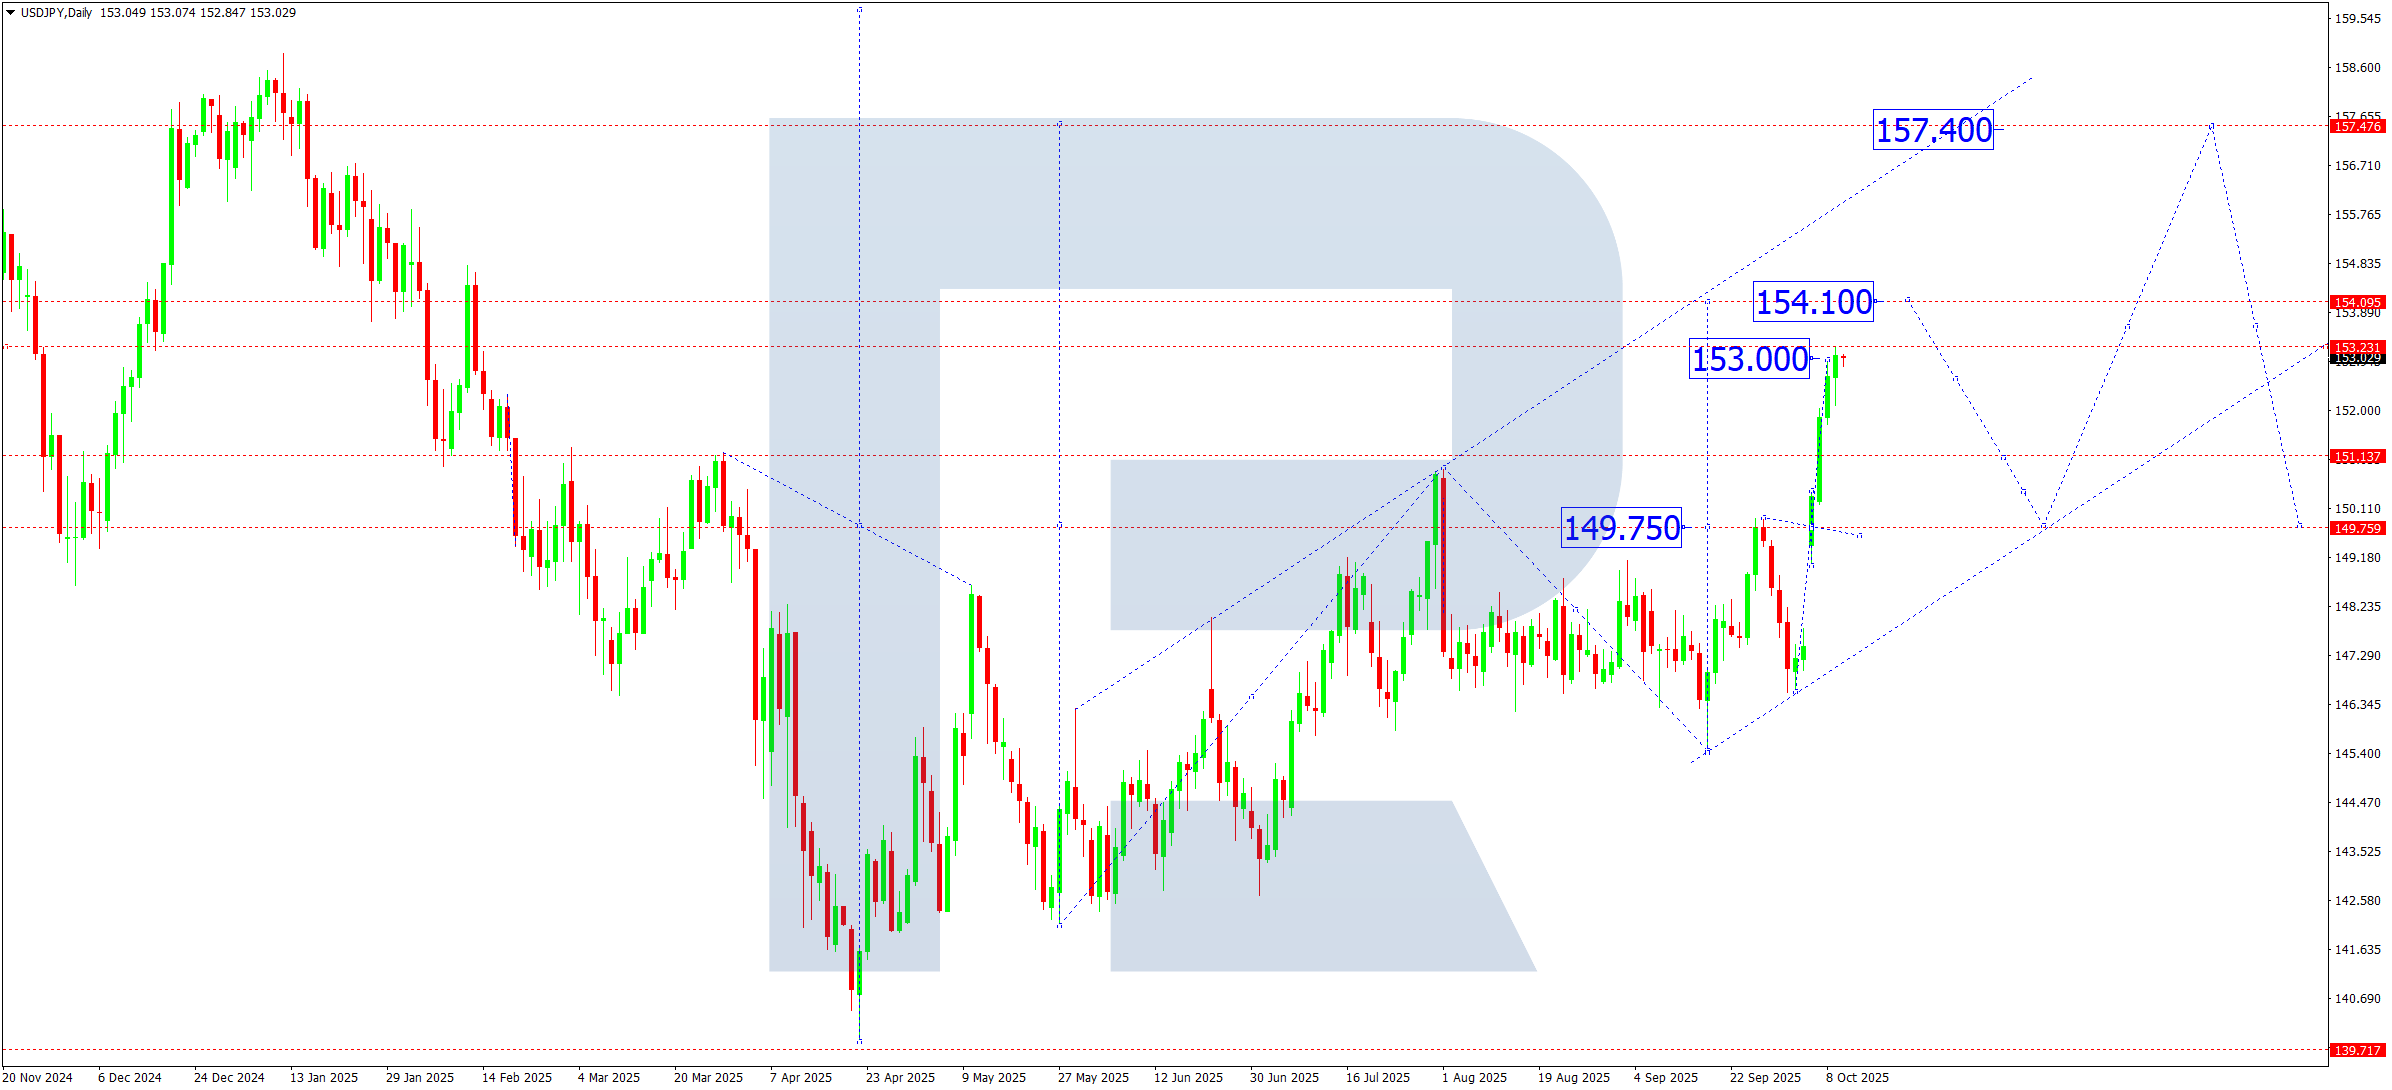
On the daily chart, the USDJPY pair decisively broke above the key resistance level at 149.75 and almost hit the local target of the current upward wave at 153.00. In the short term, a pullback to 152.00 may form, followed by another upward move to the local target of 154.10. Once achieved, a deeper correction towards 149.75 – a retest of the broken range from above – could develop. The uptrend keeps priority, but a correction towards 152.00–151.00 looks likely before the market resumes the move towards 154.10 and higher.
USDJPY forecast scenarios
Bearish (baseline) scenario:
If the price holds below 152.00 with rising volumes, a corrective wave towards 149.75 may unfold.
Bullish (alternative) scenario:
A breakout above 153.30 will open the door for continued growth, with
- local target at 154.10
- main target of the first wave at 157.40
GBPUSD forecast
The pound remains under pressure as UK activity slows and the gap between the Bank of England’s cautious rhetoric and market expectations persists. Amid a strong dollar and weak UK manufacturing data the GBPUSD rate could continue its downward momentum. Labour market and inflation releases will take centre stage this week and shape rate expectations for Q4.
GBPUSD technical analysis
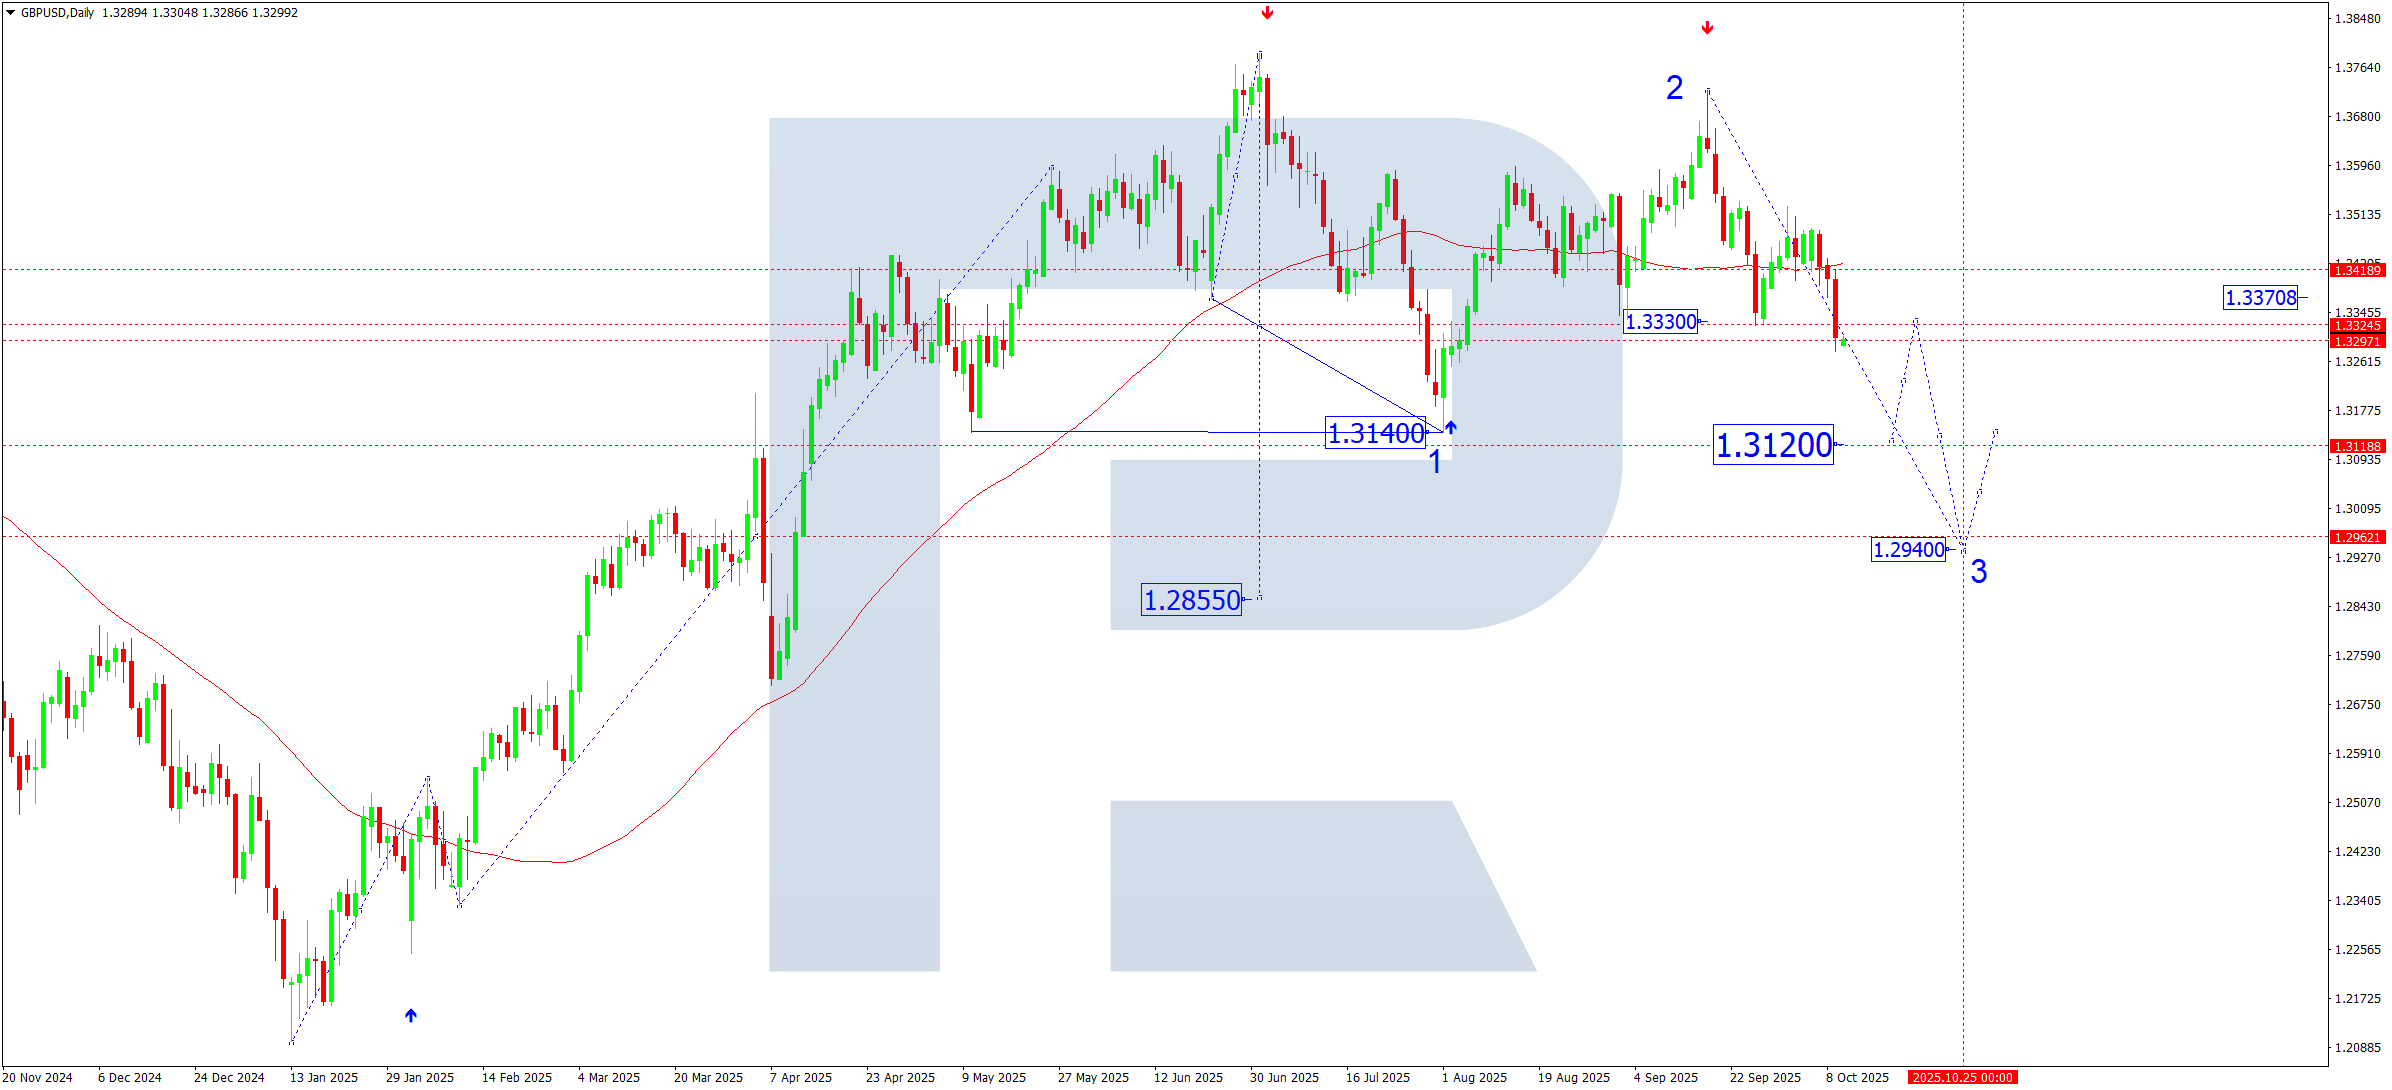
On the daily chart, the GBPUSD pair decisively broke below the 1.3330 level, opening the way for a downward wave to 1.3120. After hitting this target, the pair could undergo a correction and rebound to 1.3330 (testing the broken zone from below). Subsequently, a new downward wave could develop, aiming for 1.2940 as an estimated target of the current structure. If momentum builds, the price could move on to 1.2855, the boundary of medium-term support level. Downside retains priority. Corrective pullbacks to 1.3330 could be viewed as opportunities to seek fresh shorts towards 1.3120–1.2940.
GBPUSD forecast scenarios
Bearish (baseline) scenario:
The five-wave decline remains the priority, with the target of the current (third) wave at 1.3120 as an interim step, local downside target at 1.2940, and the main downside target at 1.2500.
Bullish (alternative) scenario:
Consolidation above 1.3550 would unlock upside potential, with local targets at 1.3720, 1.3800, and, with strong momentum, at 1.4160.
AUDUSD forecast
The Australian dollar remains under pressure as commodity prices retreat and markets scale back expectations of further RBA hikes. China’s inflation print and Australia’s employment reports could have a short-term impact on the pair, while the broader backdrop remains neutral-to-negative for the AUD.
AUDUSD technical analysis
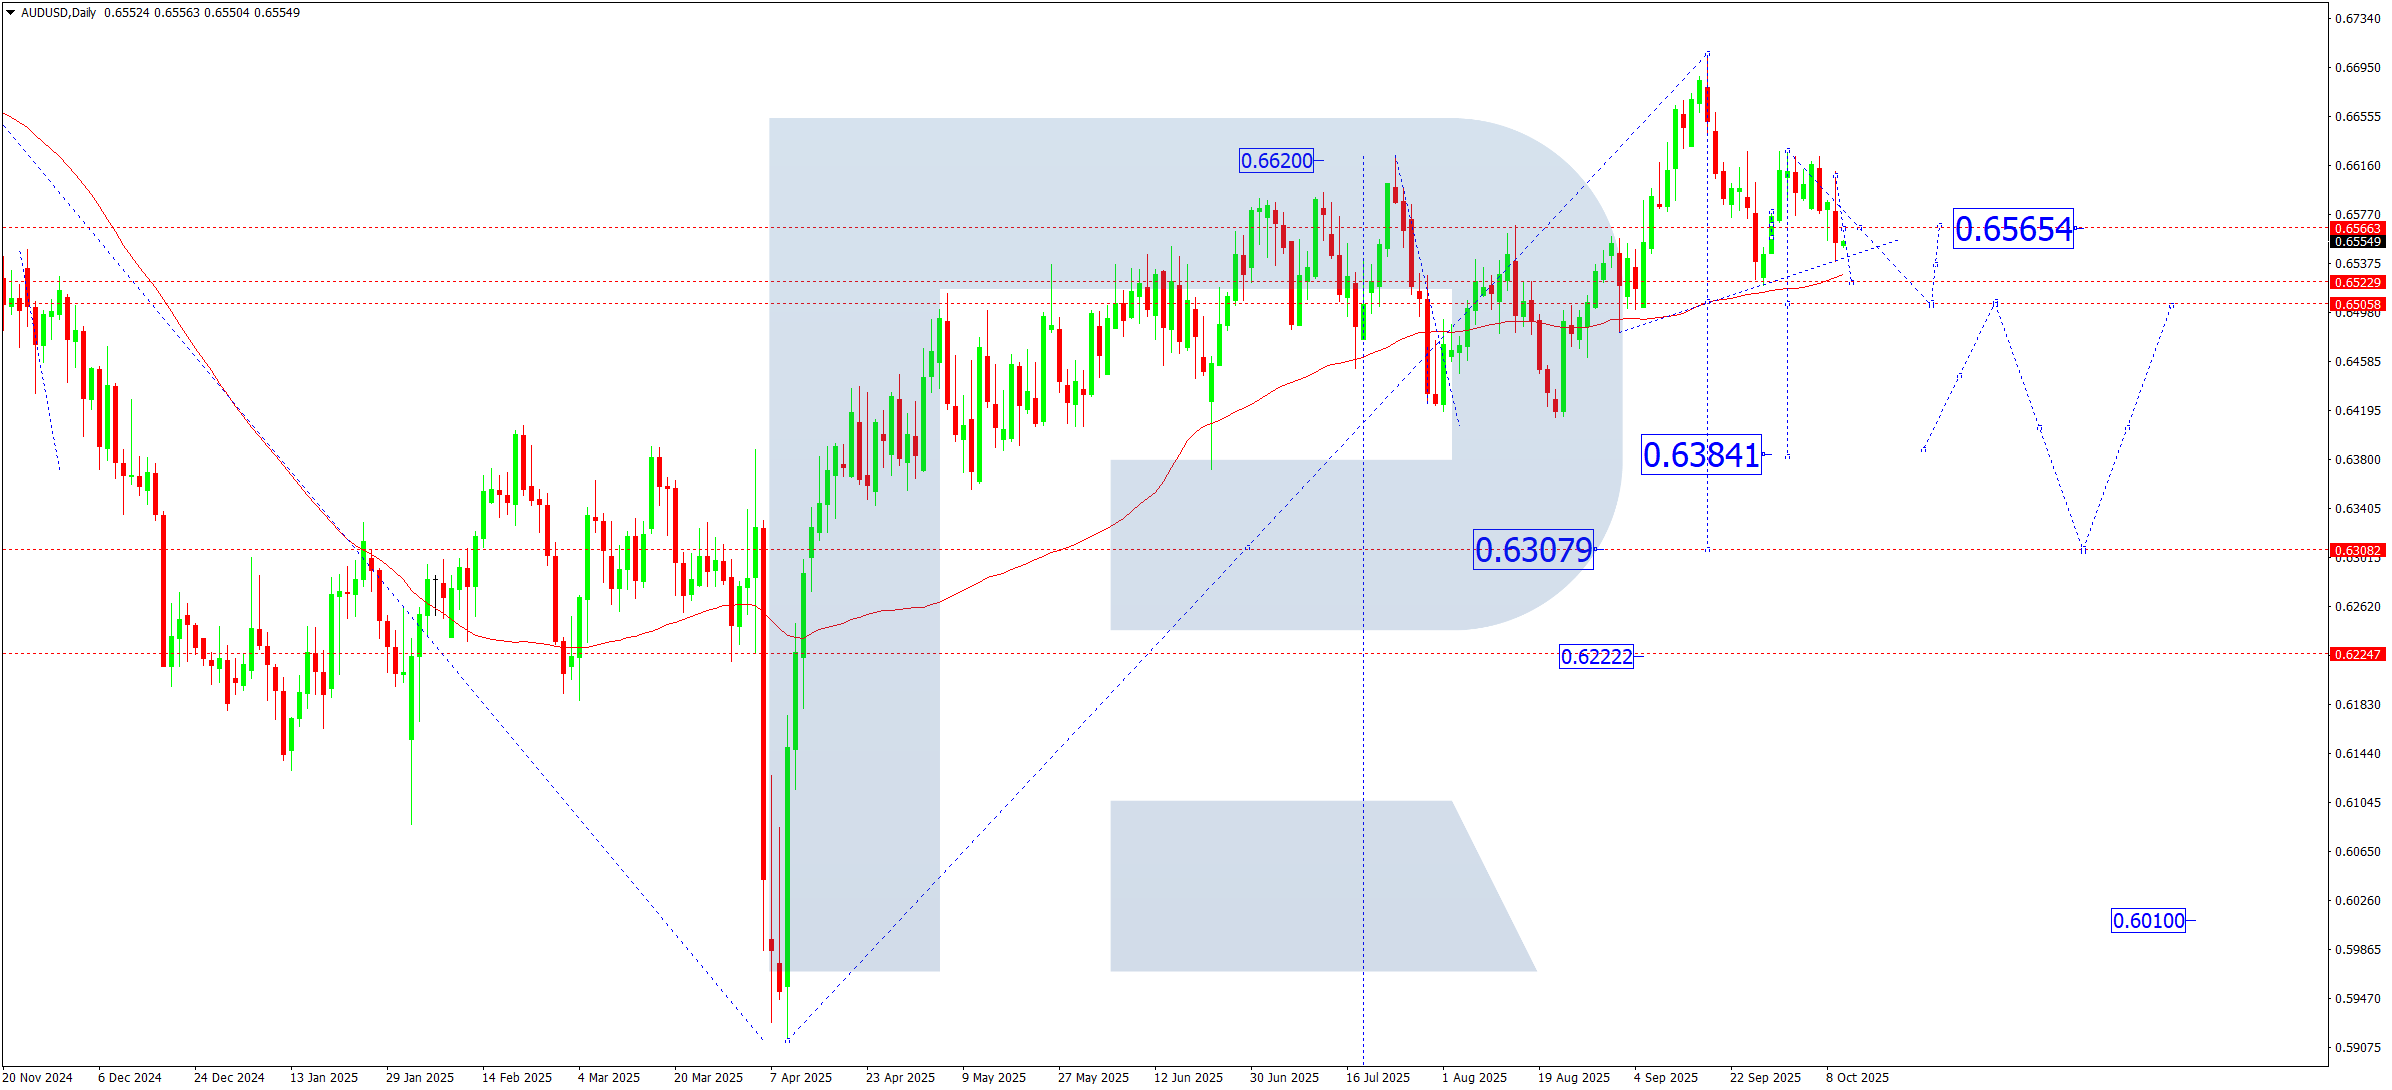
On the daily chart, the AUDUSD pair continues to build a wide consolidation range around 0.6565, which could extend down to 0.6500 this week. A breakout below 0.6500 will open the potential for a downward wave to 0.6384, an estimated target of the local downward structure. If the current range holds, a short-lived bounce for a retest of 0.6630 is possible. Downside towards 0.6500–0.6380 keeps priority. Corrective pullbacks to 0.6630 can be seen as an opportunity to find short entries.
AUDUSD forecast scenarios
Bearish (baseline) scenario:
- #.0.6500 – intermediate target (calculated pivot point of the current wave)
- #.0.6400 – the next target in the third downward wave
- #.0.6384 – the main target of the third downward wave
Bullish (alternative) scenario:
Consolidation above 0.6630 would open upside potential:
- #.0.6700 – nearest target
- #.0.6750 – local target of the corrective wave
USDCAD forecast
The Canadian dollar remains under pressure as oil prices decline and markets expect a dovish tone from the Bank of Canada. An additional factor is steady demand for the US dollar, supported by elevated US bond yields. Combined with weakening Canadian export prospects, the fundamentals keep a mildly bullish bias for the USDCAD pair.
USDCAD technical analysis
On the daily chart, USDCAD finished to form a consolidation range around 1.3939, suggesting a potential pivot point for the current upward wave. This week, the third growth wave is expected to develop towards 1.4152, with scope to extend the trend to 1.4325. A breakout and consolidation above 1.3939 will act as the key confirmation of trend strength. While the structure keeps its bullish momentum, the priority remains growth 1.4150–1.4320. Corrective declines towards 1.3850 can be considered as trend-following buy zones.
USDCAD forecast scenarios
Bullish (baseline) scenario:
A breakout above the 1.3939 level will activate upside potential to:
- 1.4152 as a local target of the third wave
- 1.4325 as a higher target of the impulse
Bearish (alternative) scenario:
A return below 1.3900 may form a corrective wave down to:
- 1.3850 – as the first target
- 1.3730 – as the second target
XAUUSD forecast
Gold is trading near multi-month highs as the US dollar weakens and Treasury yields look set to retreat. Geopolitical risks and stronger safe-haven demand support prices, although profit-taking after a sharp rise can spark a corrective wave. Markets will watch US inflation data and comments from Federal Reserve officials on the pace of policy easing.
XAUUSD technical analysis
On the daily chart, gold broke above 3,940 and advanced to 4,059, hitting the local target of the current upward wave. This week is expected to see a corrective move to test the 3,940 level from above, followed by a rise to 4,076, where the extended third wave may complete. After that, a deeper correction towards 3,660 remains possible. While prices hold above 3,940, the uptrend remains in priority. A breakout below 3,900 will be the first signal of a broader correction.
XAUUSD forecast scenarios
Bullish (baseline) scenario:
Consolidation above 3,940 preserves upside potential, with the nearest targets at:
- 4,070 – key resistance level
- 4,076 – the upper boundary of the extended third wave
Bearish (alternative) scenario:
A breakout and consolidation below 3,900 can trigger a decline to:
- 3,800 – intermediate support
- 3,660 – the zone of deep technical and fundamental correction
Brent forecast
Oil remains volatile amid geopolitical tensions in Europe, the Middle East, and around Venezuela. Supply disruption risks and OPEC+ hints about possible quota adjustments support prices, while weak industrial demand and slower global growth expectations push back. This balance sets a neutral-to-bearish backdrop for the week.
Brent technical analysis
On the daily chart, Brent rebounded from the SMA50 (66.26) and continues to consolidate below it. A breakout below the 64.00 level will open the potential for the fourth downward wave to 62.00 and then 60.00, where the corrective structure may complete. Once the base of the decline forms, the market can start a new upward cycle with the first target at 78.50. While Brent trades below the SMA50, a decline towards 64.00–62.00 remains the priority. However, any sharp geopolitical escalation can quickly flip the balance back to growth towards 74.00–78.50.
Brent forecast scenarios
Bearish (main) scenario:
The breakout below the 65.00 level confirmed the relevance of the fourth wave:
- 64.00 – first target
- 63.00 – second target
- 60.00 – main target of the current corrective wave
Bullish (alternative) scenario:
High geopolitical risks could trigger a sharp rally:
- 69.00 – first recovery target
- 71.50 – second target
- 78.50 – main target of the expected first upward wave
Forecasts presented in this section only reflect the author’s private opinion and should not be considered as guidance for trading. RoboForex bears no responsibility for trading results based on trading recommendations described in these analytical reviews.