Weekly technical analysis and forecast (29 September – 3 October 2025)
This weekly technical analysis highlights the key chart patterns and levels for EURUSD, USDJPY, GBPUSD, AUDUSD, USDCAD, gold (XAUUSD), and Brent crude oil to forecast market moves for the upcoming week (29 September – 3 October 2025).
Major technical levels to watch this week
- EURUSD: Support: 1.1650, 1.152Resistance: 1.1780, 1.1910
- USDJPY: Support: 149.20, 148.3Resistance: 150.50, 151.15
- GBPUSD: Support: 1.3326, 1.3222. Resistance: 1.3430, 1.3550
- AUDUSD: Support: 0.6500, 0.64Resistance: 0.6600, 0.6700
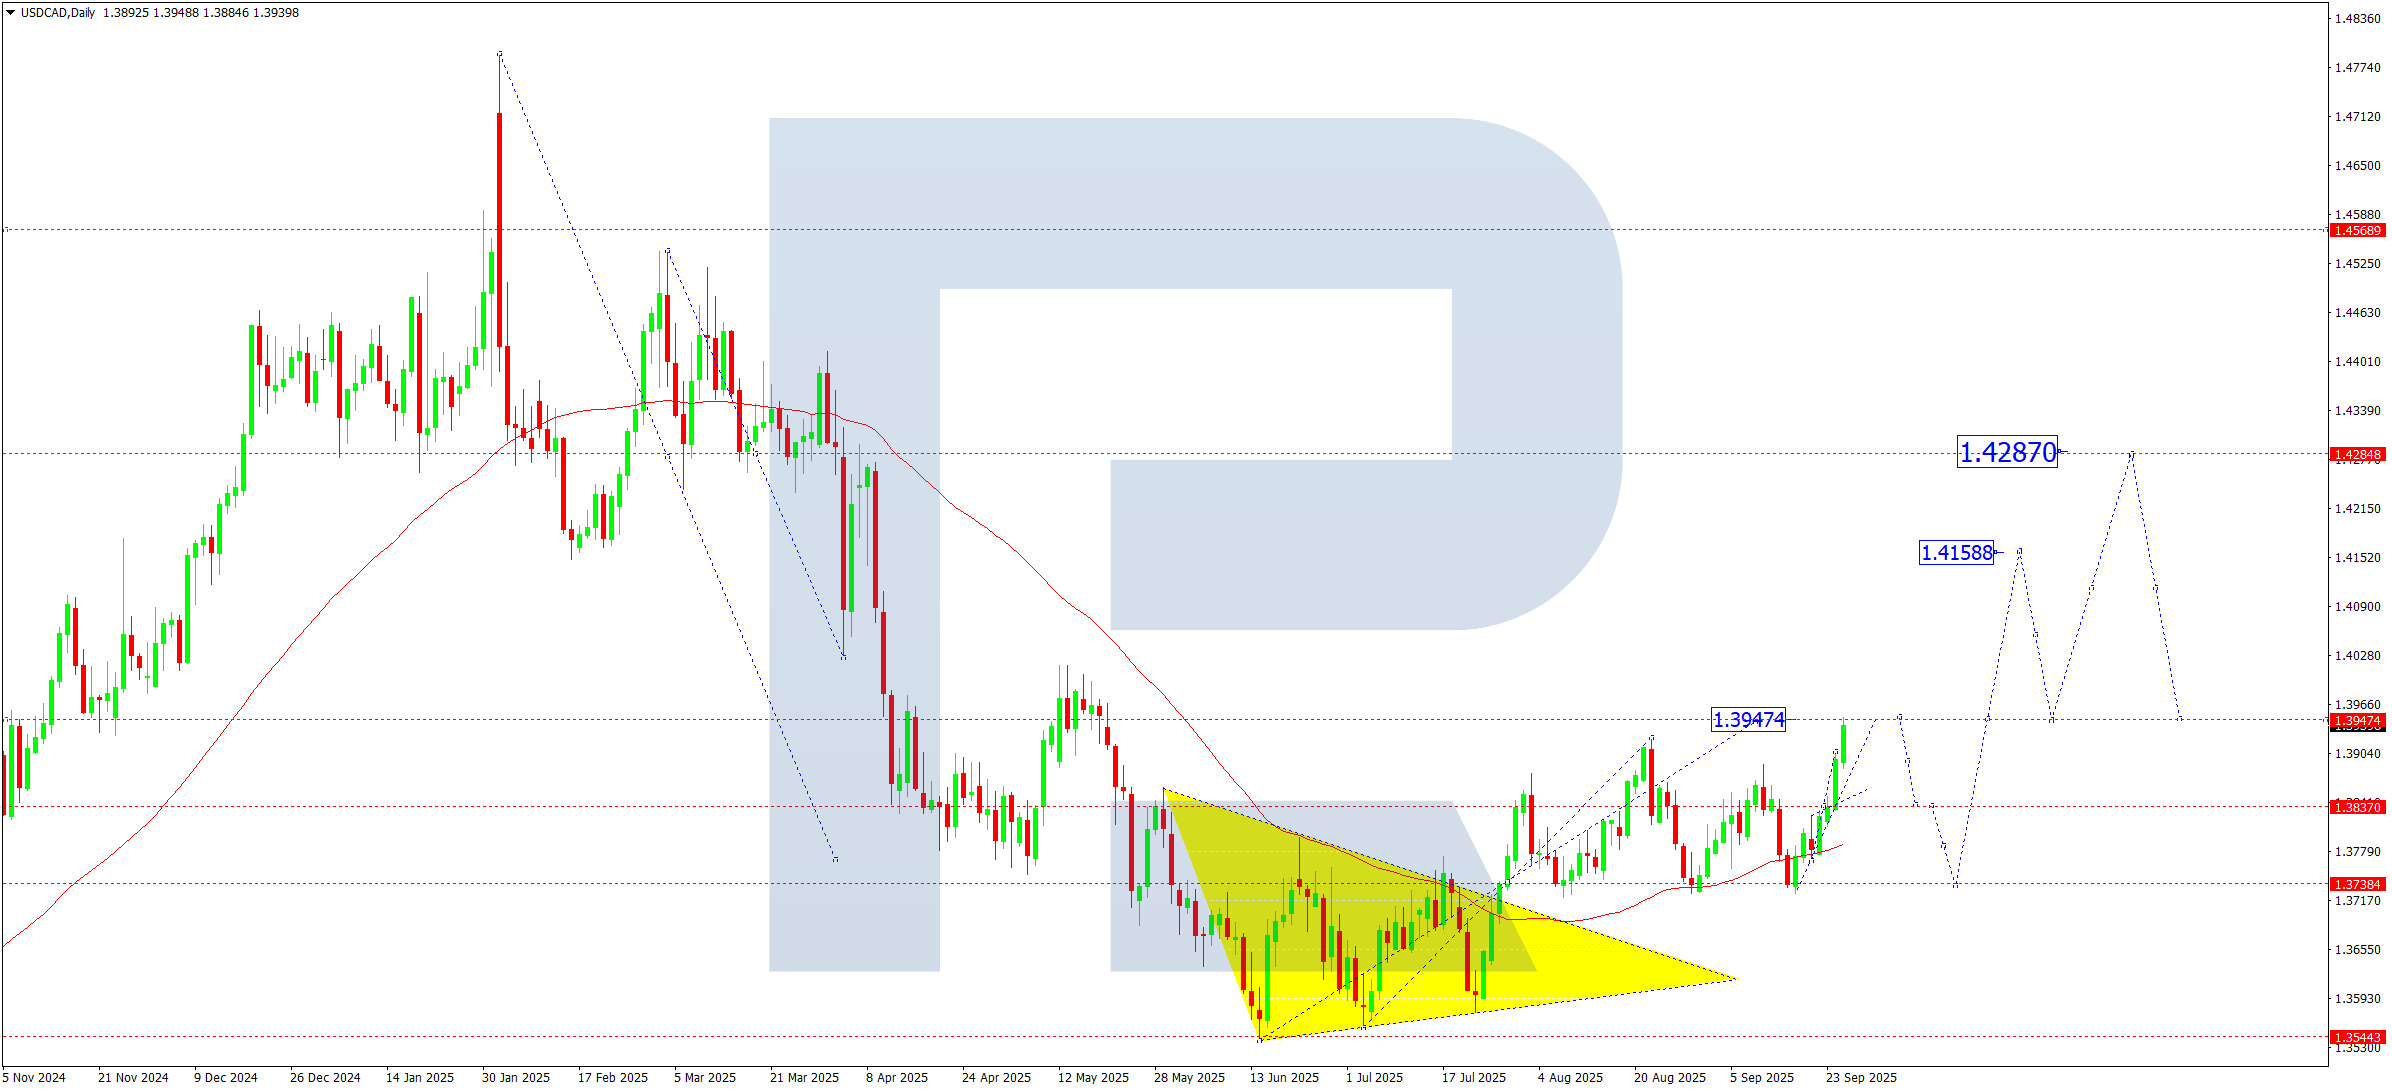
- USDCAD: Support: 1.3838, 1.3737. Resistance: 1.4040, 1.4150
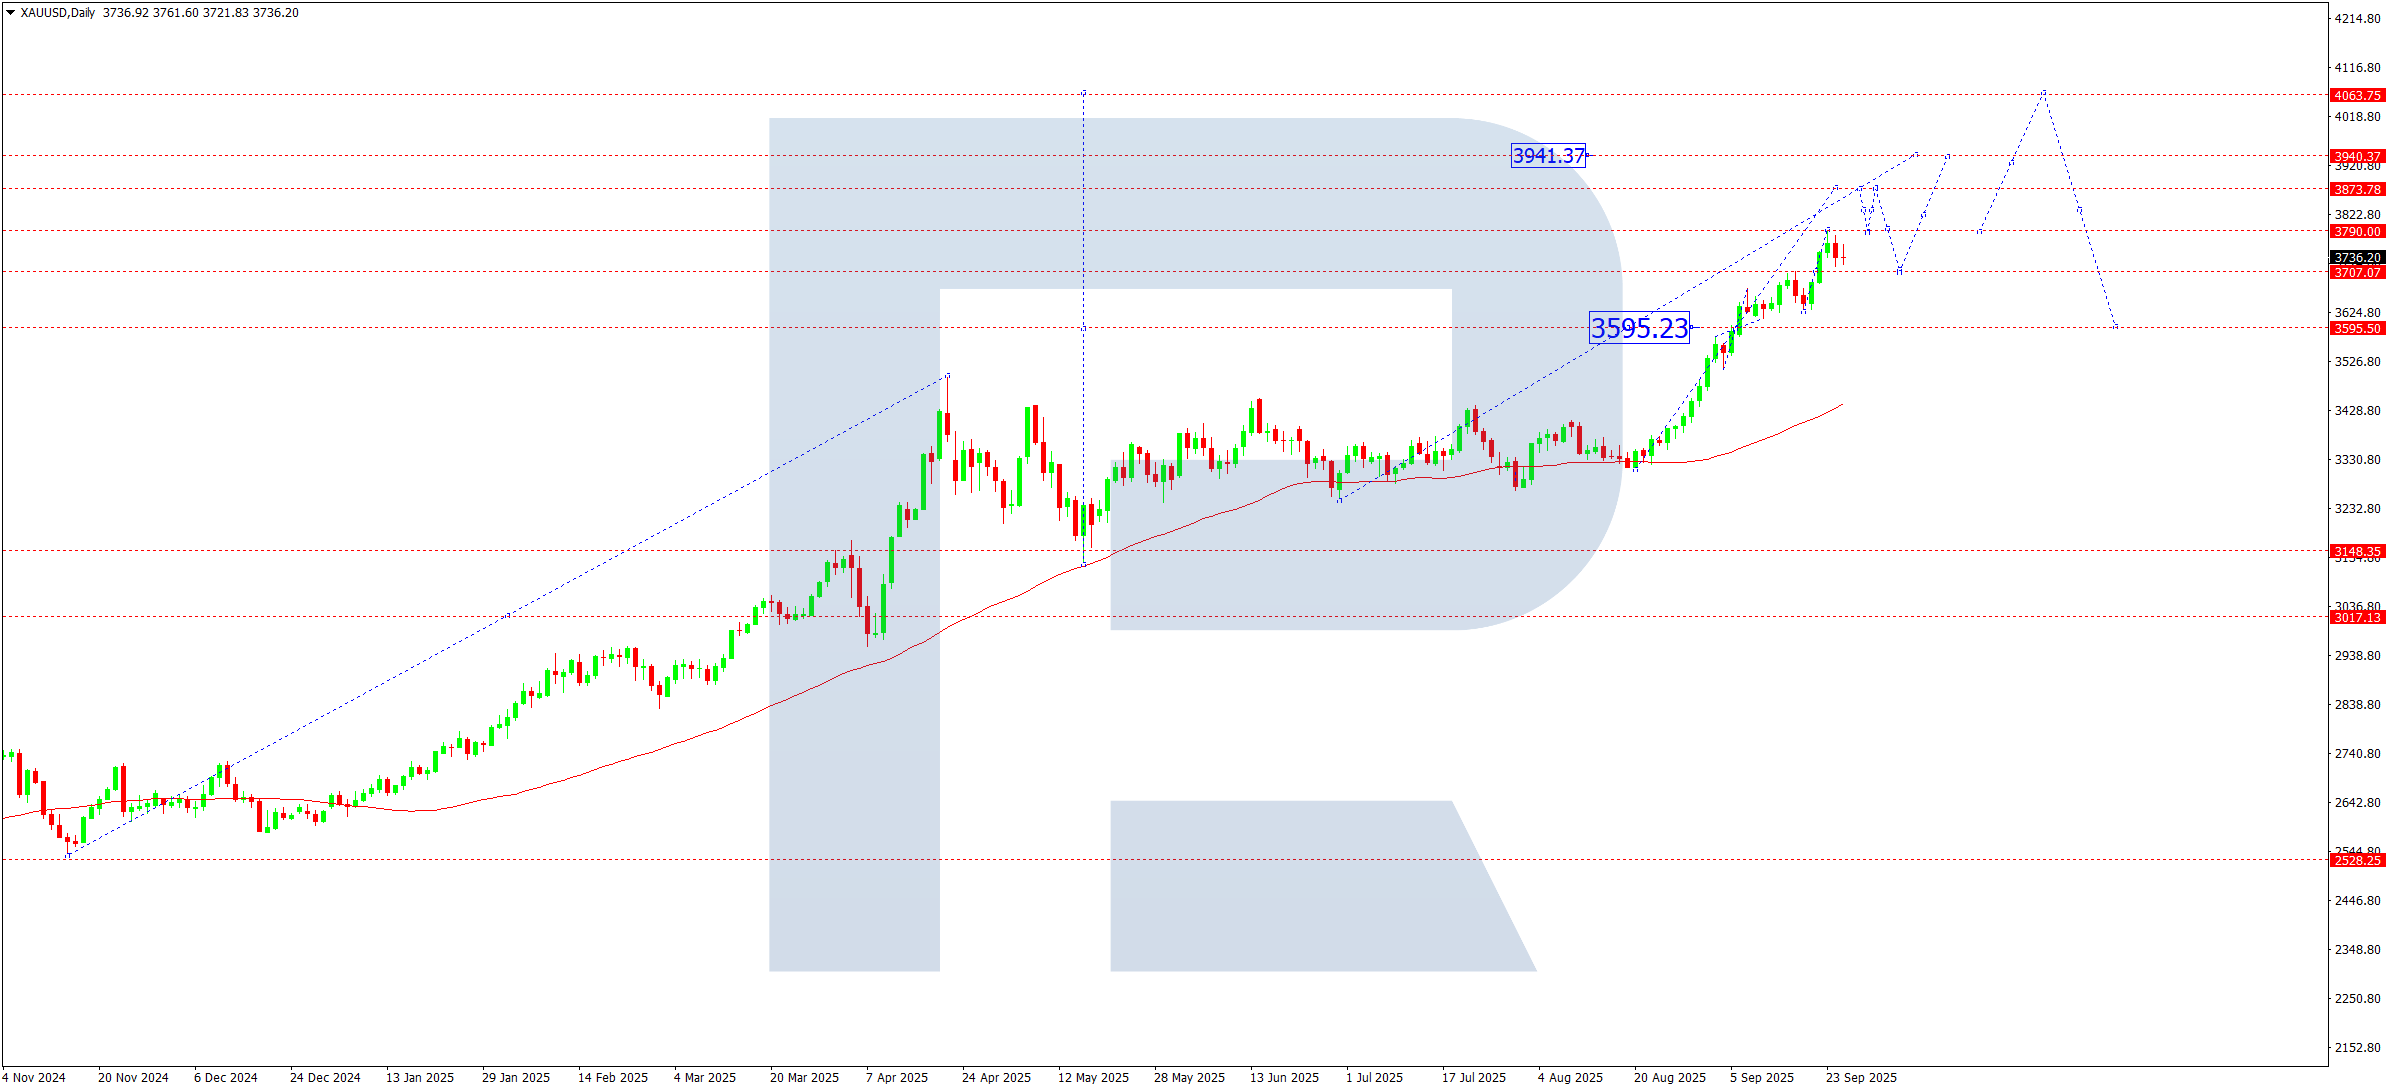
- Gold: Support: 3,705, 3,595. Resistance: 3,874, 3,941
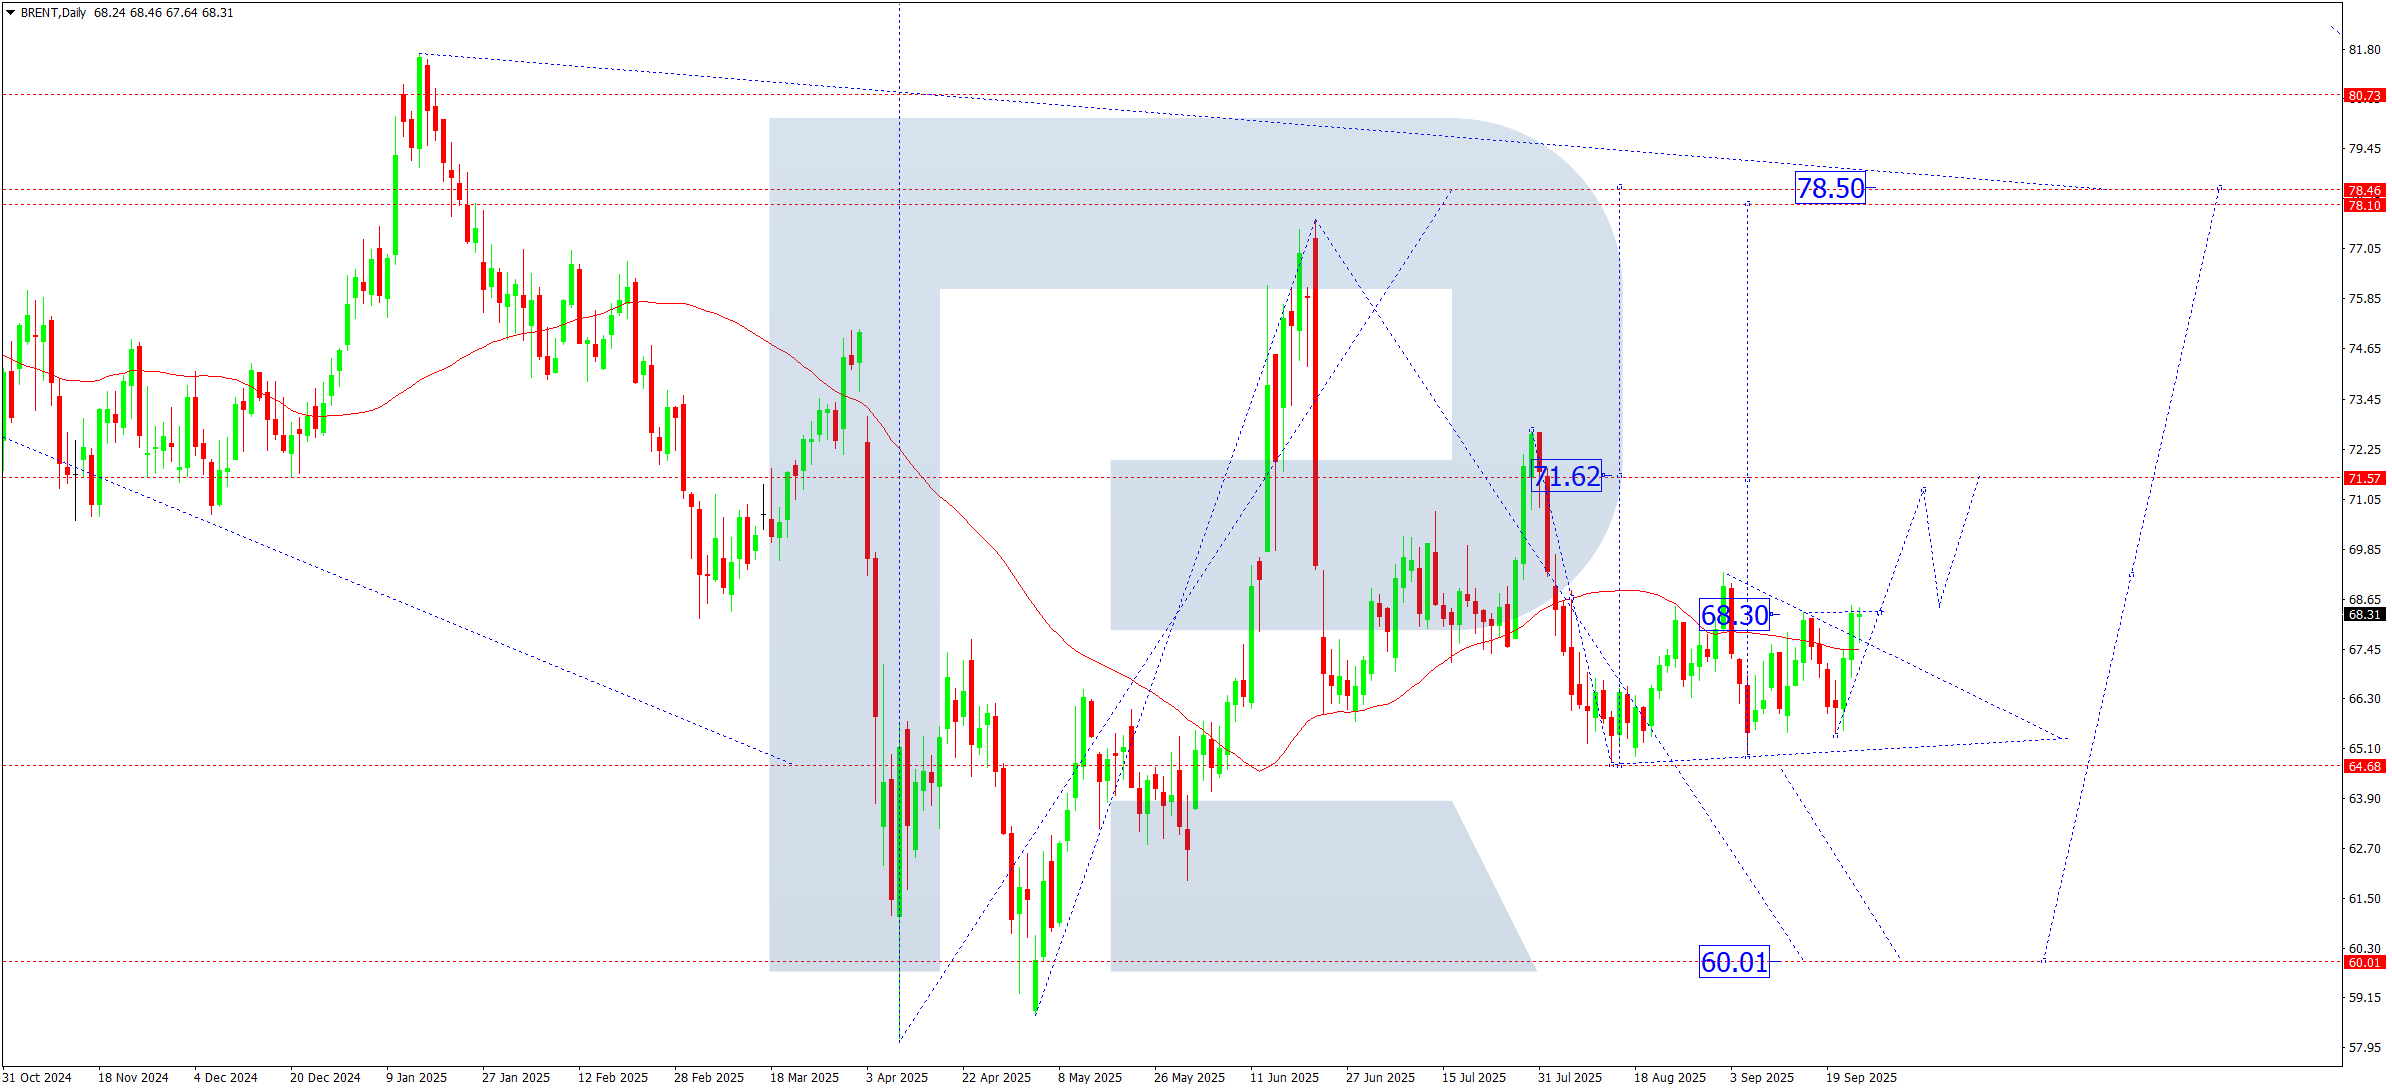
- Brent: Support: 64.70, 60.Resistance: 68.88, 71.60
EURUSD forecast
The market continues to price the balance between Fed and ECB policy and eurozone inflation expectations. Demand for the dollar as a safe-haven asset adds to pressure. US GDP and Europe’s business activity indices will be in focus this week.
EURUSD technical analysis
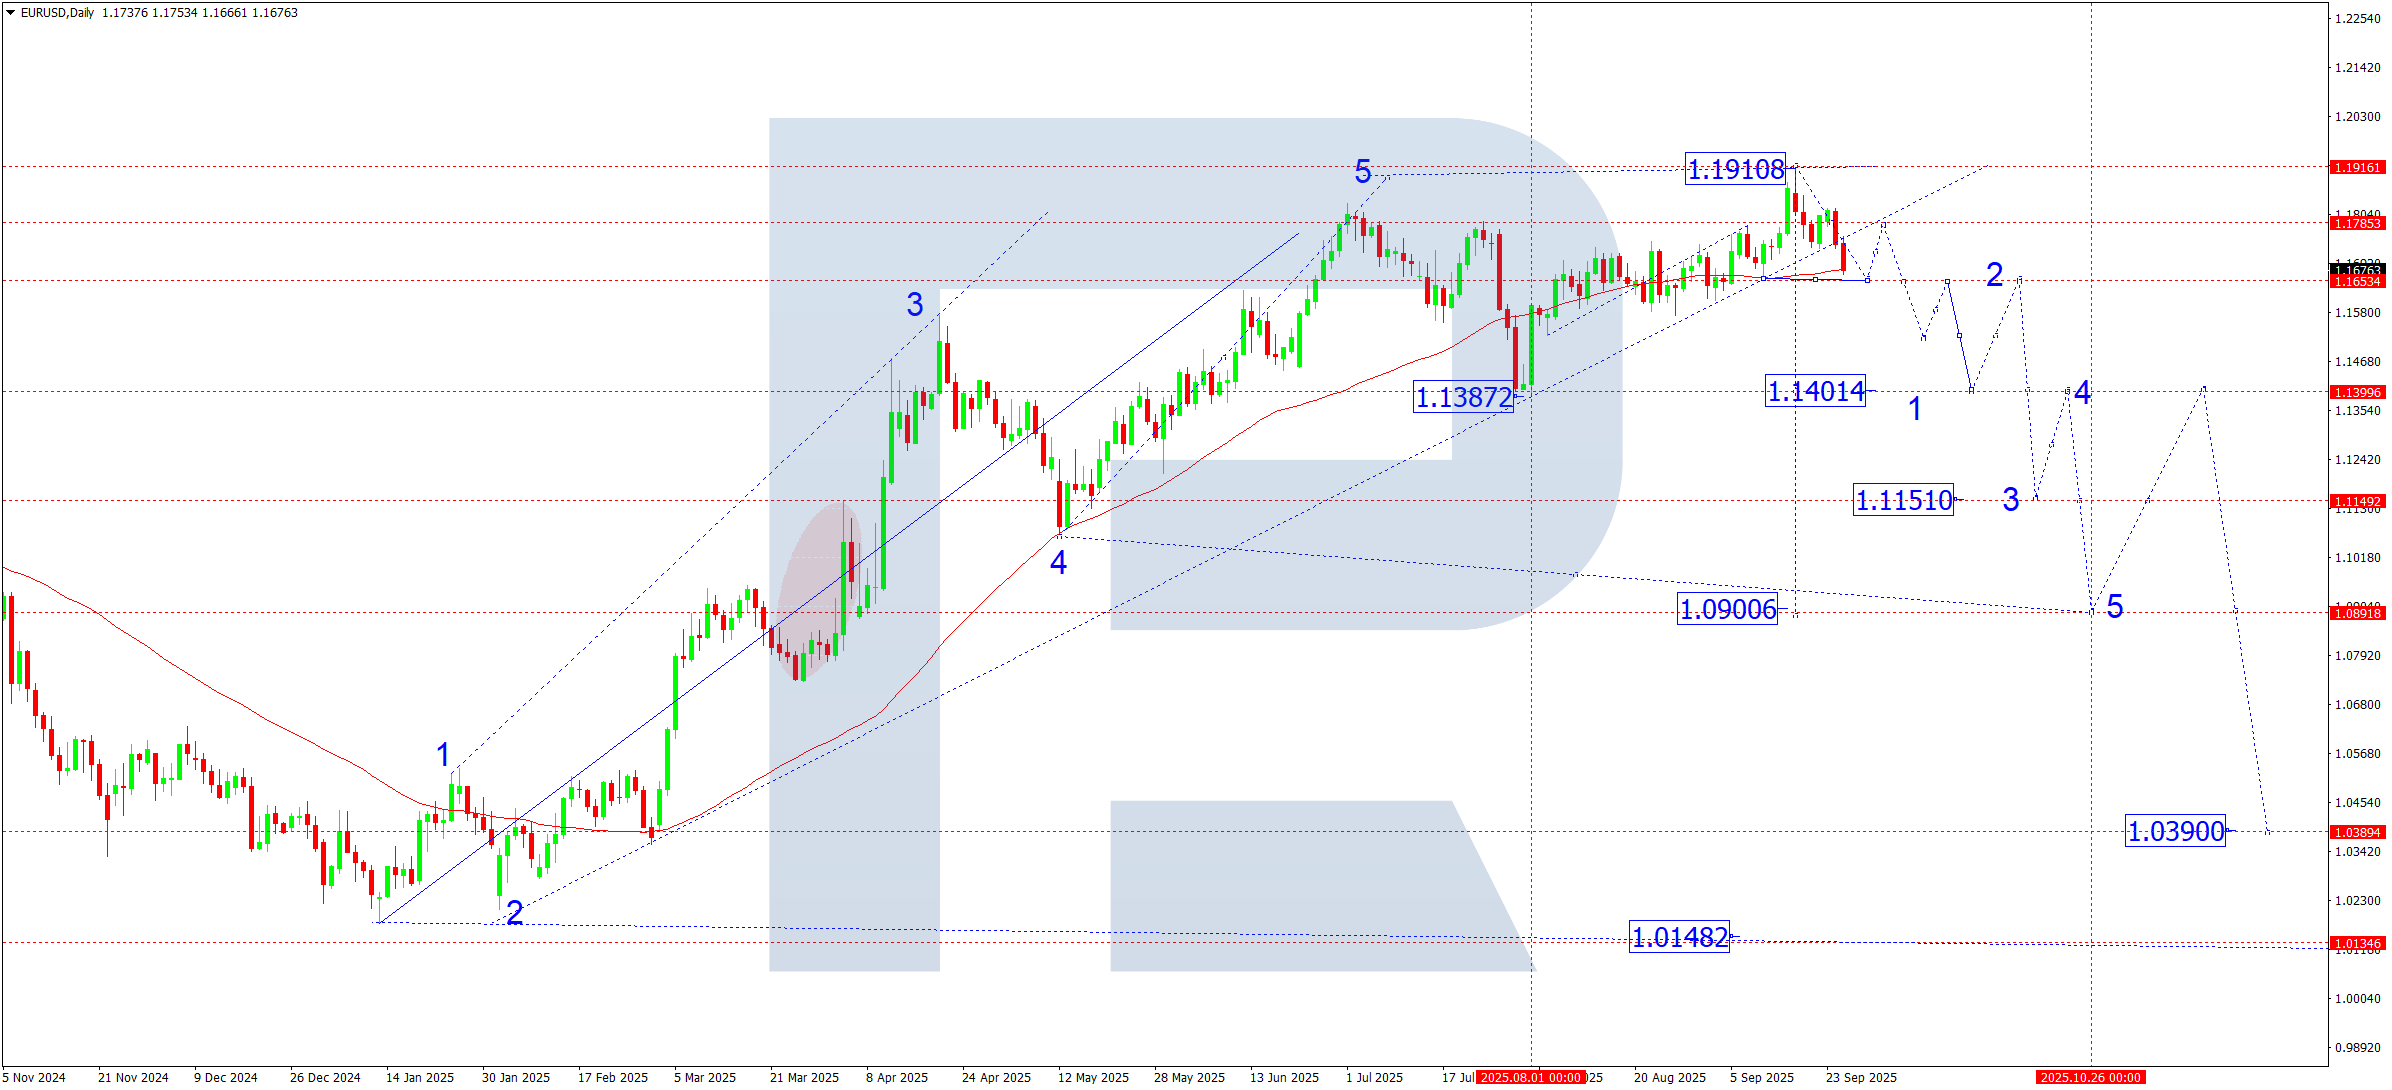
On the daily chart, the EURUSD pair completed the first move lower to 1.1650 last week. From that level, the market received support from the SMA50 and is building a local correction towards 1.1780. After the correction is complete, the downtrend should resume, with the next downside target at 1.1520 and the potential to extend the trend towards the key 1.1400 support level (first estimated target).
In the near term, the pair is expected to see a five-wave decline (see wave labelling on the chart):
- Wave 1: target of 1.1400
- Wave 2 (correction): return to 1.1650 (testing from below)
- Wave 3: target of 1.1150
- Wave 4: rebound to 1.1400 (testing from below)
- Wave 5: final downside target of 1.0900
EURUSD forecast scenarios
Bearish (baseline) scenario:
The pair is expected to continue a decline within the first wave.
- The main target of the week lies at 1.1400
- After reaching it, the price could rebound to 1.1650 (the second wave) for a short term
Bullish (alternative) scenario:
If the price breaks above 1.1780, the market can attempt one more move to 1.1910, which may temporarily cancel the scenario of a decline starting this week.
USDJPY forecast
This week, the USDJPY pair will take its cue from Fed rate expectations and Bank of Japan rhetoric, since the yield spread remains the pair’s key driver. Investors also focus on US inflation and labour statistics, which can amplify swings near local targets.
USDJPY technical analysis
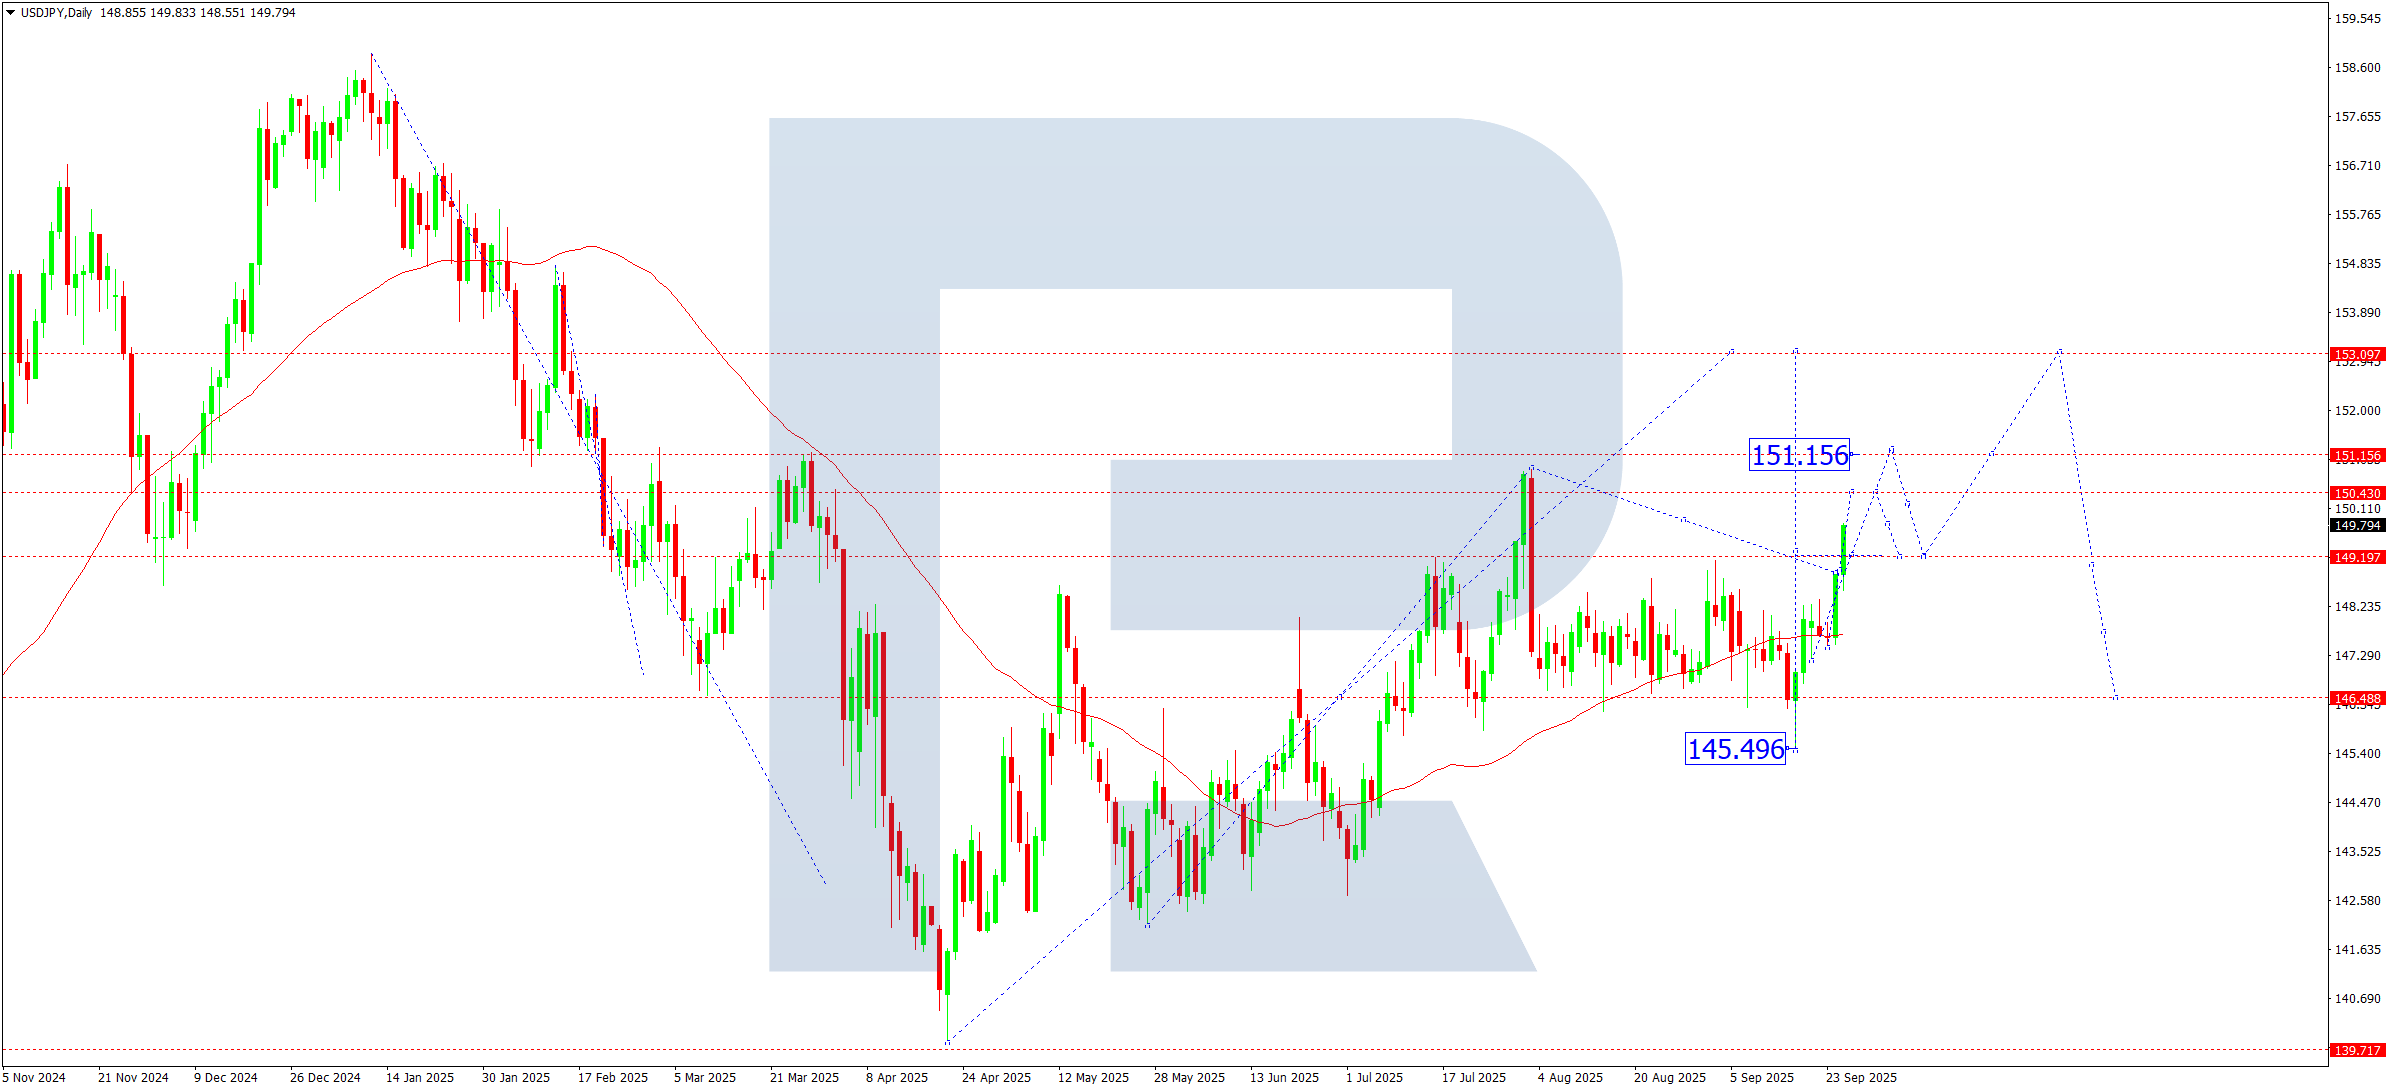
On the daily chart, the pair broke the key 149.20 level and continues a growth wave, with the next local target at 151.15. After hitting it, the pair could correct and retest the 149.20 level from above. The broader view still favours a resumption of growth towards the main target of this wave at 153.10.
USDJPY forecast scenarios
Bullish (baseline) scenario:
A breakout and consolidation above 149.20 opens the door for further upside:
- 151.15 – local target
- 153.10 – key target of the first growth wave
Bearish (alternative) scenario:
If the price confidently breaks below 147.50 on rising volumes, the market will get a downside impulse:
- first target – 145.50
- next prospect – 143.00
GBPUSD forecast
This week, the market will react to UK inflation data and US statistics, which can provide a short-term impulse. Investors focus on the less rosy economic outlook and the monetary policy stance of the Fed and the Bank of England.
GBPUSD technical analysis
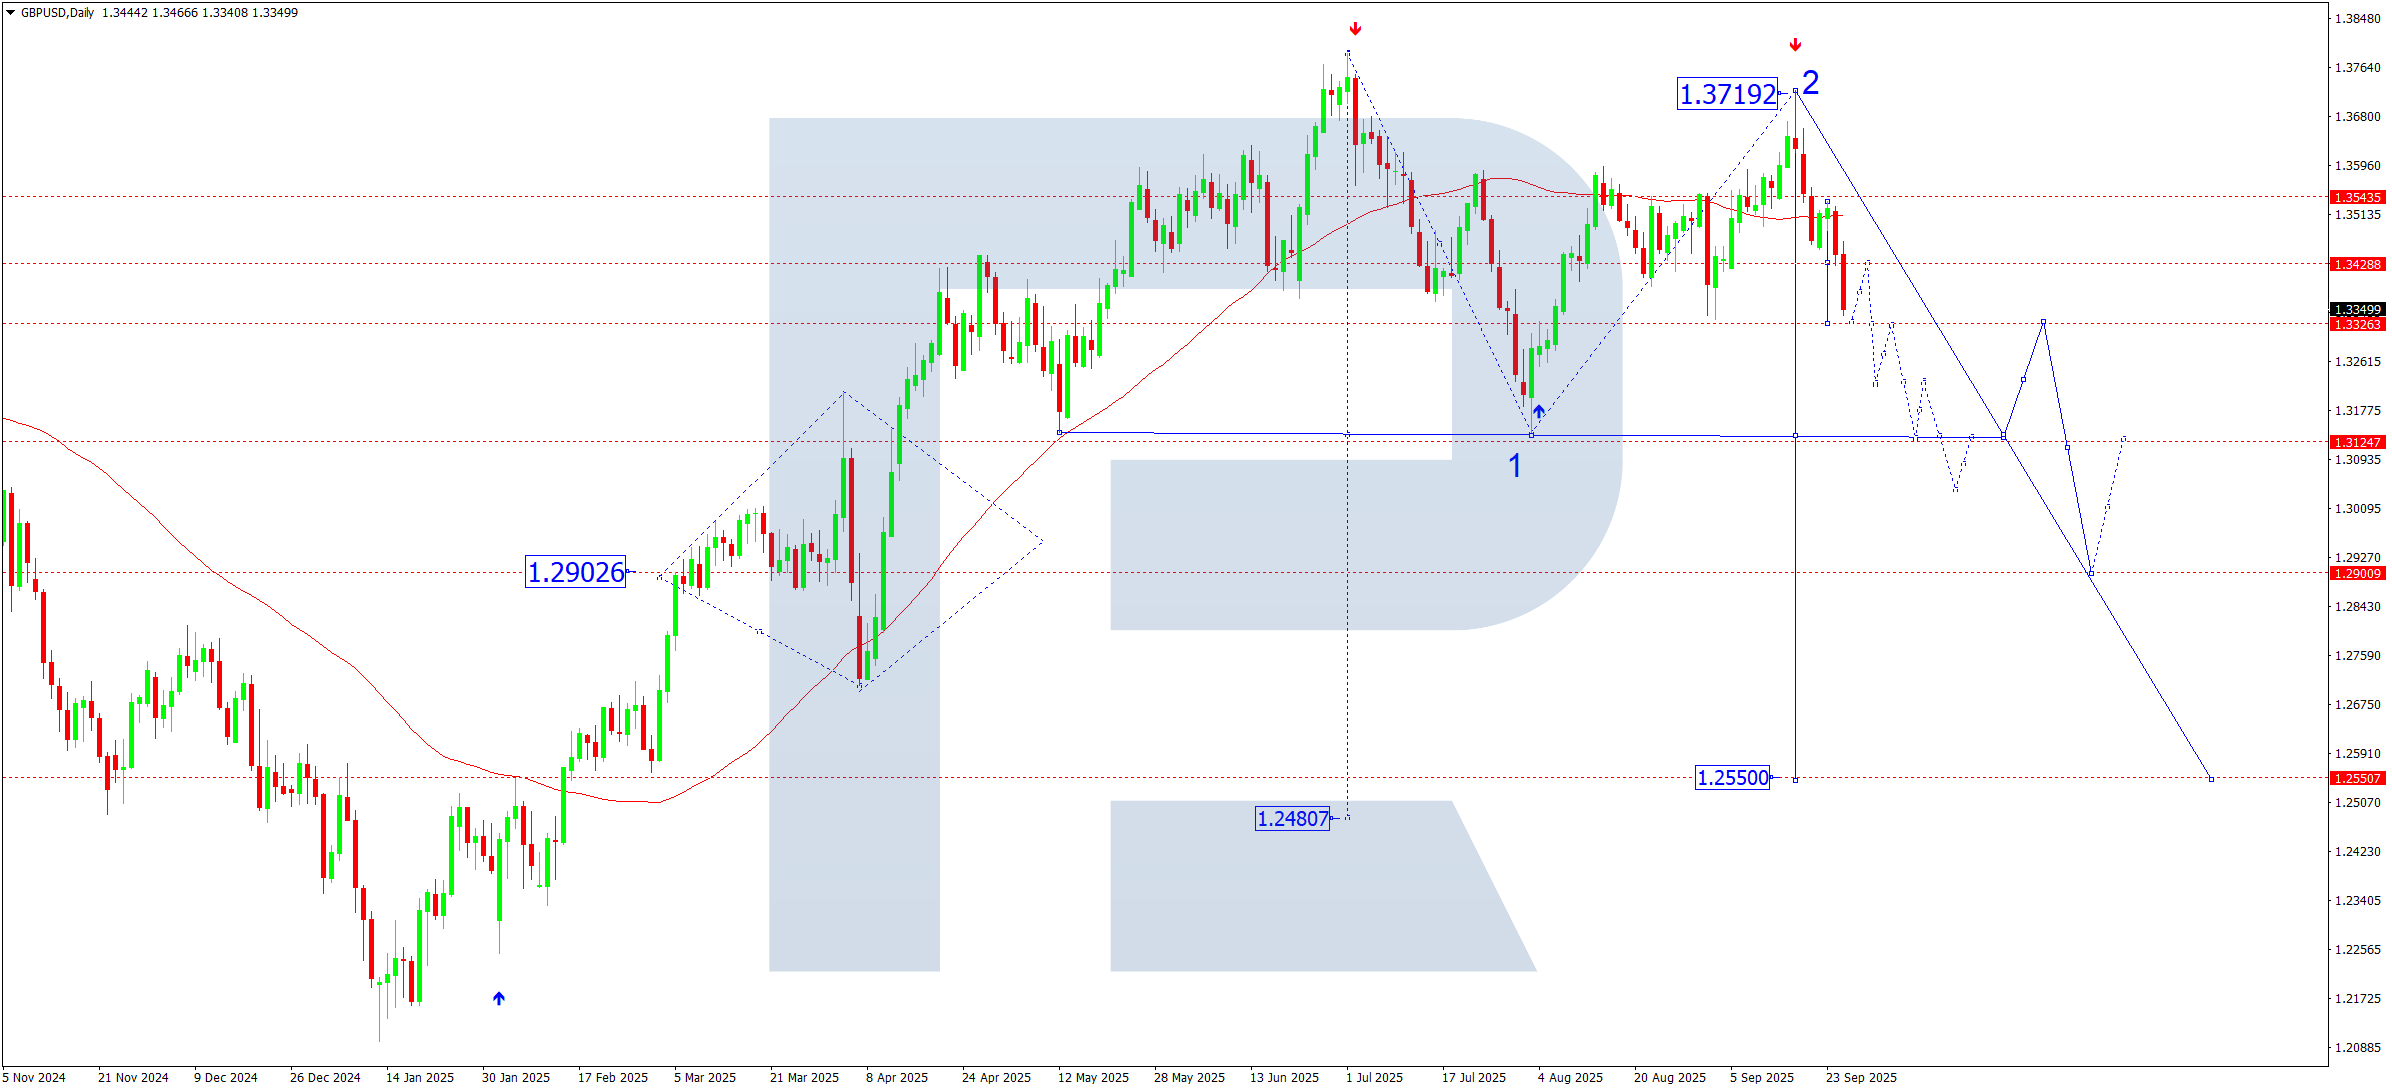
On the daily chart, the GBPUSD pair completed the first structure of the third downward wave, reaching 1.3326. A correction towards 1.3428 is possible this week. After it ends, the decline could continue to 1.3222 with the potential to deepen towards 1.3130. This marks only half of the current downward wave. The local trend target lies much lower, near 1.2550.
GBPUSD forecast scenarios
Bearish (baseline) scenario:
The five-wave decline scenario remains the priority.
Third-wave target:
- 1.3130 (intermediate)
Further ahead, the market can aim for 1.2550 as the local target of the entire downward wave.
Bullish (alternative) scenario:
If the price consolidates above 1.3400, the pair will gain upside potential:
- nearest target: 1.3550
with further momentum: 1.3800, 1.4000, and even 1.4160
AUDUSD forecast
The AUDUSD rate will depend on the US dollar’s path ahead of Federal Reserve decisions and US labour data. China’s export performance and Reserve Bank of Australia commentary remain key for the Aussie.
AUDUSD technical analysis
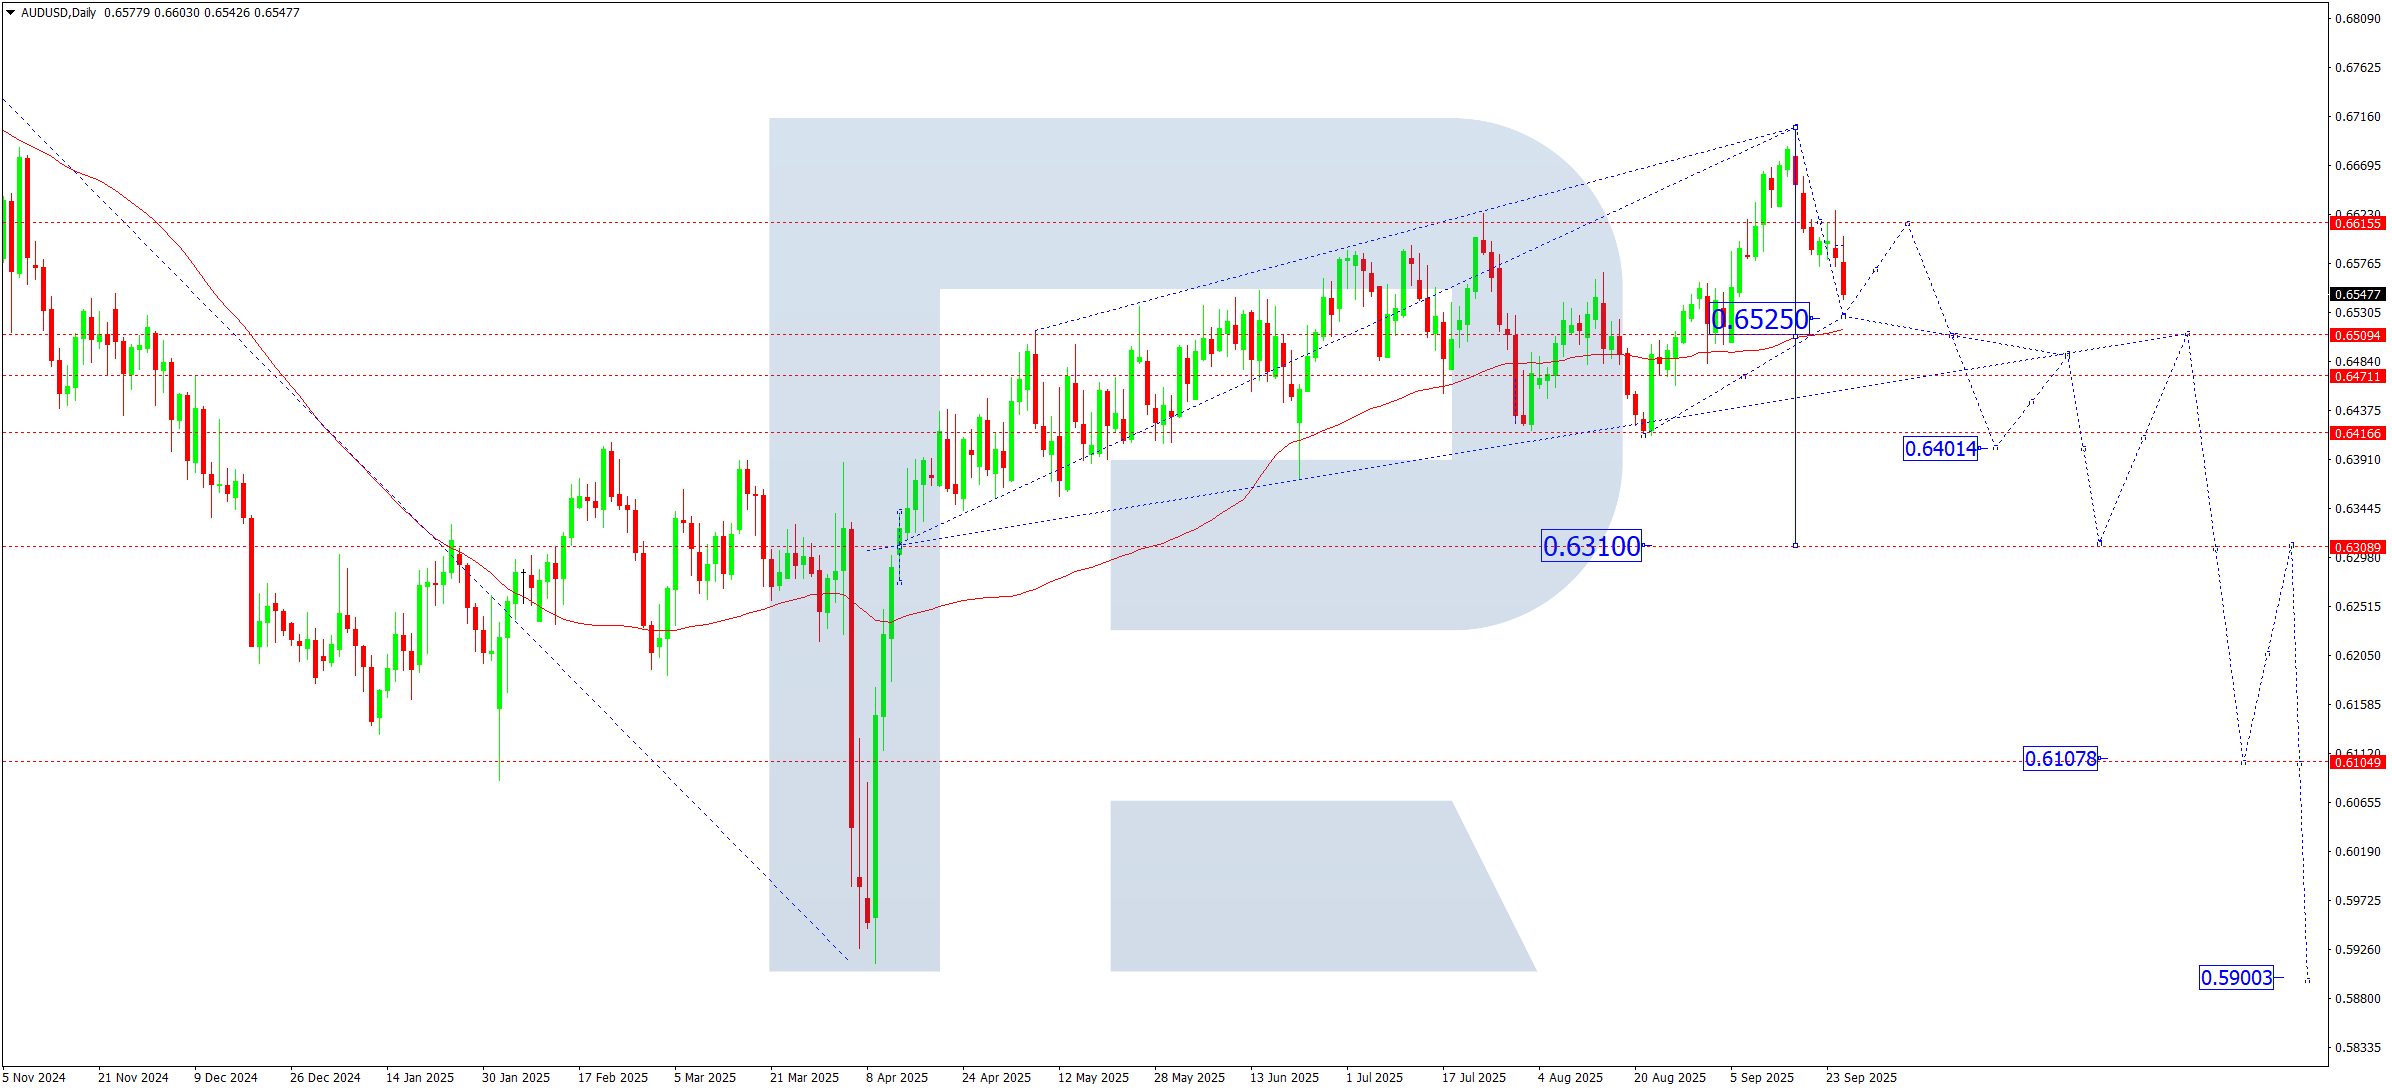
On the daily chart, the AUDUSD pair completed the first move down to 0.6525. A correction towards 0.6600 (testing from below) looks likely this week. After it ends, the next downward wave is expected, with the price breaking below the 0.6500 level and extending the trend to 0.6400. The local target for the entire bearish structure is located near 0.6310 (higher-degree trend target).
AUDUSD forecast scenarios
Bearish (baseline) scenario:
- 0.6600 – corrective rally target and PP of the current wave
- 0.6400 – third-wave target
- 0.6310 – main target of the higher-degree downward wave
Bullish (alternative) scenario:
Consolidation above 0.6650 will unlock upside potential:
- 0.6750 – nearest target
- 0.6820 – local target of the corrective wave
- 0.6870 – key support area
- 0.6969 – higher-degree target (extended fifth wave)
USDCAD forecast
The pair’s moves will depend on the US Dollar Index (DXY) and oil prices, which traditionally impact the Canadian dollar. Markets will also watch Canada’s GDP statistics and Fed speakers.
USDCAD technical analysis
On the daily chart, the USDCAD pair finished a growth wave, reaching 1.3947. A correction to at least 1.3838 looks likely this week. If pressure increases, the pullback could stretch to 1.3737. After the corrective decline ends, a new growth wave towards the local target at 1.4150 becomes the active scenario.
USDCAD forecast scenarios
Bullish (baseline) scenario:
If the pair holds within the consolidation range around 1.3947 and breaks upwards on rising volumes, it will open the potential for continued growth:
- target – 1.4150
Bearish (alternative) scenario:
A corrective scenario with a decline:
- first target – 1.3838
- second target – 1.3737
XAUUSD forecast
Gold remains in focus amid expectations of further monetary easing in several economies and persistent geopolitical uncertainty. Meanwhile, rising bond yields temporarily limit capital inflows into safe-haven assets.
XAUUSD technical analysis
On the daily chart, after breaking above the key 3,595 level, gold rallied to 3,791 and consolidated above the SMA50, which confirms bullish control. In the short term, the market retains the potential to move towards 3,941. After reaching this area, prices could correct towards 3,705. If the upward structure holds, the target remains near 4,060, the upper boundary of the current growth wave. Hitting this zone may complete the cycle and trigger a deeper correction with a long-term target around 3,150.
XAUUSD forecast scenarios
Bullish (baseline) scenario:
Consolidation above 3,595 opened the path to 3,941 and then 4,060.
Bearish (alternative) scenario:
A breakout and consolidation below 3,700 will signal a decline towards 3,595, with scope to extend the correction towards 3,150.
Brent forecast
The oil market still balances supply and demand factors. Expectations of lower inventories and a seasonal increase in consumption ahead of the winter period support prices. Geopolitical risks in the Middle East and OPEC+ guidance on potential output control add an extra driver. The rising US Dollar Index and uncertainty about the pace of global recovery remain headwinds.
Brent technical analysis
On the daily chart, Brent broke above 68.30 before entering a consolidation phase above that level. Oil thus left the long-term sideways range, which increases the odds of a medium-term upward wave. Continued growth towards 71.62 with scope to extend to 78.50 is a reasonable scenario to consider this week.
Brent forecast scenarios
Bullish (baseline) scenario:
The breakout above 68.30 confirms the formation of the fifth wave in the uptrend with targets:
- 71.60 – first target
- 74.75 – second target
- 78.50 – main upside target
Bearish (alternative) scenario:
If prices return below 65.50, the market can resume the correction, with targets at:
- 64.64 – first target
- 62.50 – second target
- 60.00 – main downside target
Forecasts presented in this section only reflect the author’s private opinion and should not be considered as guidance for trading. RoboForex bears no responsibility for trading results based on trading recommendations described in these analytical reviews.