Weekly technical analysis and forecast (22–26 September 2025)
This weekly technical analysis highlights the key chart patterns and levels for EURUSD, USDJPY, GBPUSD, AUDUSD, USDCAD, gold (XAUUSD), and Brent crude oil to forecast market moves for the upcoming week (22–26 September 2025).
Major technical levels to watch this week
- EURUSD: Support: 1.1650, 1.16 Resistance: 1.1800, 1.1900
- USDJPY: Support: 146.50, 145.5 Resistance: 148.00, 149.00
- GBPUSD: Support: 1.3355, 1.314 Resistance: 1.3590, 1.3690
- AUDUSD: Support: 6500, 64 Resistance: 6600, 6700
- USDCAD: Support: 1.3770, 1.373 Resistance: 1.3830, 1.3940
- Gold: Support: 3,595, 3,44 Resistance: 3,870, 3,940
- Brent: Support: 64.70, 6 Resistance: 68.88, 71.60
EURUSD forecast
The euro remains tied to expectations for ECB and Fed interest rates. Investors focus on inflation data and Federal Reserve rhetoric, with any signal of a shift towards looser policy potentially limiting the euro’s decline. On the other hand, weak eurozone data increases pressure on the EUR and supports a downward corrective wave.
EURUSD technical analysis
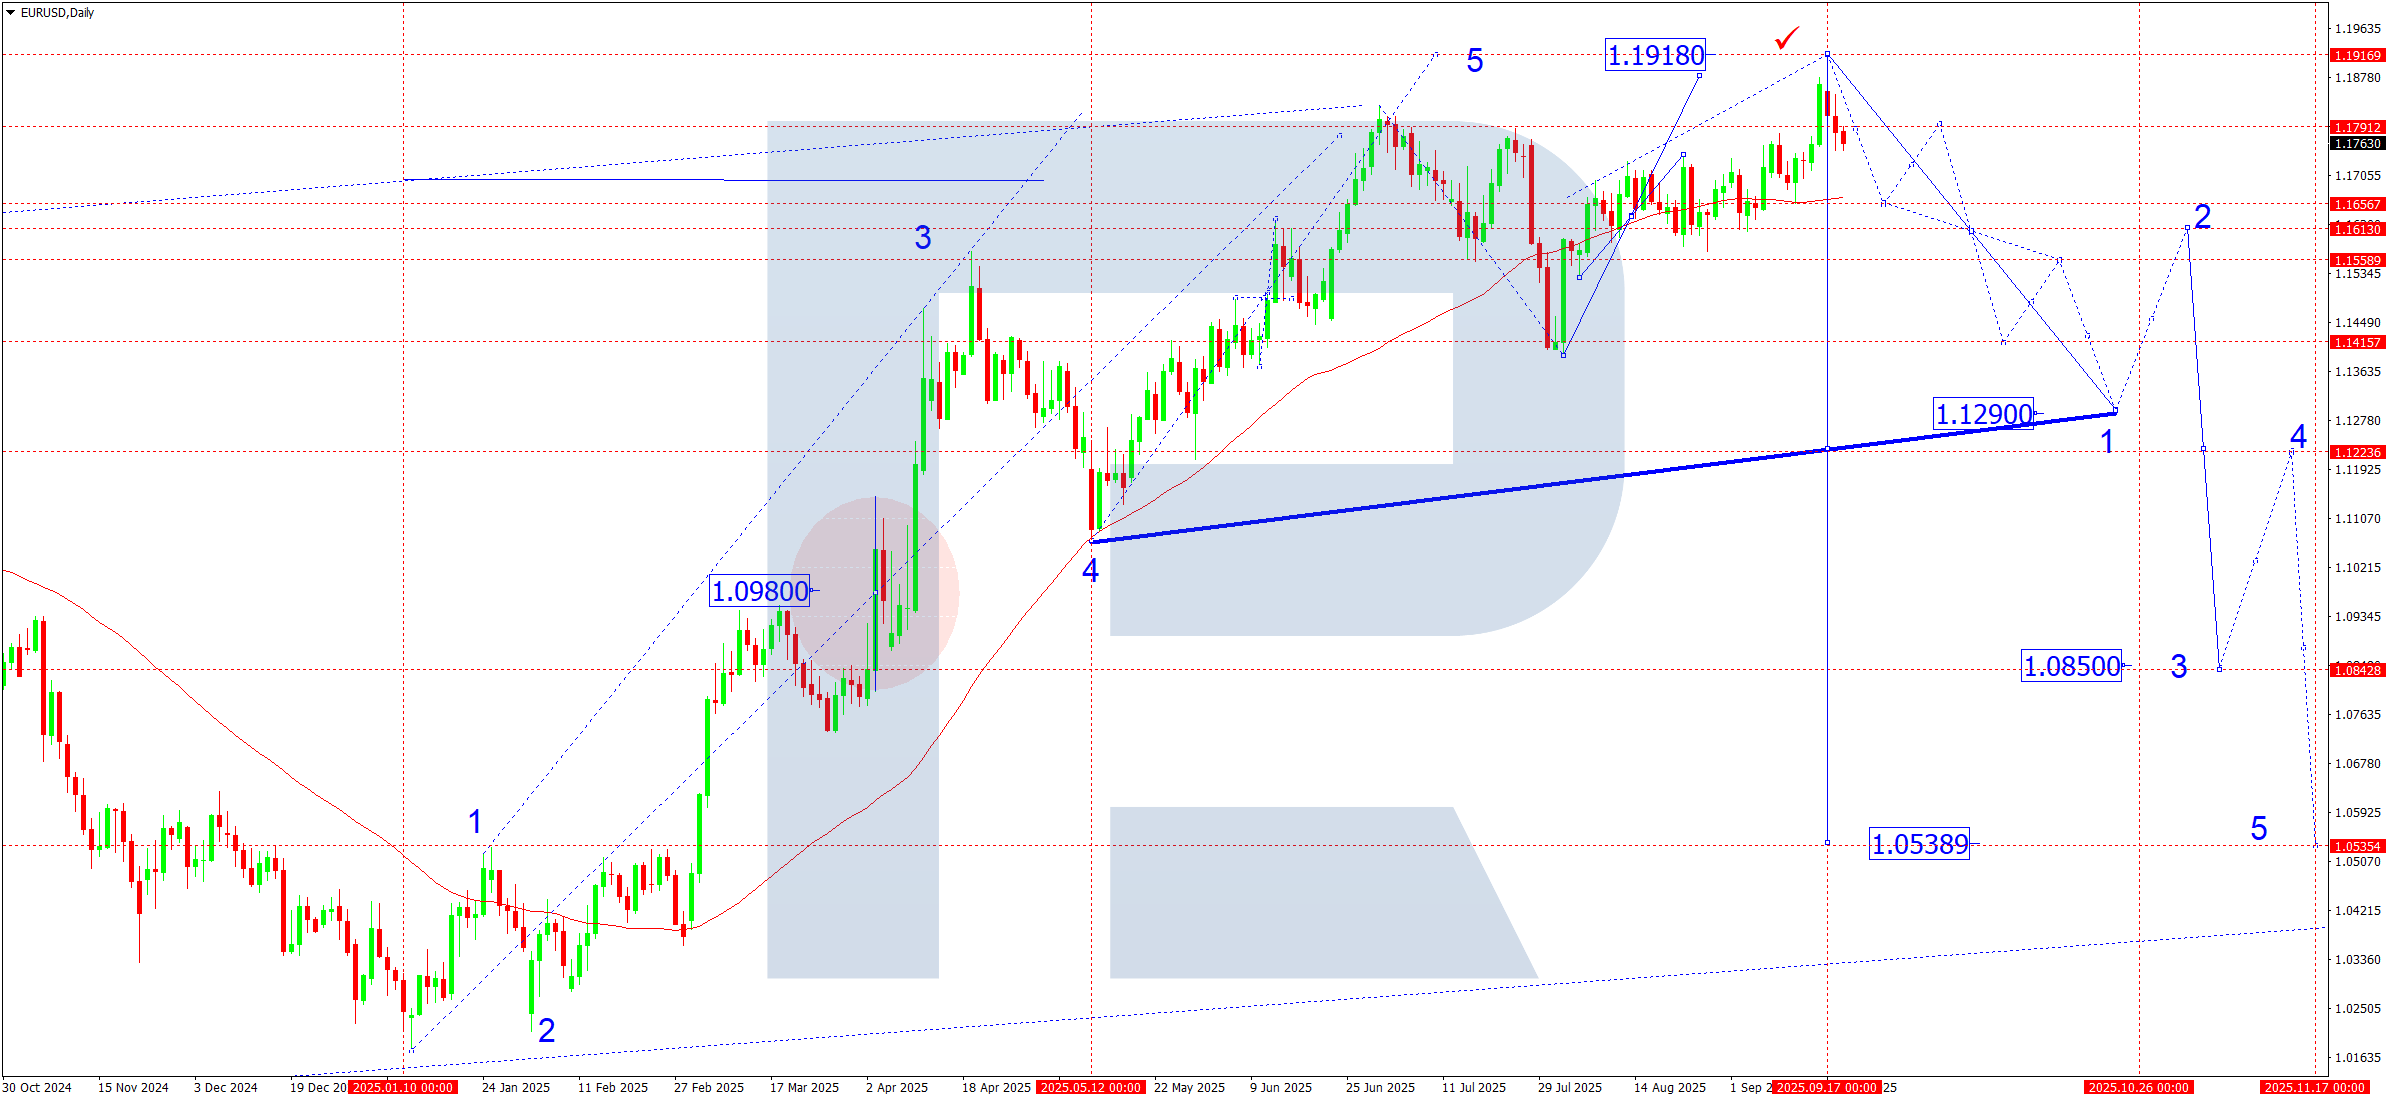
On the daily chart, the EURUSD pair found support at the SMA50 near 1.1650 and advanced to 1.1916, effectively forming a double top. Last week, the market started a decline towards 1.1655, which we view as part of the first wave of a drop to 1.1290. Afterwards, the pair could correct towards 1.1606.
In the near term, a five-wave decline is expected to unfold (wave labelling on the chart):
- Wave 1: target of 1.1290
- Wave 2 (correction): return to 1.1606 (testing from below)
- Wave 3: target of 1.0850
- Wave 4: rebound to 1.1222 (testing from below)
- Wave 5: final downside target at 1.0540
EURUSD forecast scenarios
Bearish (baseline) scenario:
The pair is expected to continue a decline within the first wave.
- The main target of the week is 1.129
- After hitting it, a short-term rebound (the second wave) to 1.1606 is likely.
Bullish (alternative) scenario:
If the price breaks above 1.1800, the market may attempt another move to 1.1900, which could temporarily cancel the scenario of a decline starting this week.
USDJPY forecast
The USDJPY rate remains driven by mixed forces. The market is influenced by expectations for the Fed’s path and US Treasury yields. Investors also watch US and Japanese data, which may raise volatility within the current range. The US dollar retains support from resilient labour data and Fed policy expectations. On the other hand, the Bank of Japan keeps a soft stance, but periodic intervention risks stop the market from holding confidently above 150. Geopolitical tensions and US yields remain the main volatility drivers. If global risks rise, the yen can act as a safe haven, adding uncertainty for the medium-term trend.
USDJPY technical analysis
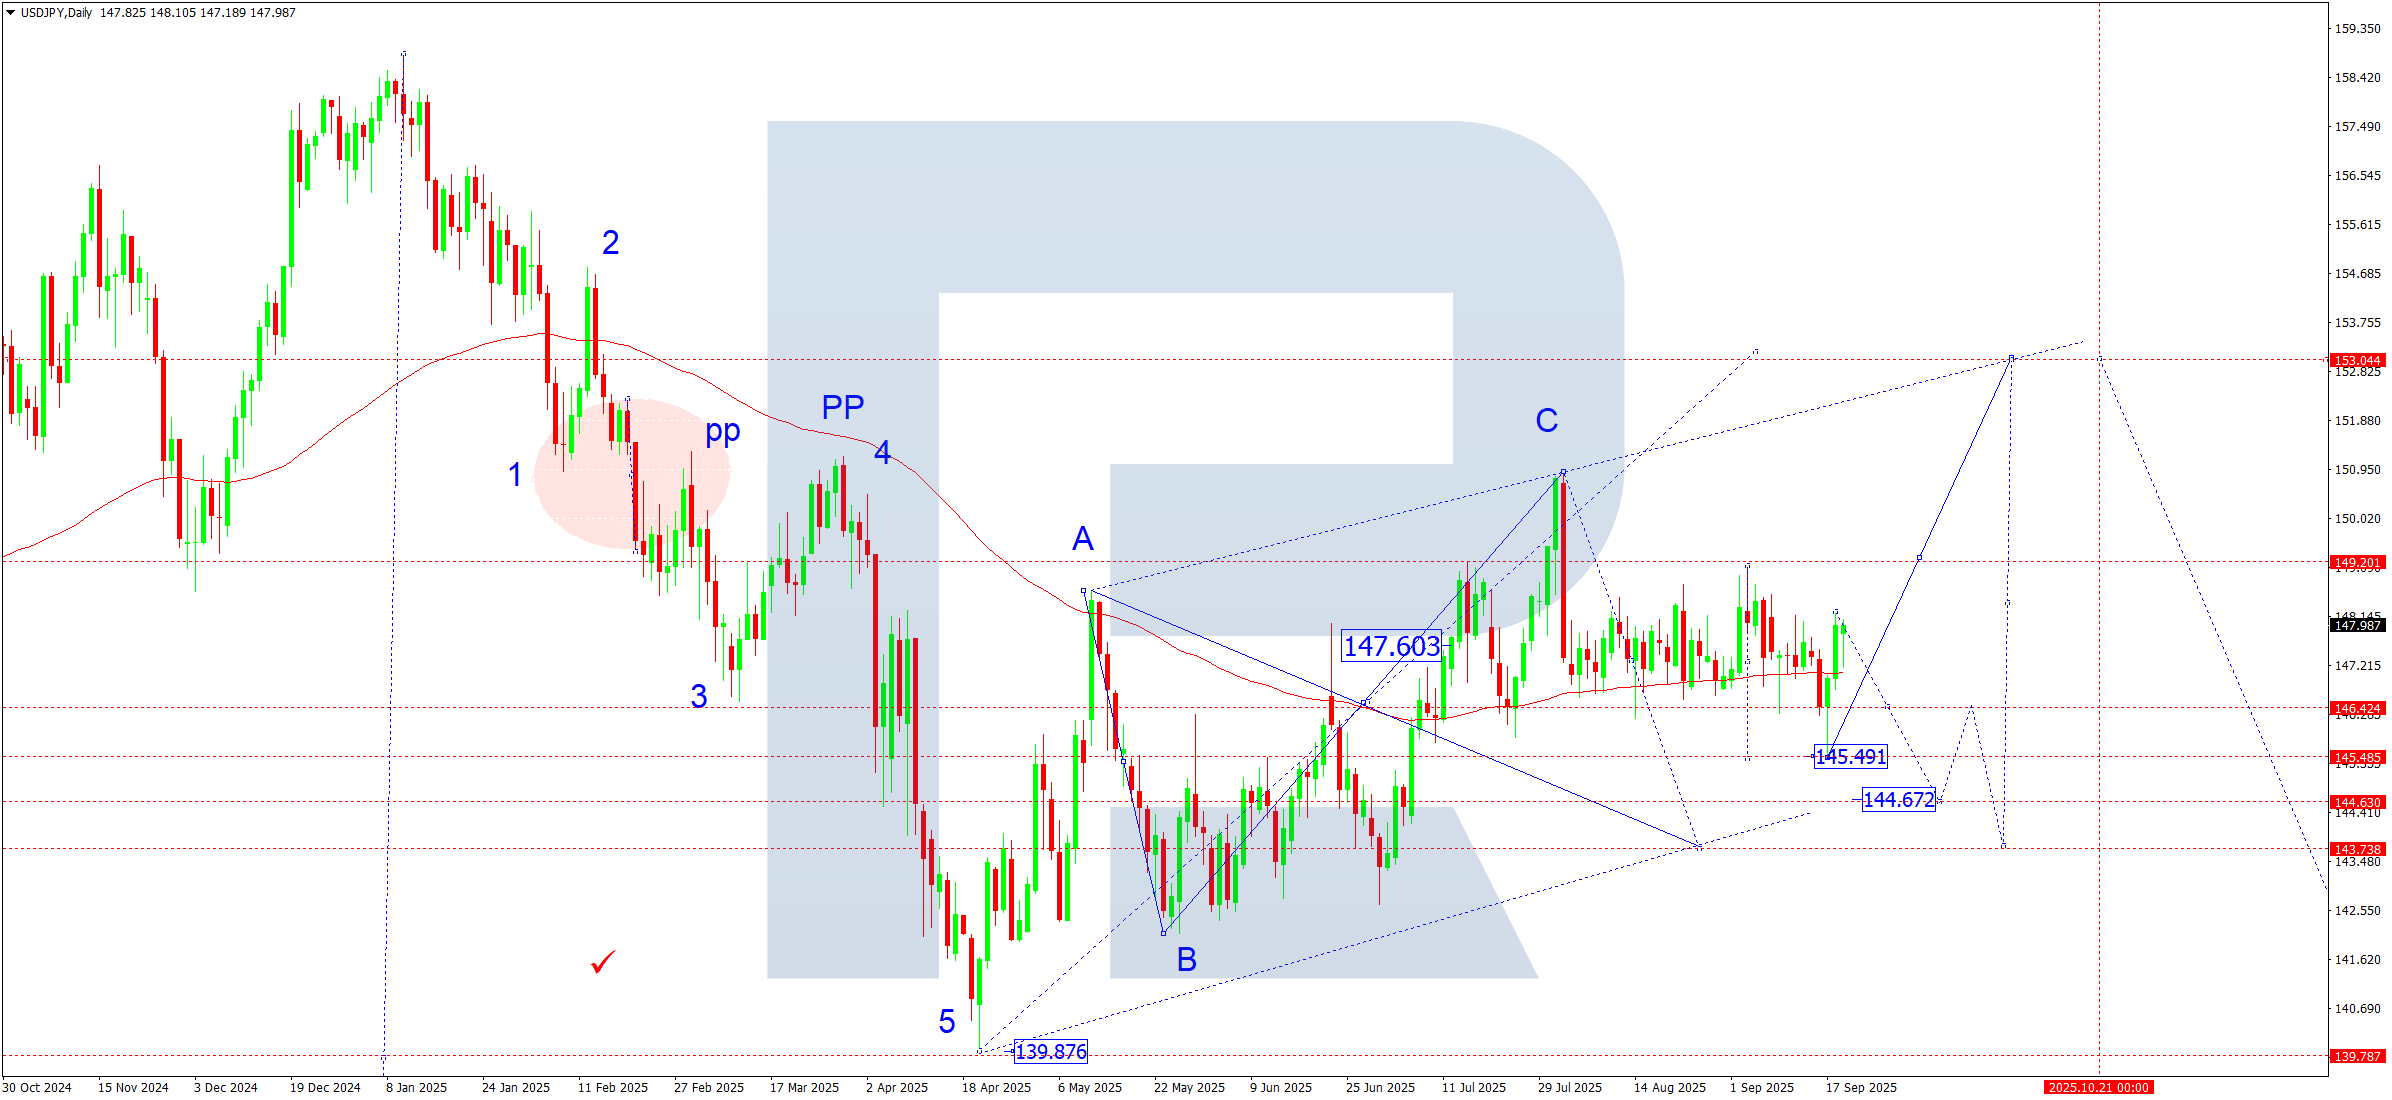
On the daily chart, the market continues to build a consolidation range around 147.30, extending it up to 149.12 and down to 145.50. The price is hovering above the SMA50, which keeps buyers in control. This week, the pair is expected to move to the range top near 149.00. A firm breakout with rising volumes would open the potential for a movement towards 153.00. A breakout down through 145.50 would push the pair down to 144.66 and then the 143.70 area.
USDJPY forecast scenarios
Bullish (baseline) scenario:
Support at 146.50 and a breakout of 148.00 with rising volumes would open the path to 150.80, with the trend potentially extending to 153.00.
Bearish (alternative) scenario:
A confident breakout below 145.50 would target 144.66; if pressure intensifies, the market may test 143.70.
GBPUSD forecast
Fundamental pressure on the pound persists. The market is pricing in a high chance the Bank of England will refrain from hikes until the end of the year, given easing inflation and signs of cooling activity. The UK weakness in retail sales and construction adds to recession risks.
The strong US dollar adds to the pressure: despite some dovish remarks from individual members, the Fed keeps rates high, driving demand for the USD amid rising US Treasury yields. Foreign policy instability also boosts the USD’s appeal as a safe-haven asset.
GBPUSD technical analysis
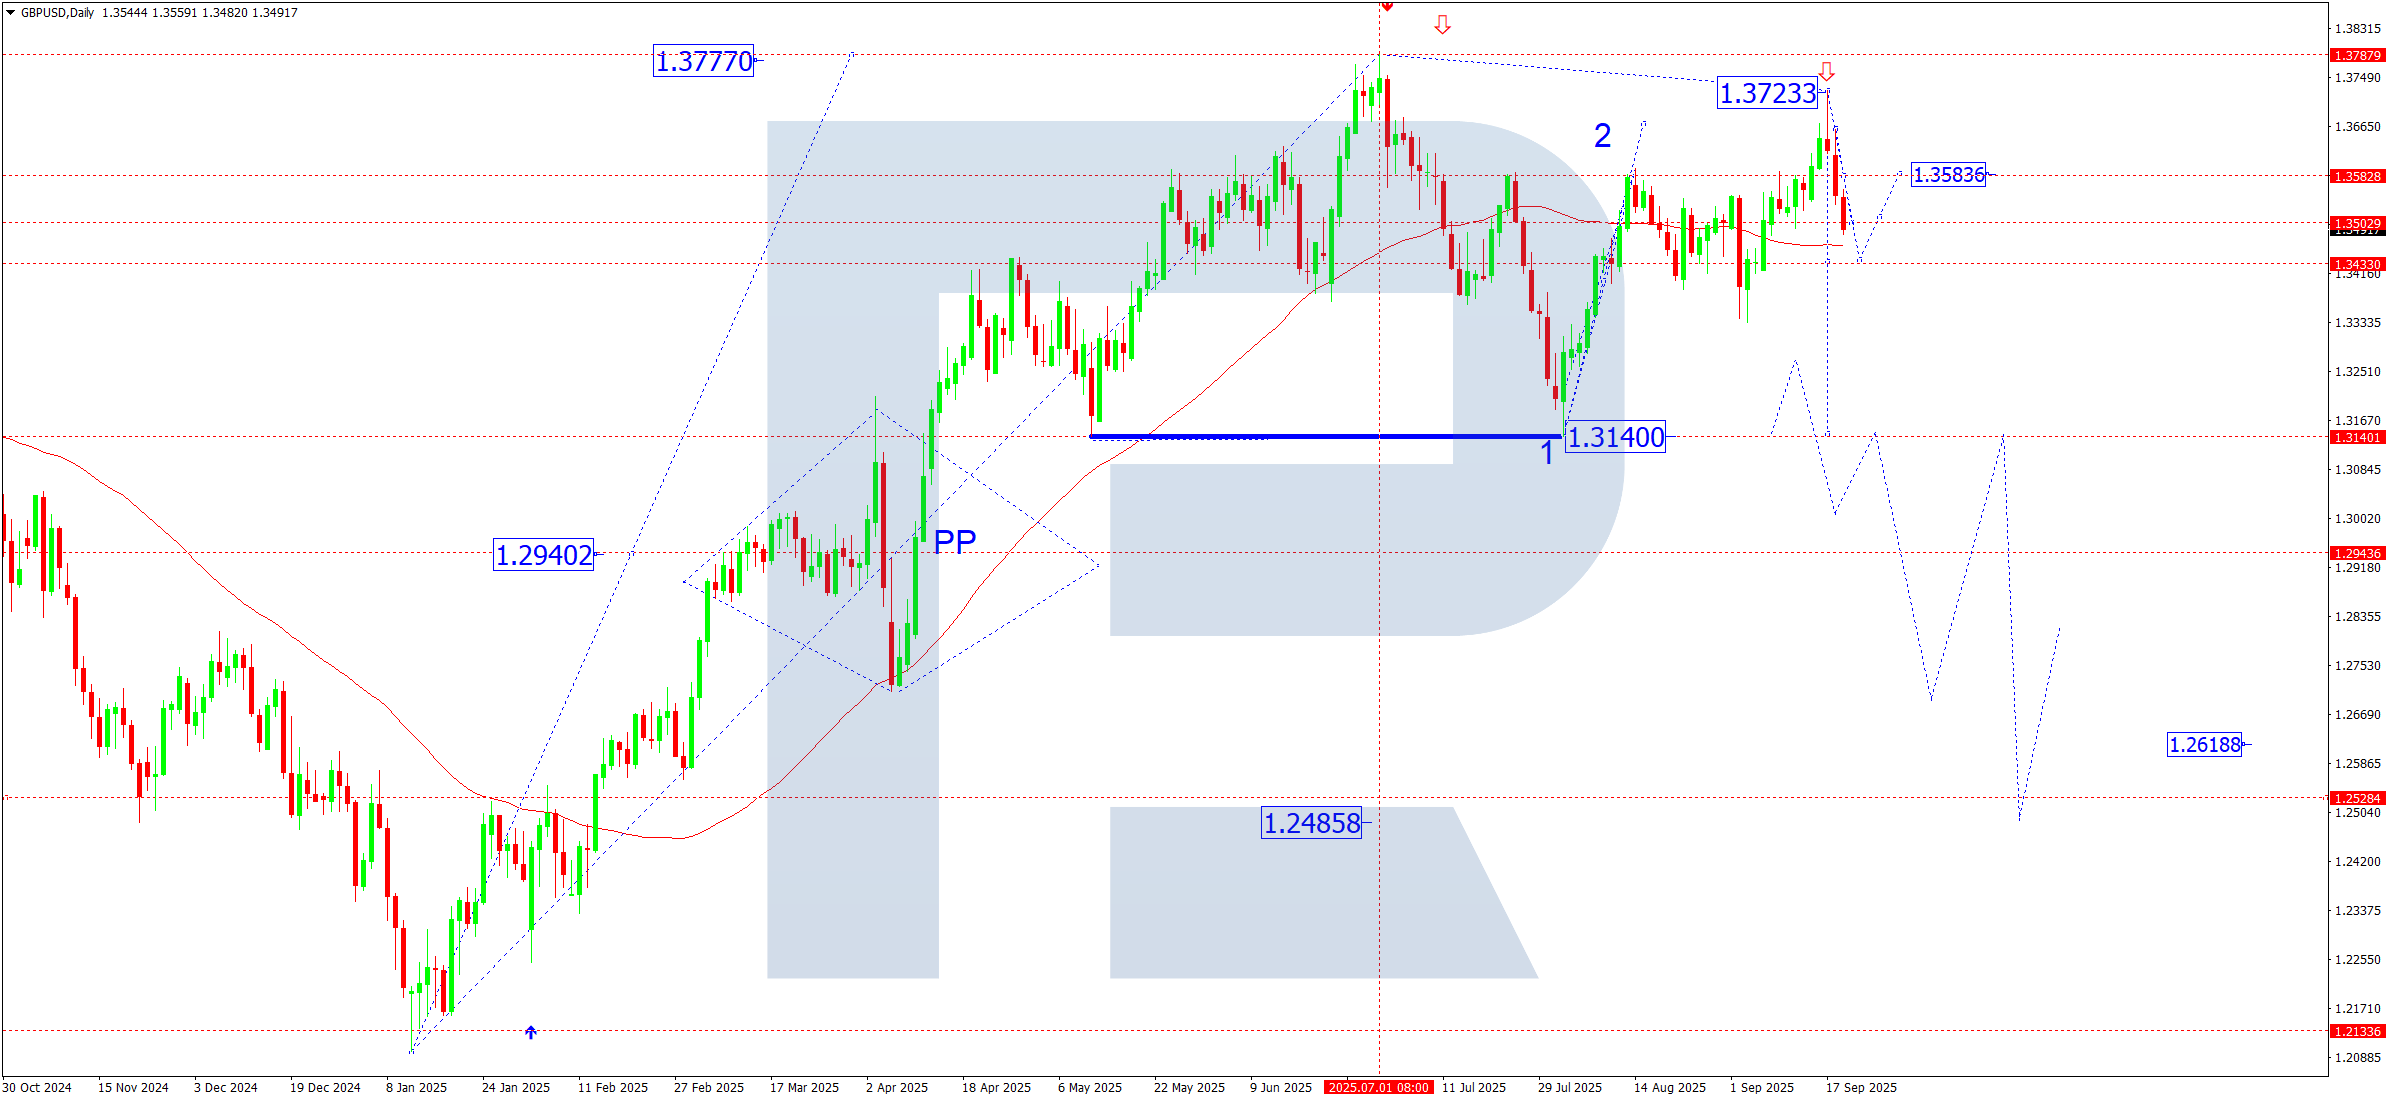
On the daily chart, the GBPUSD pair completed a corrective wave at 1.3723 and started another third wave down towards 1.3140. This week, the pair is expected to see a decline to 1.3434 and a rebound to 1.3585. Subsequently, a drop to 1.3280 could follow, with the move potentially continuing towards 1.3140.
GBPUSD forecast scenarios
Bearish (baseline) scenario:
The five-wave decline remains in play: the third-wave structure is expected to develop, targeting 1.3140 – only half of the wave.
Bullish (alternative) scenario:
Consolidation above 1.3600 would open the potential for a move to 1.3770.
- Targets are at 1.3800 and 1.4000, and with strong momentum up to 1.4160
AUDUSD forecast
The Australian dollar remains under pressure, with key drivers being:
- China risks: slower economic growth and weak industry weigh on demand for Australia’s commodity exports
- Policy gap: the Fed keeps a hawkish tone while the RBA stays cautious, which favours the USD
Commodity markets: iron ore and copper remain volatile, adding to pressure on the AUD. Together, these factors cap the upside and keep the bearish scenario as the main one.
AUDUSD technical analysis
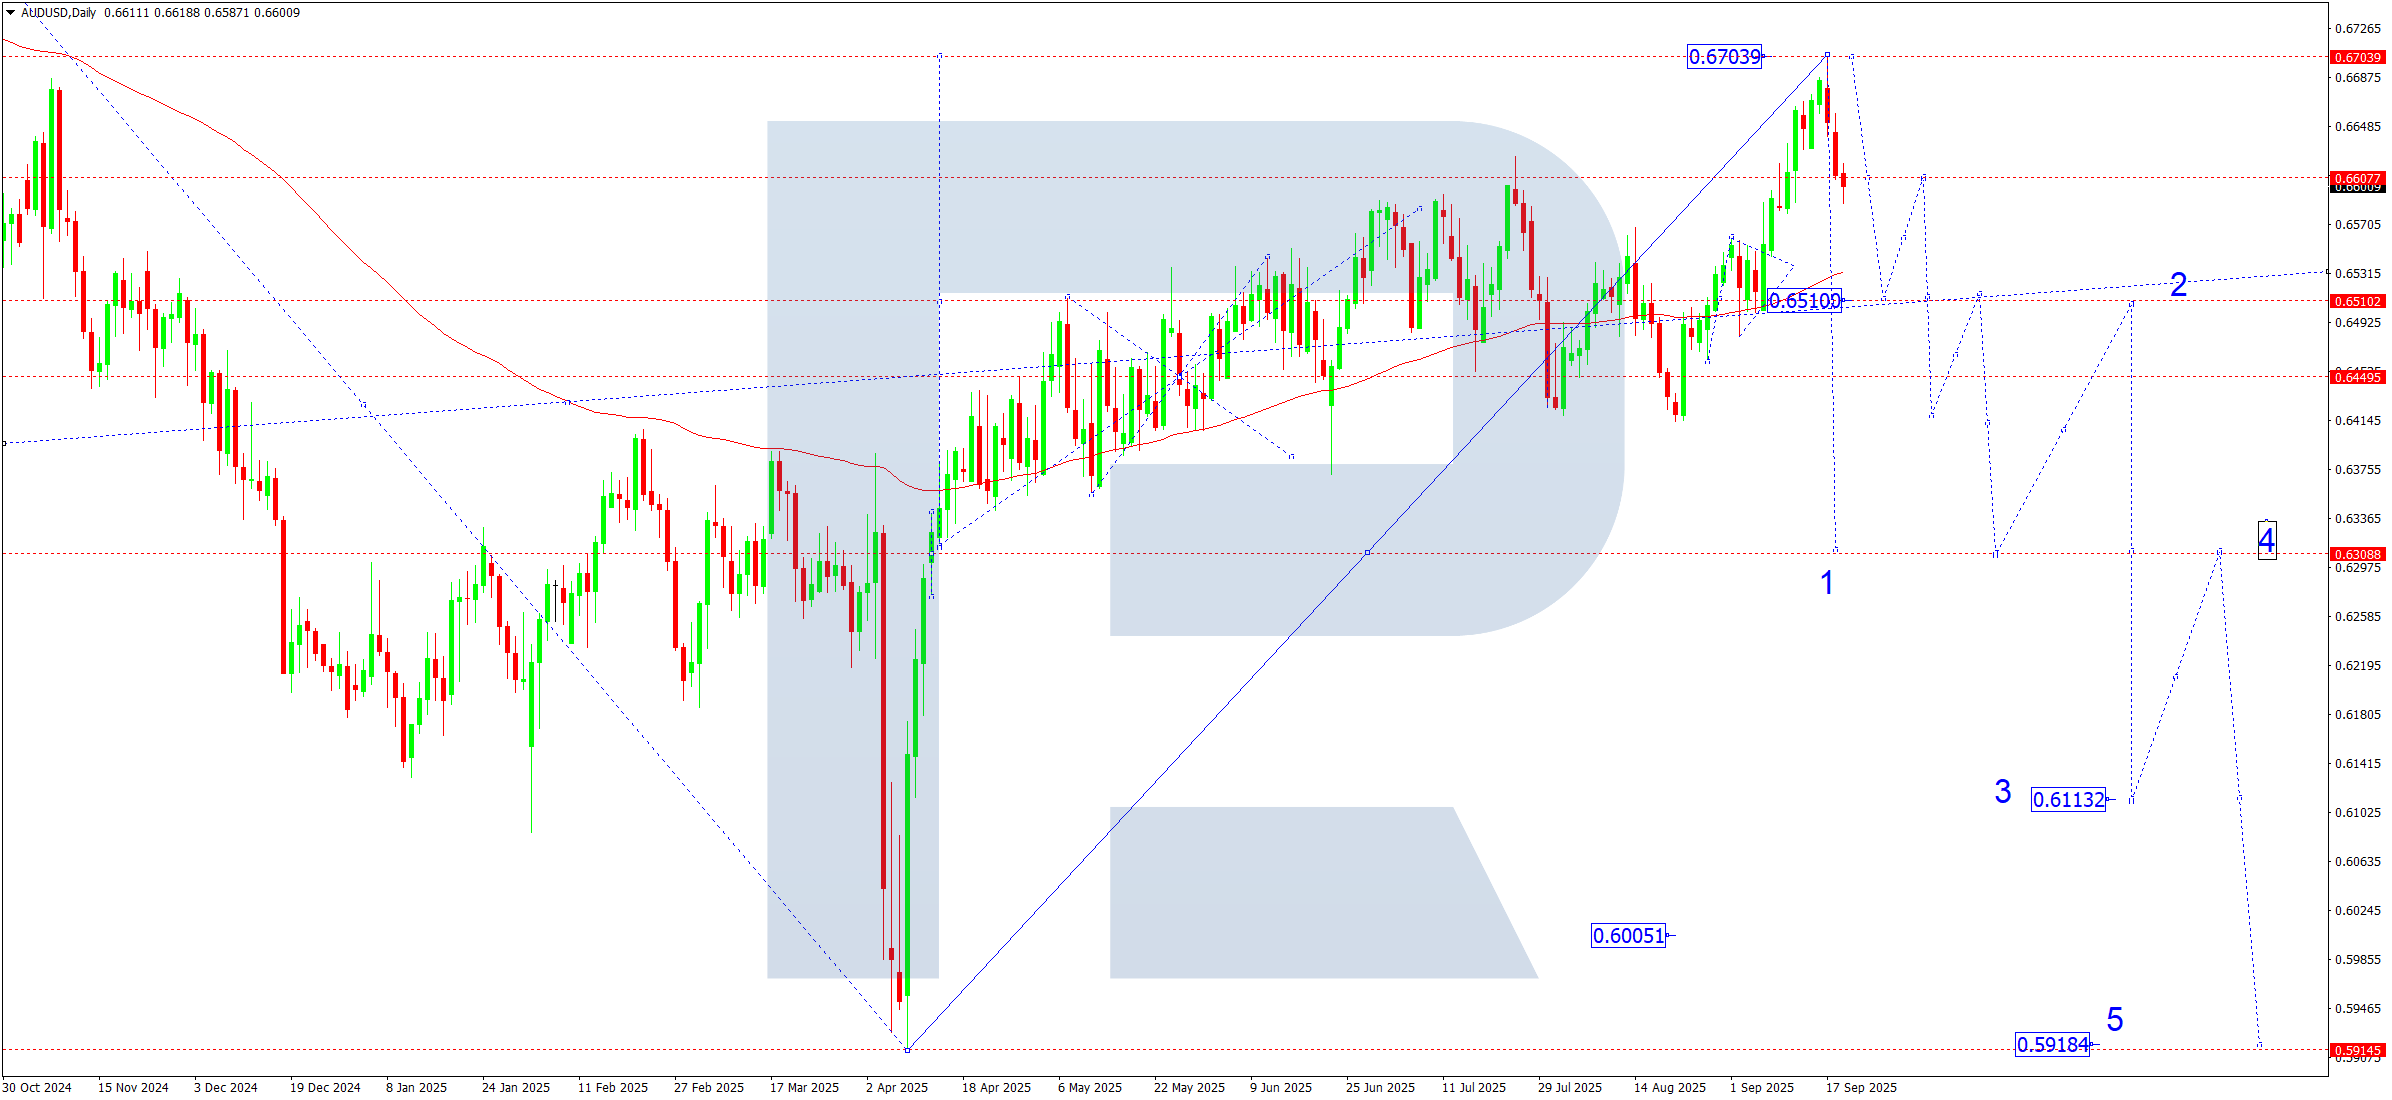
On the daily chart, the AUDUSD pair broke out of a consolidation range and rallied to 0.6704. The market then started to decline towards 0.6510. After hitting this level, the price is expected to bounce to 0.6600. Once this correction ends, the downtrend should resume, with the local target at 0.6400 and a potential further move to 0.6300.
AUDUSD forecast scenarios
Bearish (baseline) scenario:
Continued decline while forming a downward wave.
Targets:
- 6510 – intermediate target, estimated PP level
- 6400 – third-wave target
- 6300 – main target of the first trend wave
Bullish (alternative) scenario:
If the price consolidates above 0.6650, the market may resume growth.
Targets:
- 6750 – local resistance level
- 6820 – local growth target
- 6870 – strong support/resistance area
- 6969 – extended fifth-wave target
USDCAD forecast
Canada, as a major oil exporter, remains sensitive to commodity prices. Rising oil supports the CAD, while falling prices can push the USDCAD pair higher. The main focus in Canada is on bank rates and inflation data. On 17 September, the Bank of Canada cut the policy rate by 25 basis points to 2.50%. If further inflation and retail sales data prove weak, the CAD may come under greater pressure. The USDCAD pair could slow its rise or start to fall – a bearish scenario. If the regulator confirms this cut as the start of an easing cycle, this would weaken the CAD, pushing the USDCAD rate higher. Conversely, stronger-than-expected data, especially on inflation or labour, may bolster the CAD and cap the pair below the 1.3830–1.3940 resistance band. It is also important to monitor news on tariffs and trade agreements, as changes in the trade regime can impact the Canadian economy and the exchange rate.
USDCAD technical analysis
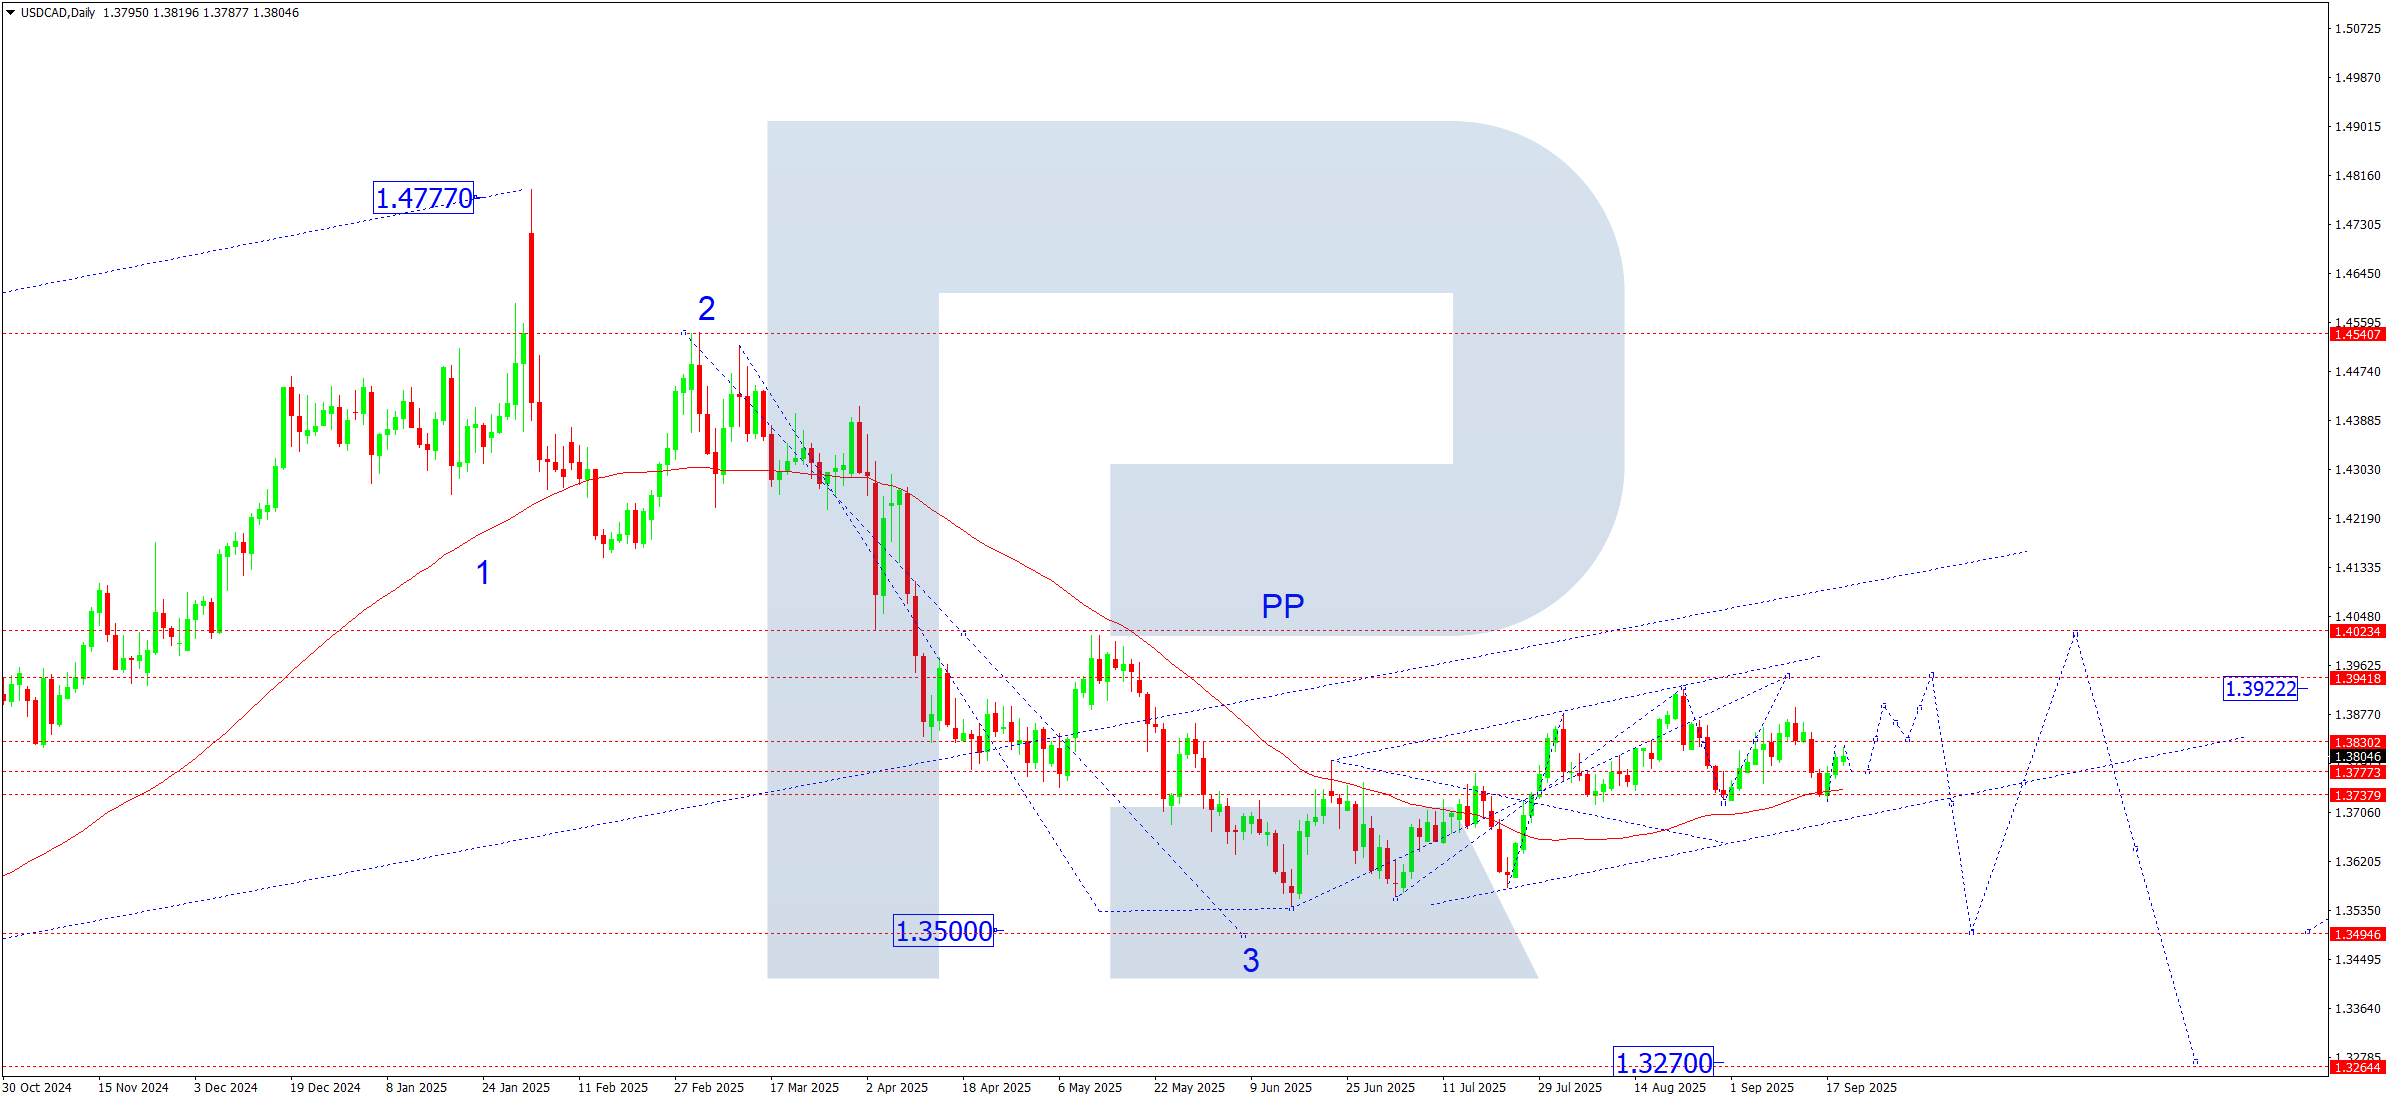
On the daily chart, the USDCAD pair found support at 1.3737 and continues to build a growth wave, with the minimal target at 1.3940. The market effectively retested the growth matrix pivot point from above. The SMA50 lies in this area and can propel the price towards 1.3940, the main correction target.
The long-term picture remains neutral-to-bearish. Later, the downtrend should resume towards at least 1.3500. Therefore, the current structure is viewed as a correction within the dominant downtrend.
USDCAD forecast scenarios
Bearish (alternative) scenario:
The completion of the correction at 1.3940 will increase pressure on the pair.
Next downside targets:
- 1.3700 – first target
- 1.3800 – second target
- 1.3600 – third target
- 1.3700 – fourth target
- 1.3500 – main target (within the third wave from the 1.4540 high)
Bullish (main) scenario:
Consolidation above 1.3770 followed by a breakout over 1.3800 opens the potential for growth to 1.3940, the main estimated correction target. In that case, the next downside target could be at 1.3500.
XAUUSD forecast
Gold remains driven by mixed forces:
- expectations of further Fed easing after the latest rate cut
- rising demand for safe-haven assets amid geopolitical risks
- movements in US Treasury yields and the dollar will be key for gold
- demand from central banks and Asian markets remains a supportive factor
XAUUSD technical analysis
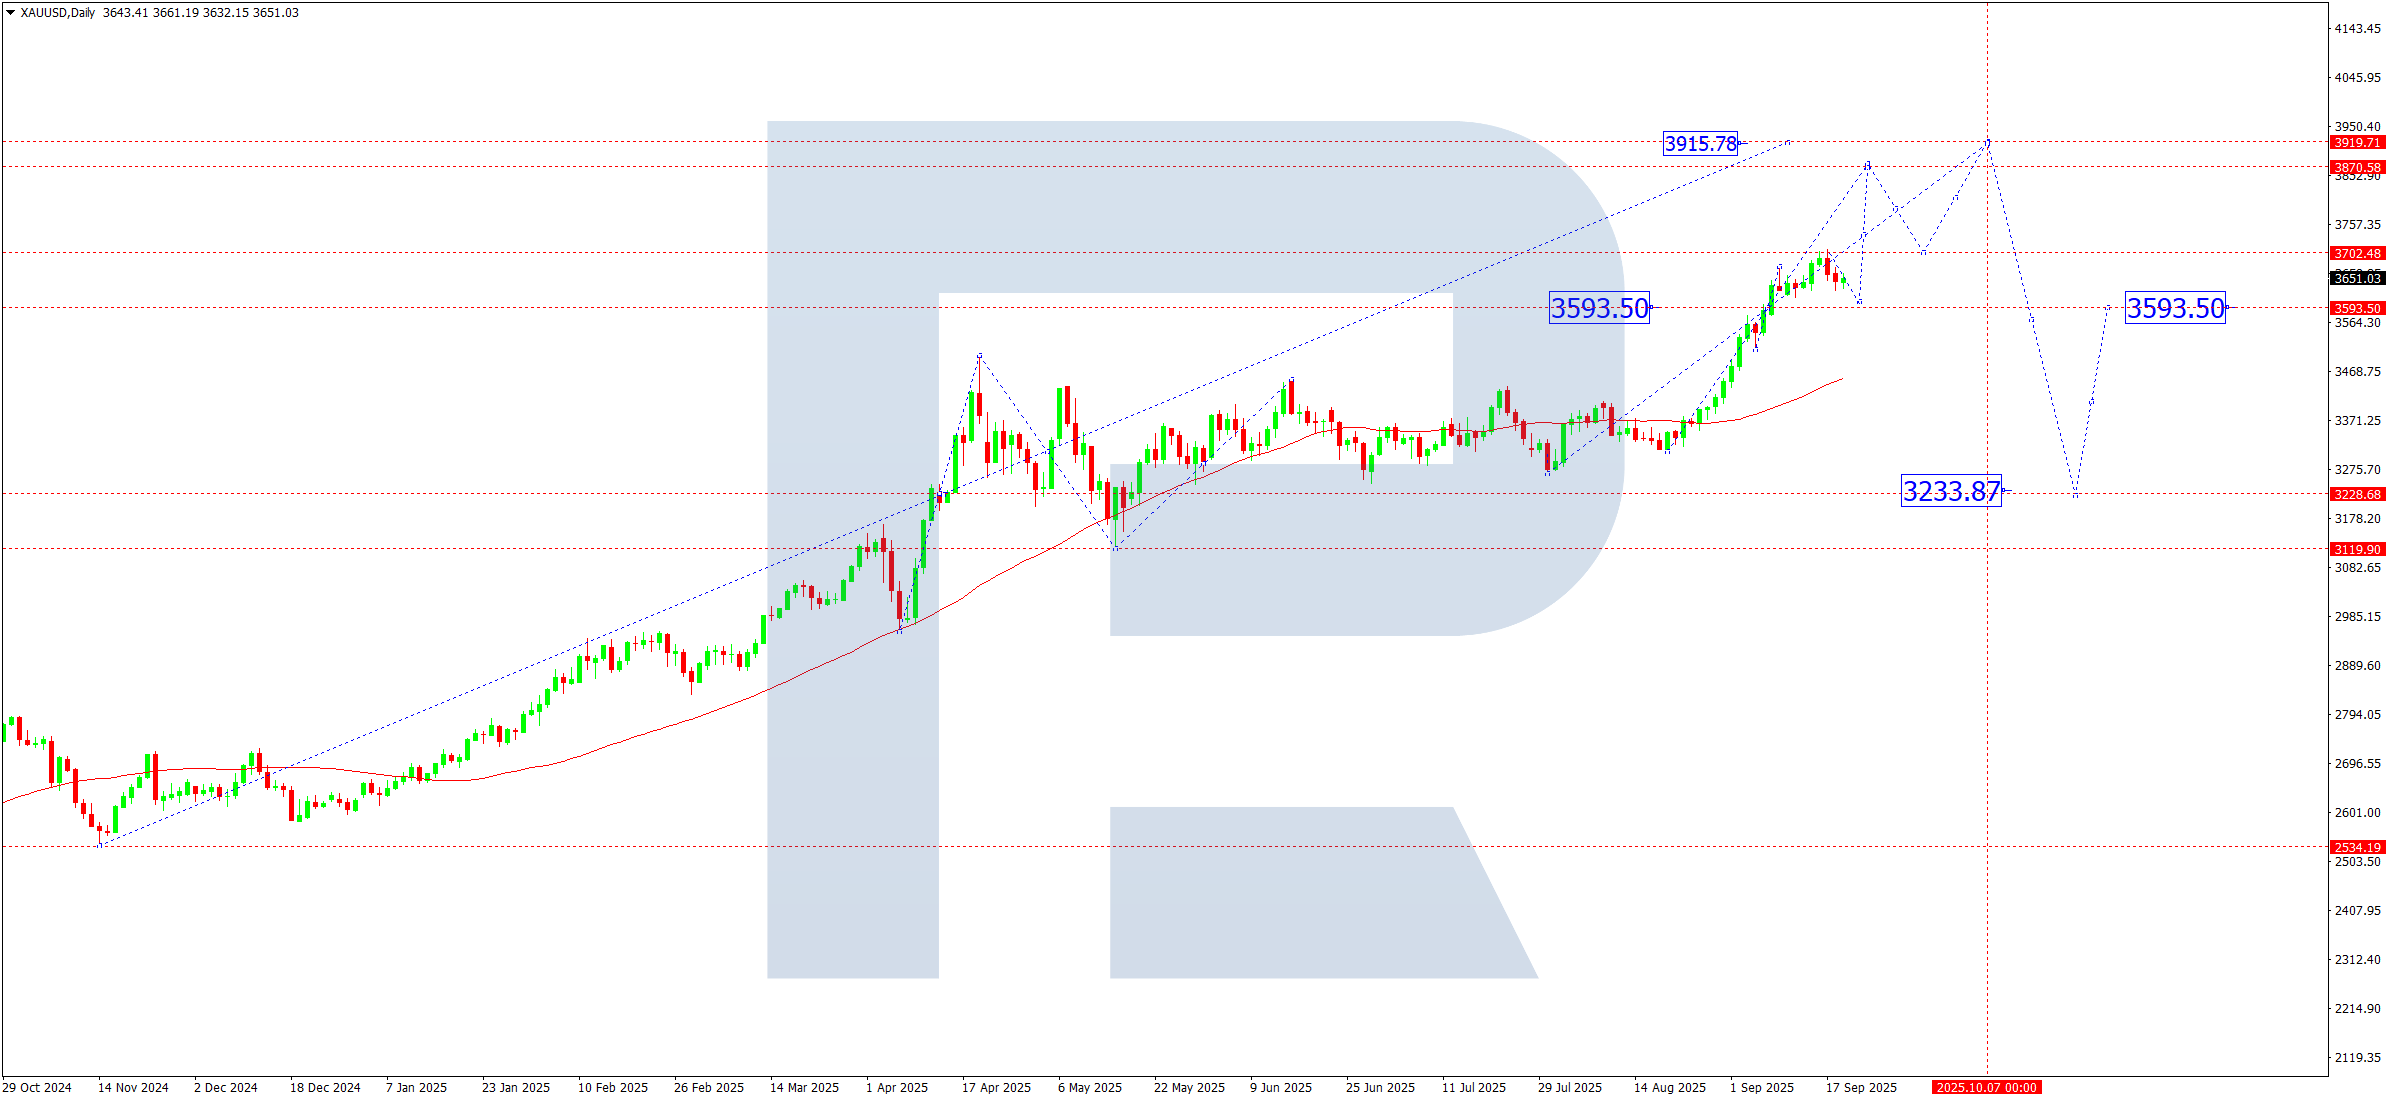
On the daily chart, after breaking above 3,595, gold advanced to 3,707. Prices consolidated above the SMA50, confirming sustained bullish momentum.
This week, gold is expected to continue its upward trajectory towards the nearest target of 3,940. After hitting this level, a correction towards 3,700 looks likely, from where the trend may resume towards the key target of the current growth wave at 4,070.
In the longer term, after reaching 4,070, a significant correction could form, with the first target at 3,233.
XAUUSD forecast scenarios
Bullish (baseline) scenario:
Consolidation above 3,595 would open the way to:
- 3,935 – 3,940 – key resistance level
- 4,070 – potential top of an extended fifth wave
Bearish (alternative) scenario:
A breakout and consolidation below 3,595 would trigger a decline towards:
- 3,233 – intermediate support level
- 2,900 – technical and fundamental correction area
Brent forecast
The market balances concerns about slower global economic growth (which weighs on demand) against geopolitical risks that support prices. Focus stays on US crude inventory data, the OPEC+ report, and the US dollar’s path after the Fed’s decisions. OPEC+ cuts continue to support Brent, but if demand stays weak, downside pressure remains relevant.
Brent technical analysis
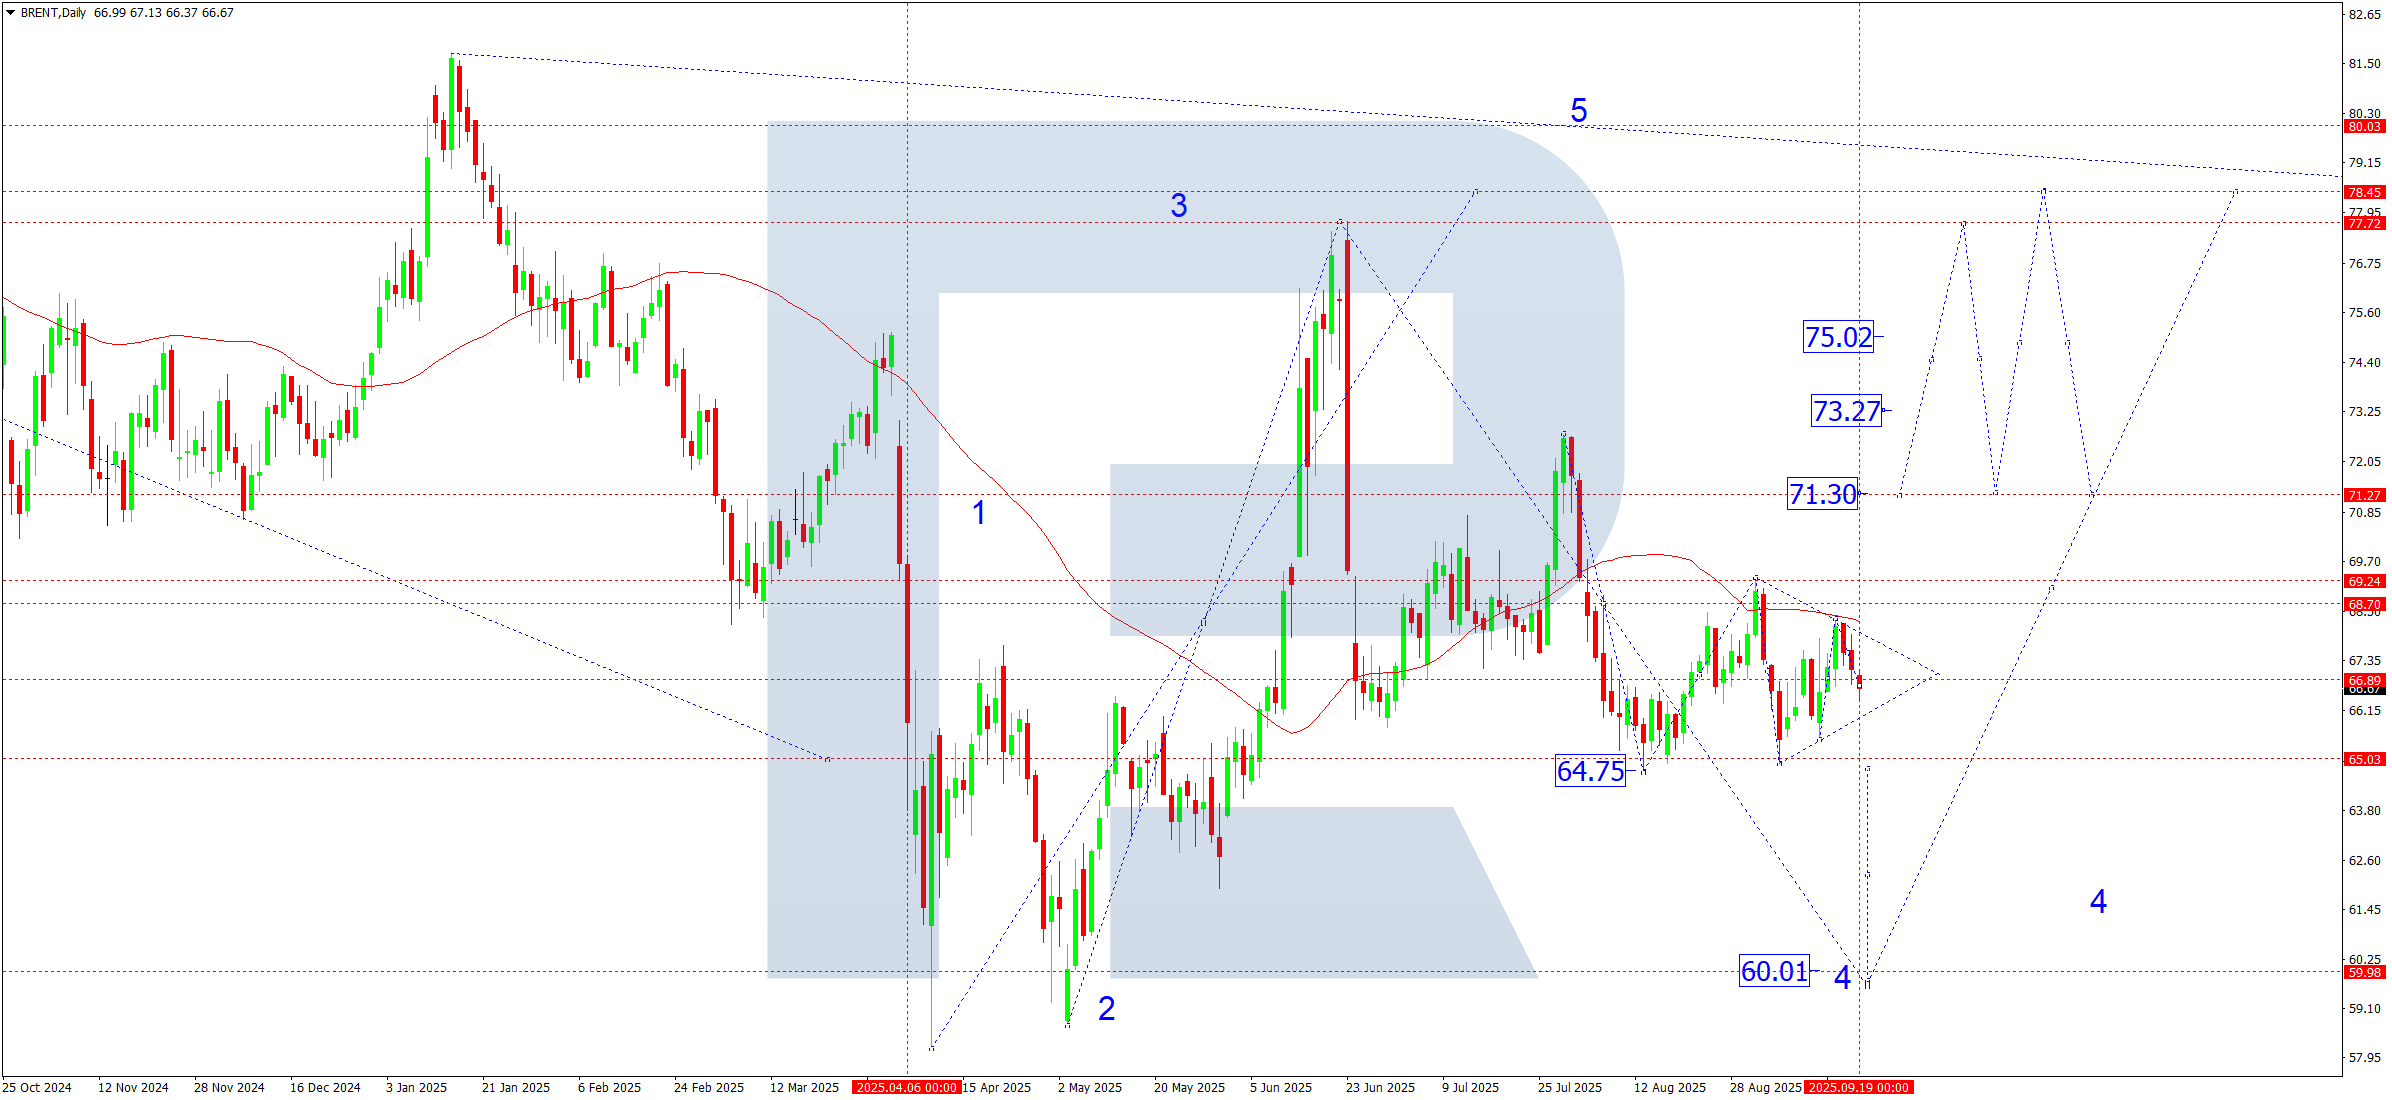
On the daily chart, Brent fell from the SMA50 (68.30) to 66.00, staying in a broad consolidation range around 68.70. A breakout below 65.50 will open the potential for a decline to 60.00. If prices consolidate above 68.80, the market will receive a signal to resume the upward wave with a near-term target at 78.45.
Brent forecast scenarios
Bearish (baseline) scenario:
While prices are trading below the SMA50, the primary scenario is a continued correction:
- 64.64 – first target
- 62.50 – second target
- 600 – main downside target
Bullish (alternative) scenario:
Consolidation above 68.00–68.80 will confirm the uptrend:
- 71.30 – first target
- 73.30 – second target
- 75.00 – local target
- 78.45 – main upside target
Forecasts presented in this section only reflect the author’s private opinion and should not be considered as guidance for trading. RoboForex bears no responsibility for trading results based on trading recommendations described in these analytical reviews.