Weekly technical analysis and forecast (1-5 September 2025)
This weekly technical analysis highlights the key chart patterns and levels for EURUSD, USDJPY, GBPUSD, AUDUSD, USDCAD, gold (XAUUSD), and Brent crude oil to forecast market moves for the upcoming week (1-5 September 2025).
Major technical levels to watch this week
- EURUSD: Support: 1.1500, 1.1400. Resistance: 1.1700, 1.1800
- USDJPY: Support: 146.50, 144.33. Resistance: 148.75, 150.80
- GBPUSD: Support: 1.3355, 1.3140. Resistance: 1.3590, 1.3690
- AUDUSD: Support: 0.6400, 0.6245. Resistance: 0.6500, 0.6565
- USDCAD: Support: 1.3727, 1.3650. Resistance: 1.3900, 1.3940
- Gold: Support: 3,370, 3,250. Resistance: 3,440, 3,500
- Brent: Support: 64.70, 60.00. Resistance: 68.88, 71.60
EURUSD forecast
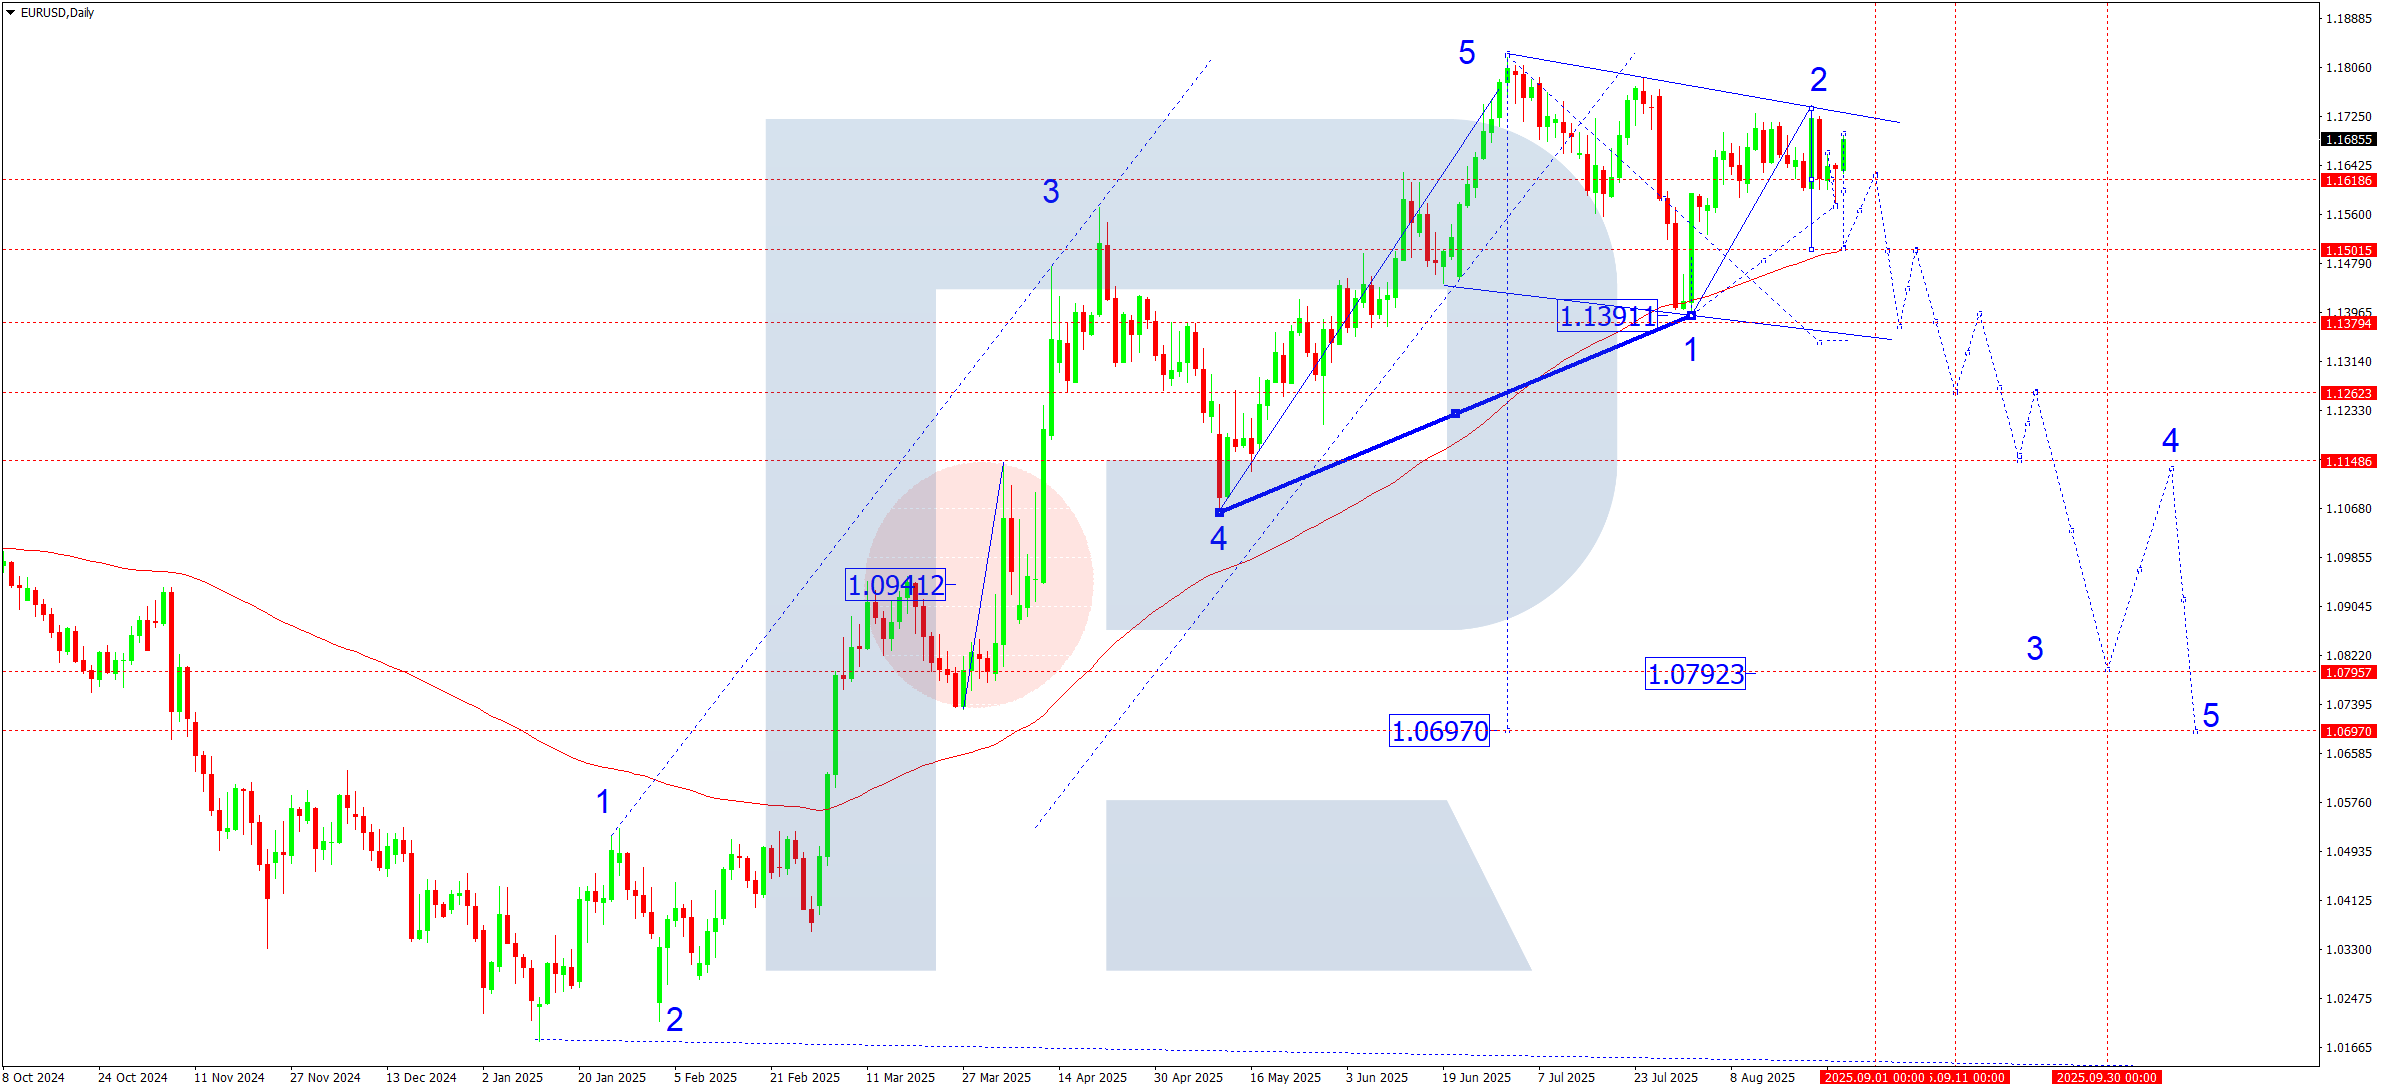
The fifth growth wave reached its calculated targets and stalled in a strong consolidation range at the top of the structure. Historically, the following week often becomes a turning point. Against this background, the baseline scenario is a downward reversal: technical exhaustion and the artificial nature of the previous rally meet the flow of real macroeconomic data from the eurozone.
The week is rich in key data (HICP, PMI, eurozone GDP, and US NFP), which may trigger the reversal. Any hint from the Federal Reserve of patience, combined with weak EU data, is a bearish mix for EURUSD. If European data disappoints, the reversal scenario strengthens, and the likelihood of serious downside exceeds the base case.
EURUSD technical analysis
On the daily chart, the EURUSD pair made a downward impulse to 1.1616 and formed a consolidation range around this level. The range expanded down to 1.1575 and up to 1.1696. Further, the scenario suggests a continued downward move towards 1.1500, the first target in the next downward wave. The SMA50 may act as interim support at this level and push the market into a correction back to 1.1616. Once the correction ends, the pair could dip at least towards 1.1390.
EURUSD forecast scenarios
Bearish (base):
A downward wave structure forms:
- Wave 1 – 1.1500
- Wave 2 – correction towards 1.1616 (testing from below)
- Wave 3 – 1.1400
- Wave 4 – correction towards 1.1500 (testing from below)
- Wave 5 – target 1.1260
Bullish (alternative):
If the market consolidates above 1.1700, this will open the potential for growth towards 1.1800.
USDJPY forecast
The USDJPY pair remains under mixed influences. The market reflects expectations about the Fed’s policy path and US Treasury yield dynamics. Investors will also focus on US and Japanese statistics, which may add to volatility within the current range. The coming week will highlight US labour market and inflation data, which may adjust expectations for the next Fed rate cut cycle. High US yields continue to support the dollar.
Japan’s monetary policy remains soft despite gradual rhetoric about normalisation. The risk of verbal interventions from the Ministry of Finance remains high, potentially causing short-term spikes in volatility. Oil prices and China’s economic performance may also play a role. If global risks escalate, the yen could act as a safe-haven currency, creating uncertainty for the medium-term trend.
USDJPY technical analysis
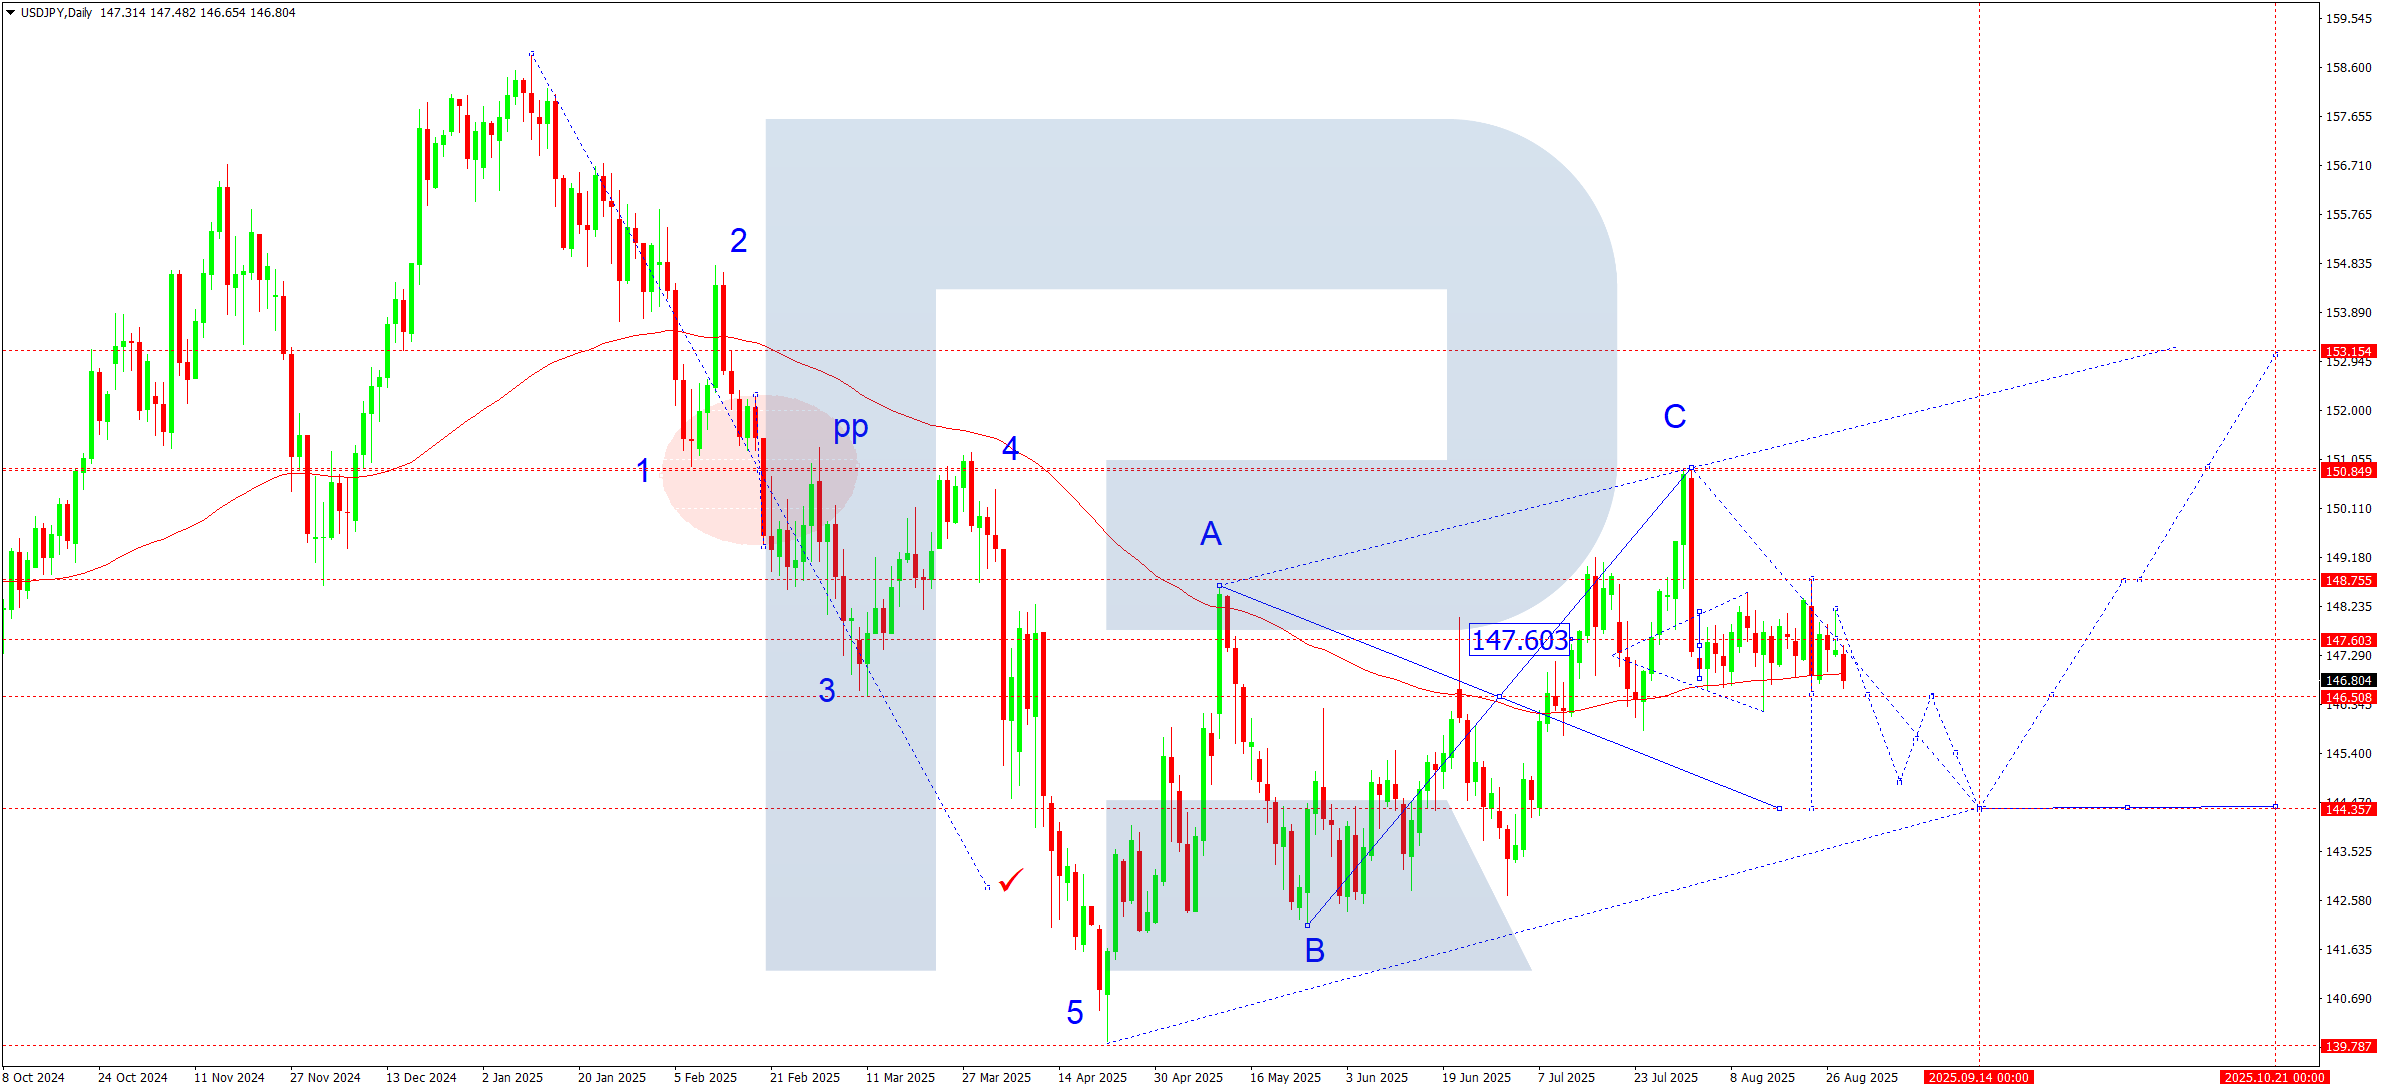
On the daily chart, the USDJPY pair continues to develop a consolidation range around 147.50, which widened down to 146.20 and up to 148.77. The pair could break below the range, aiming for 144.33, with the overall structure seen as a correction. Afterwards, growth towards 148.77 is expected. A breakout upwards will open the potential for a continued movement towards 153.15, supported by the SMA50.
USDJPY forecast scenarios
Bullish (main) scenario:
If the SMA50 holds at 146.50 and the market breaks above 148.00 with growing volumes, another upward wave may develop towards 150.80, with prospects of extending to 153.15.
Bearish (alternative) scenario:
A confident breakout below 146.50, confirmed by growing volumes, could open the way to 144.33.
GBPUSD forecast
The fundamental outlook for the pound remains mixed:
- UK: markets continue to assess the impact of recent inflation data and the Bank of England statements. Rising expectations of policy easing weigh on the pound, while strong labour market figures may offer temporary support
- US: the dollar holds firm on safe-haven demand and ahead of the Federal Reserve meeting. NFP and US Treasury yields will be key drivers for the pair this week
- Additional risk factors include geopolitical events and stock market volatility, which may add swings to the GBPUSD pair
GBPUSD technical analysis
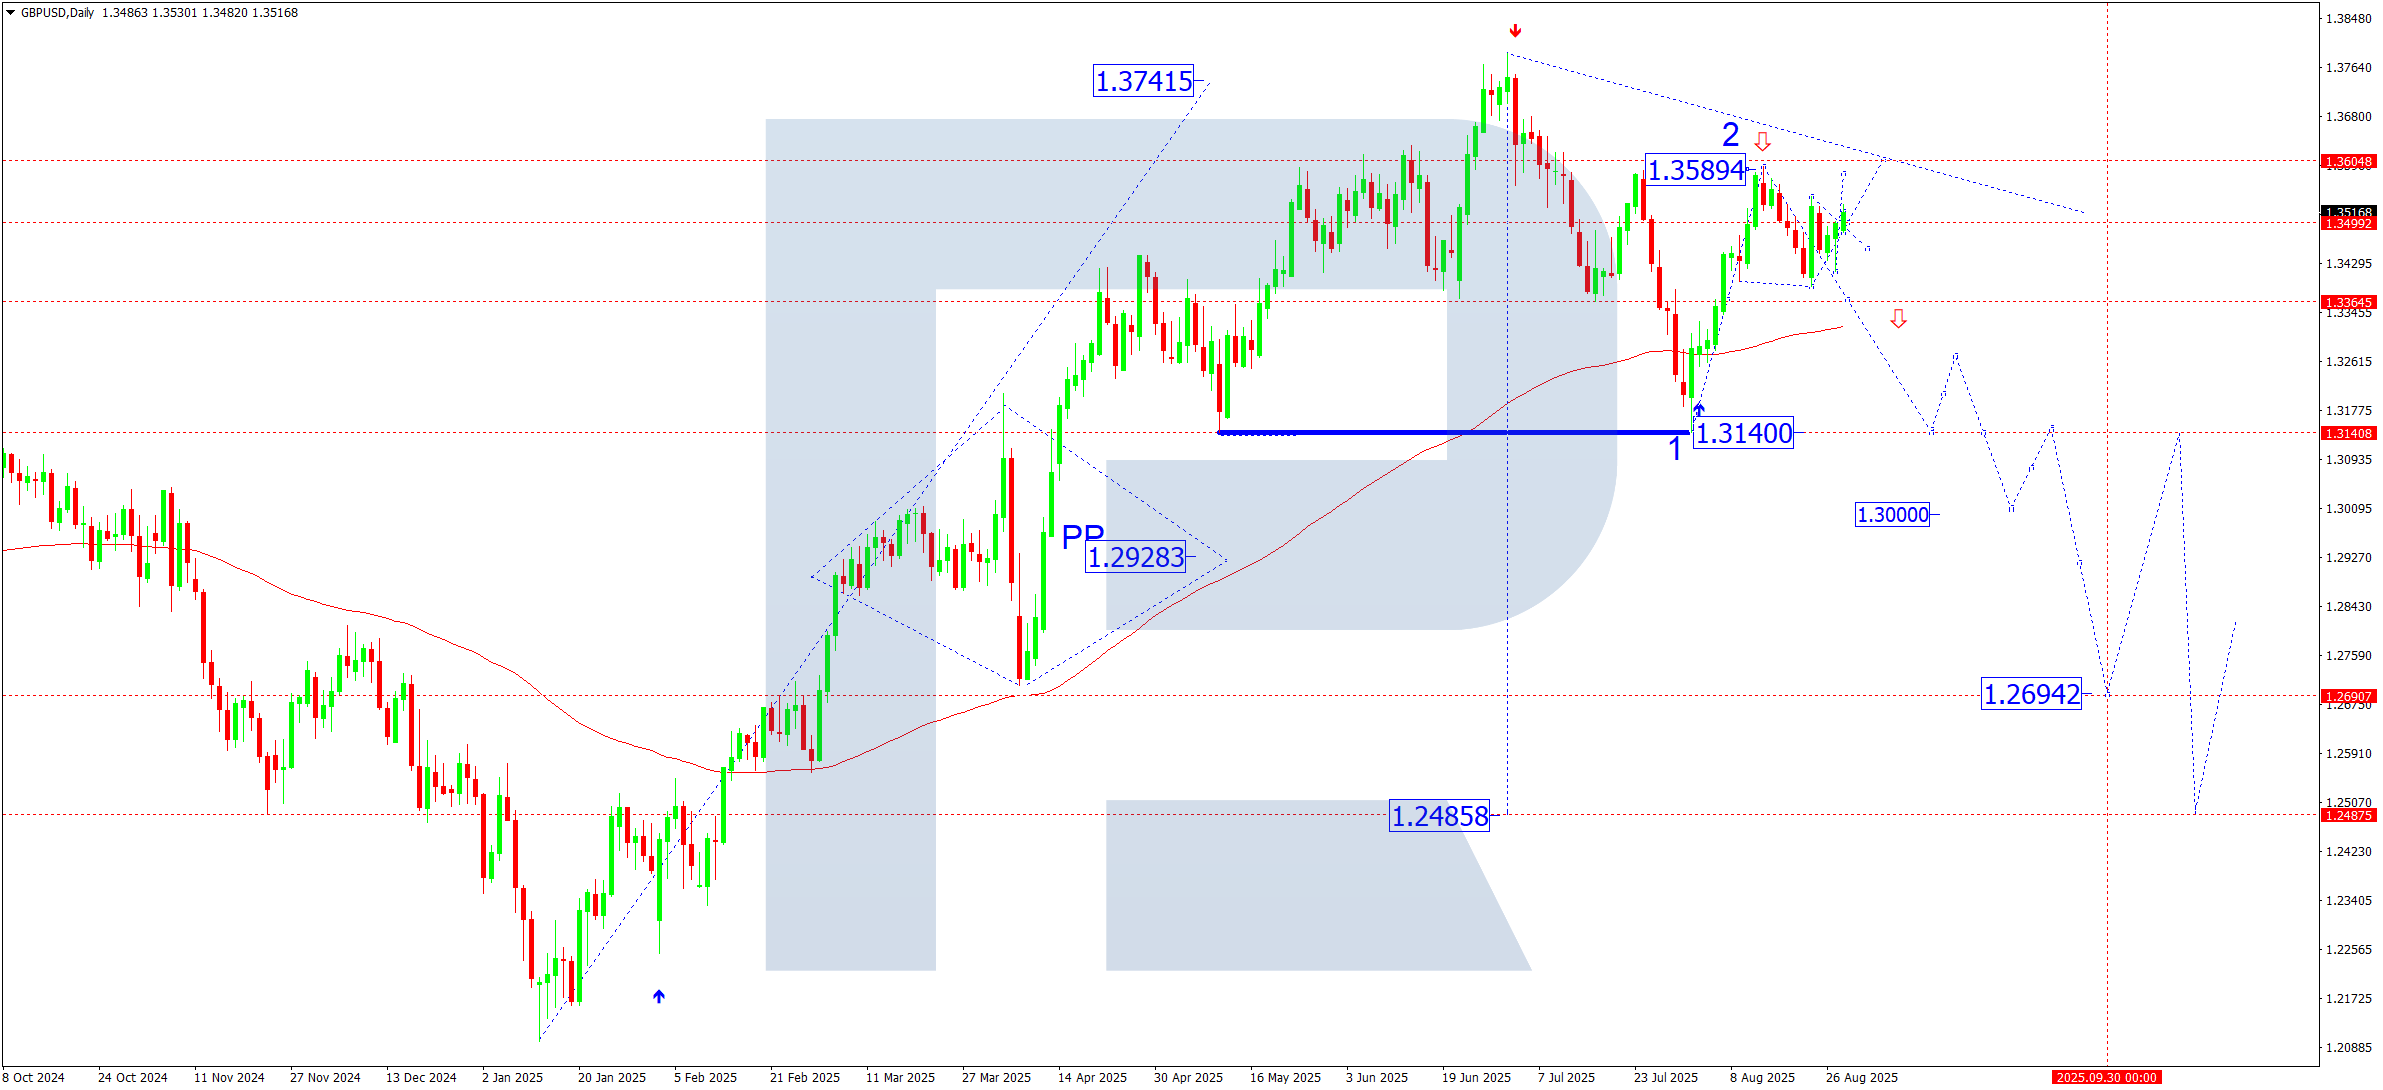
On the daily chart, GBPUSD continues to consolidate around 1.3500. If it breaks upwards, the wave may extend to 1.3600. A downward breakout, however, would target 1.3355, where the SMA50 could provide support and send the pair lower to 1.3477. Further downside would aim for 1.3300, and a breakout lower would open the door for a move towards 1.3140.
GBPUSD forecast scenarios
The bearish (base) scenario suggests a continuation of the third downward wave.
- The first target is at 1.3140
- A breakout would open the path to 1.3000 and further to 1.2695 (key estimated wave target)
Bullish (alternative)scenario: if the market holds above 1.3355 and consolidates above 1.3600, the bullish structure will gain momentum, with potential targets at:
- 1.3660
- 1.3800
- 1.4000
- with strong impulse – up to 1.4160
AUDUSD forecast
Last week, the AUD continued to correct under mixed influences. Domestic data in Australia remains moderately positive, supporting the currency. Meanwhile, a stronger US dollar amid Fed easing expectations puts pressure on the pair, resulting in ongoing consolidation at the top of the growth wave. Commodity market trends, particularly in metals, also play a role in AUD dynamics. In the coming week, investors will focus on Australia’s employment data and potential Fed commentary.
AUDUSD technical analysis
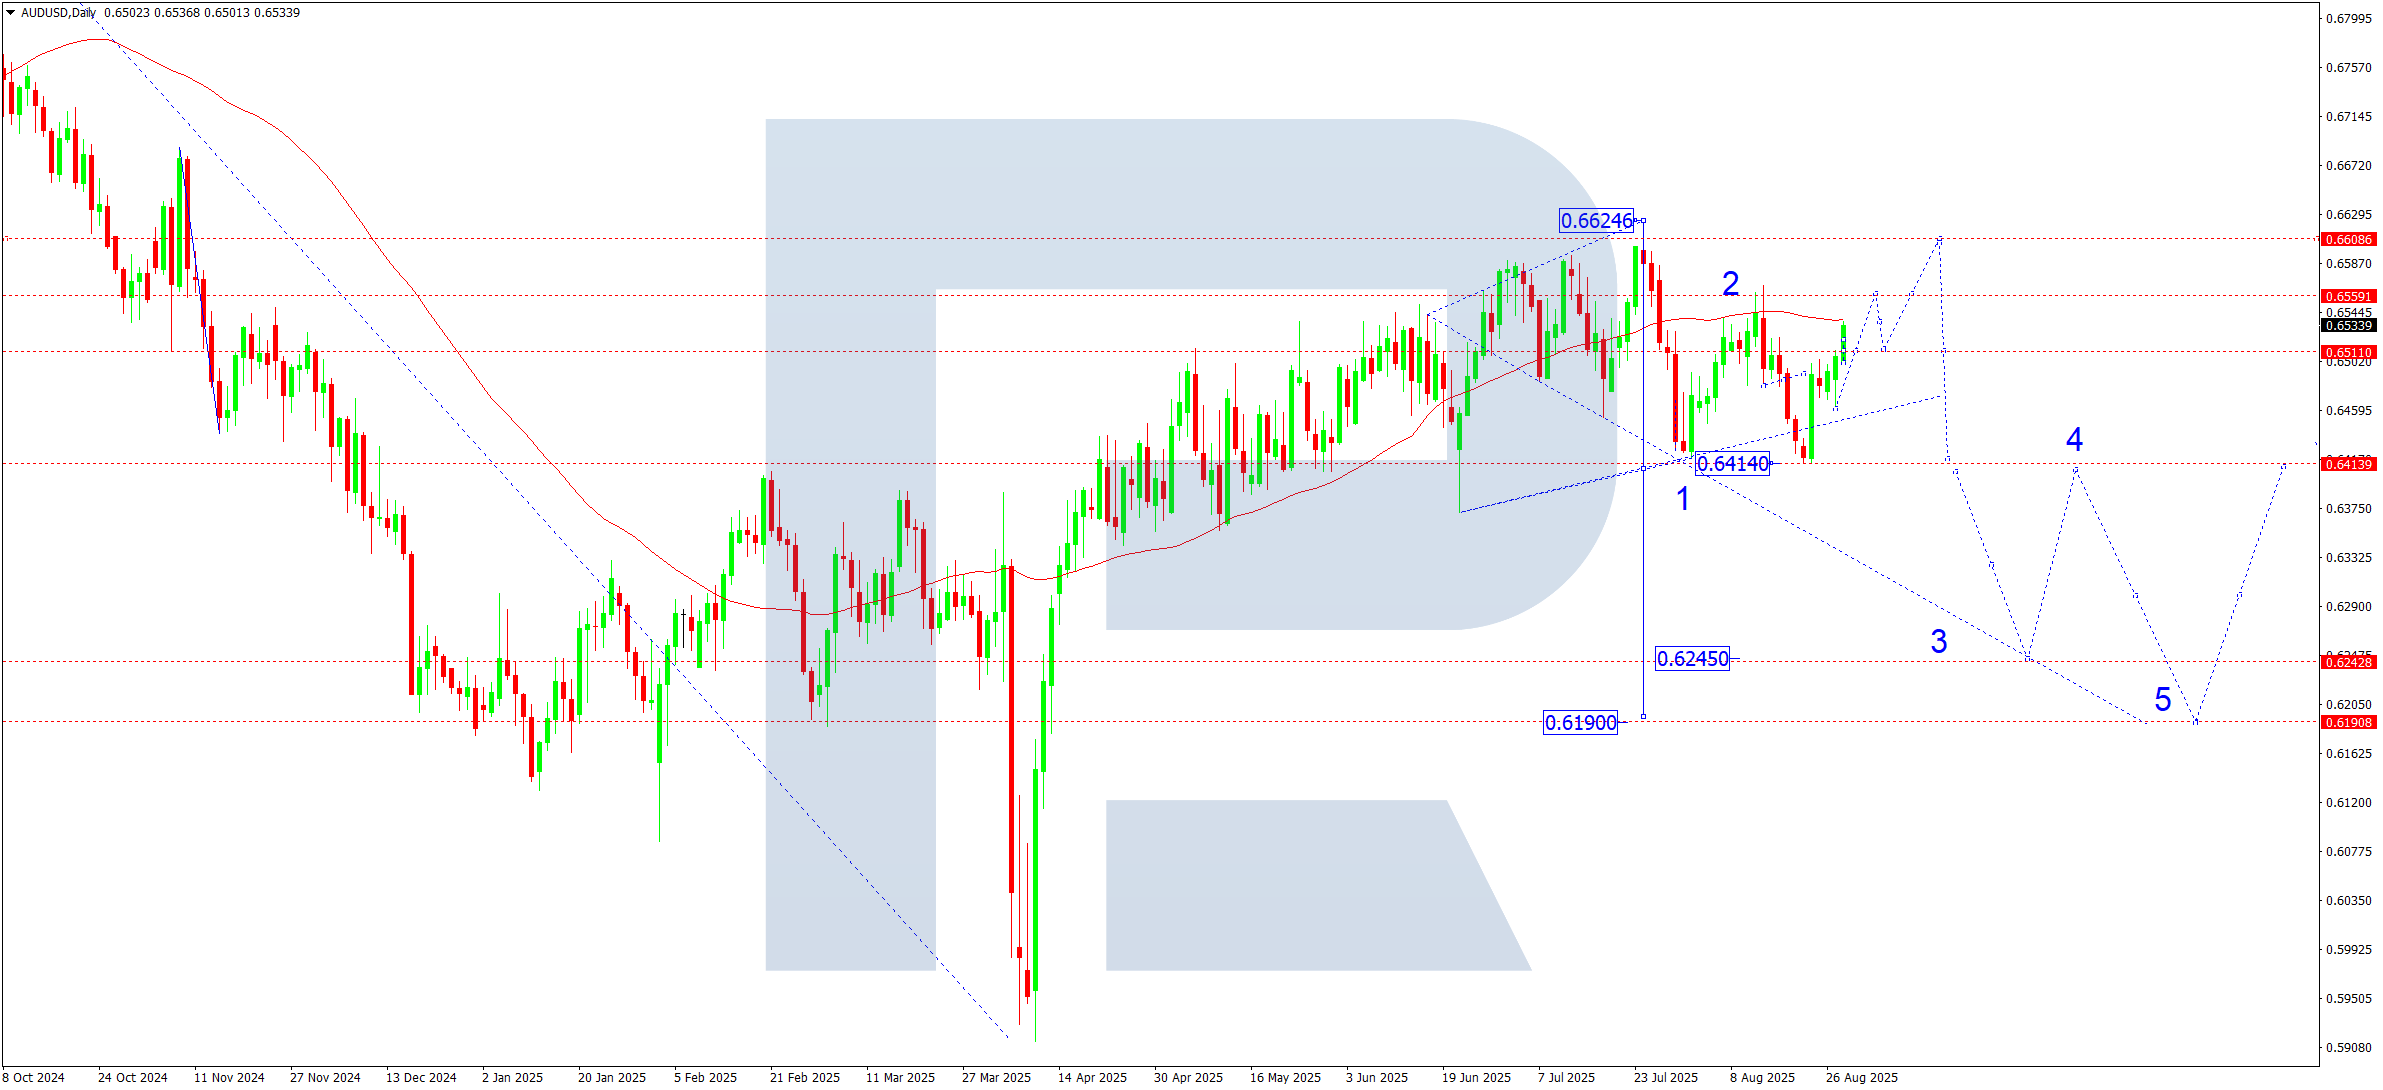
On the daily chart, the AUDUSD pair is consolidating broadly around 0.6500. The market broke above 0.6511, suggesting potential for growth towards the upper boundary of 0.6555-0.6600. Subsequently, a downward move towards 0.6400 remains possible. A breakout lower would open the potential for a trend continuation to 0.6245 as a local target.
AUDUSD forecast scenarios
Bearish (base) scenario:
- 0.6400 – intermediate target (a pivot point for current structure is expected to form)
- 0.6245 – third-wave target
- 0.6190 – main target of the first downward wave
Bullish (alternative) scenario:
Consolidation above 0.6550 may open the way for growth, with potential targets at:
- 0.6820
- 0.6870
- 0.6969 (extended fifth wave)
USDCAD forecast
The US dollar continues to show moderate strength amid diverging macroeconomic data between the US and Canada.
Rising US Treasury yields drive demand for the USD, while stable oil prices limit downside for the CAD, which is traditionally energy-sensitive. The week’s focus will be on US inflation and labour data, along with Bank of Canada decisions.
USDCAD technical analysis
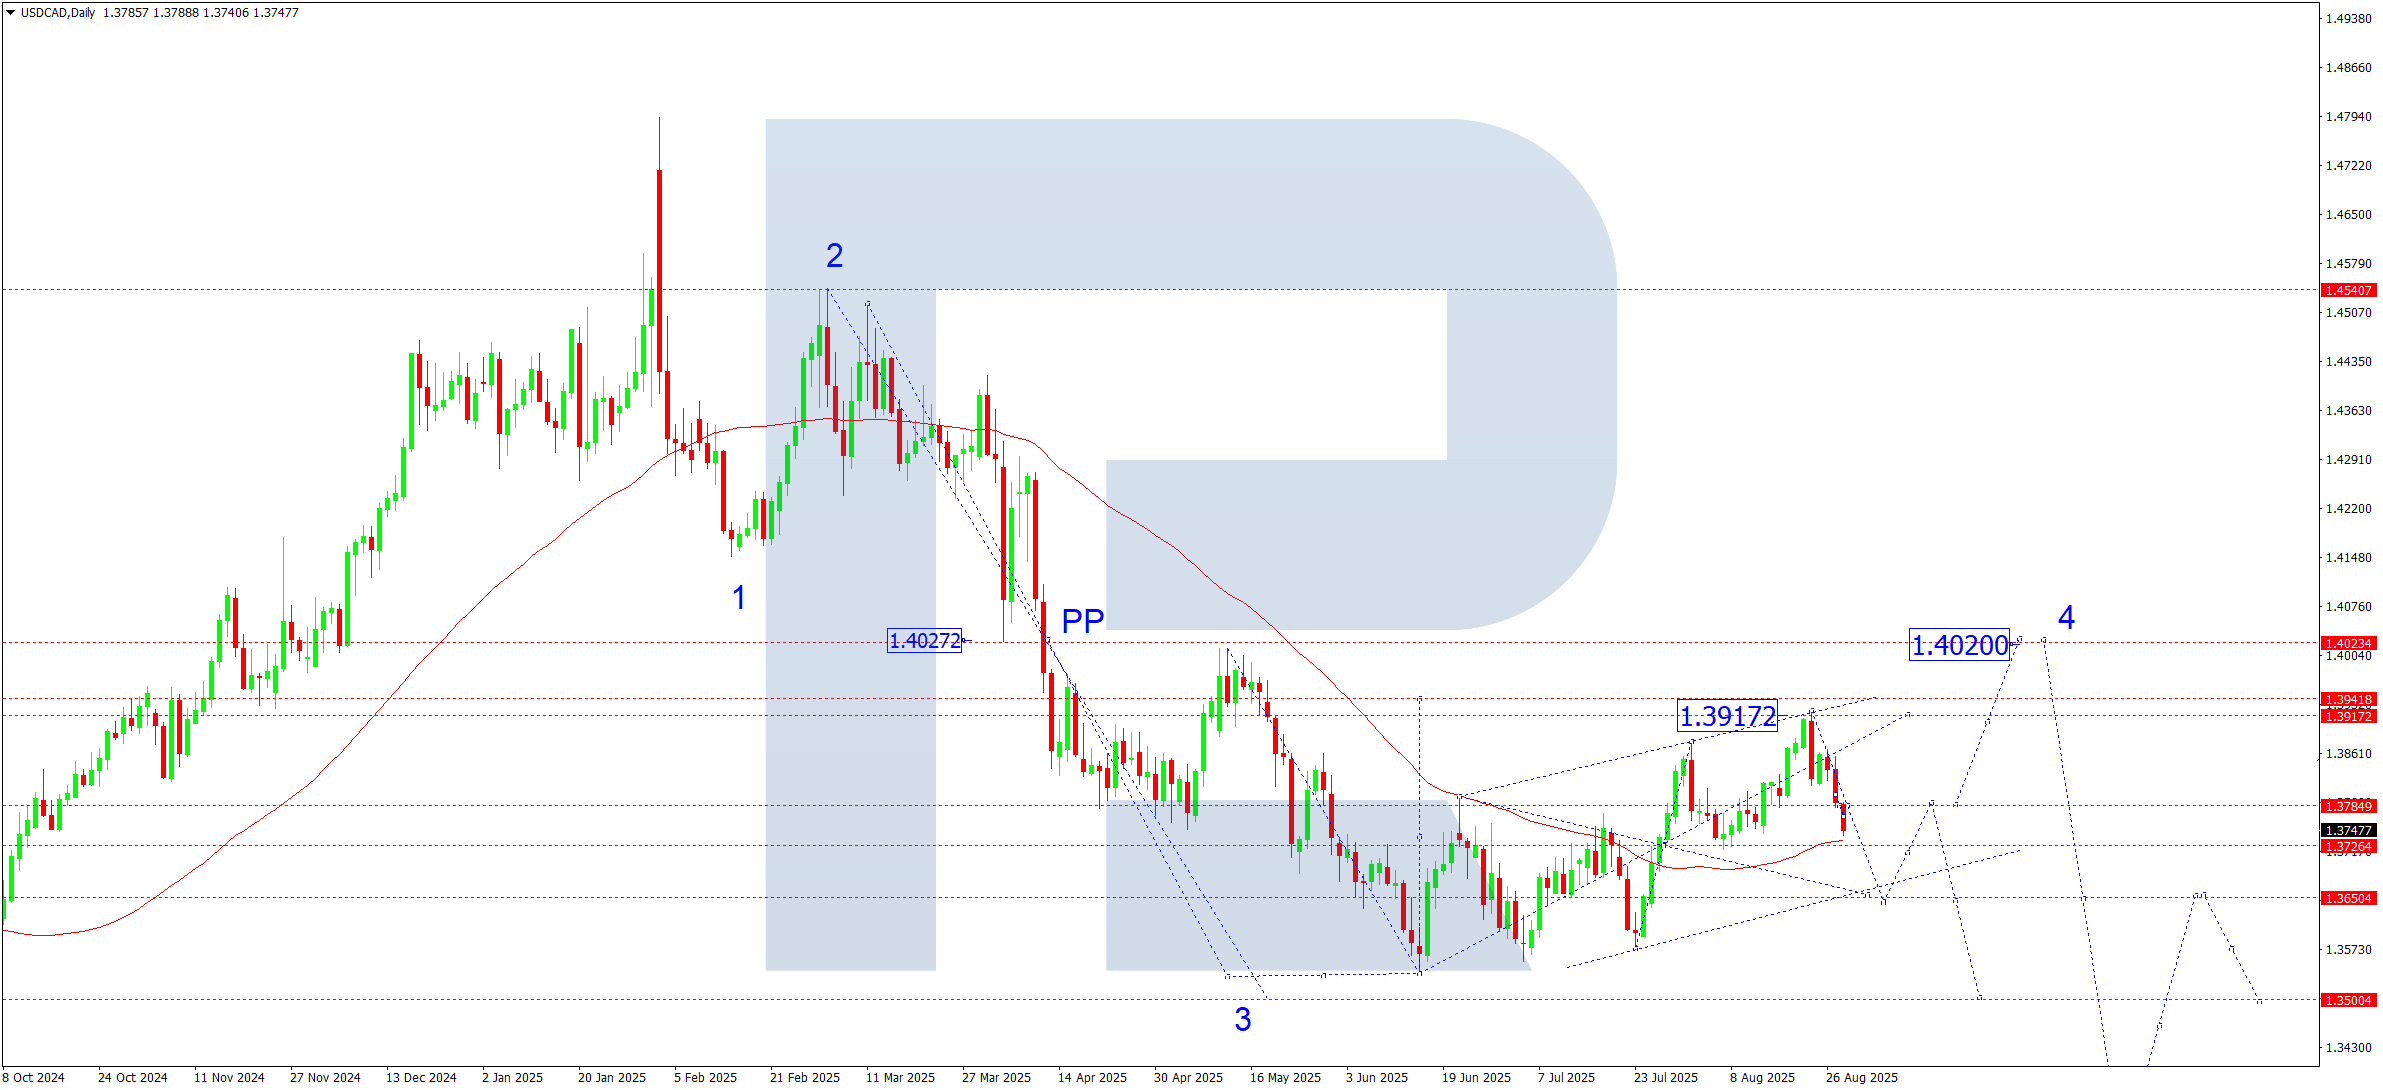
On the daily chart, the USDCAD pair continues its corrective move in the third growth wave, with the target at least at 1.3727 (testing from above – pivot point). At this level, the SMA50 may support a rebound towards 1.3940, the main correction target.
The broader picture stays neutral-bearish: the downtrend is expected to continue towards 1.3500 at minimum, meaning the current structure is corrective within the dominant downtrend.
USDCAD forecast scenarios
Bullish (base) scenario:
Consolidation above 1.3700 and a breakout above 1.3800 open growth potential to 1.3940, the main correction target. After this, the next downside target would be at 1.3500.
Bearish (alternative) scenario:
Completion of the correction near 1.3911 will increase selling pressure, with downside targets at:
- 1.3700
- 1.3600
- 1.3500 (base target of the third wave from 1.4540)
XAUUSD forecast
The gold market remains influenced by geopolitical and macroeconomic uncertainty. Pressure on the USD from soft data and policy easing expectations supports demand for gold as a safe-haven asset. Investors closely watch inflation trends, US labour data, and global geopolitical developments that may drive volatility.
XAUUSD technical analysis
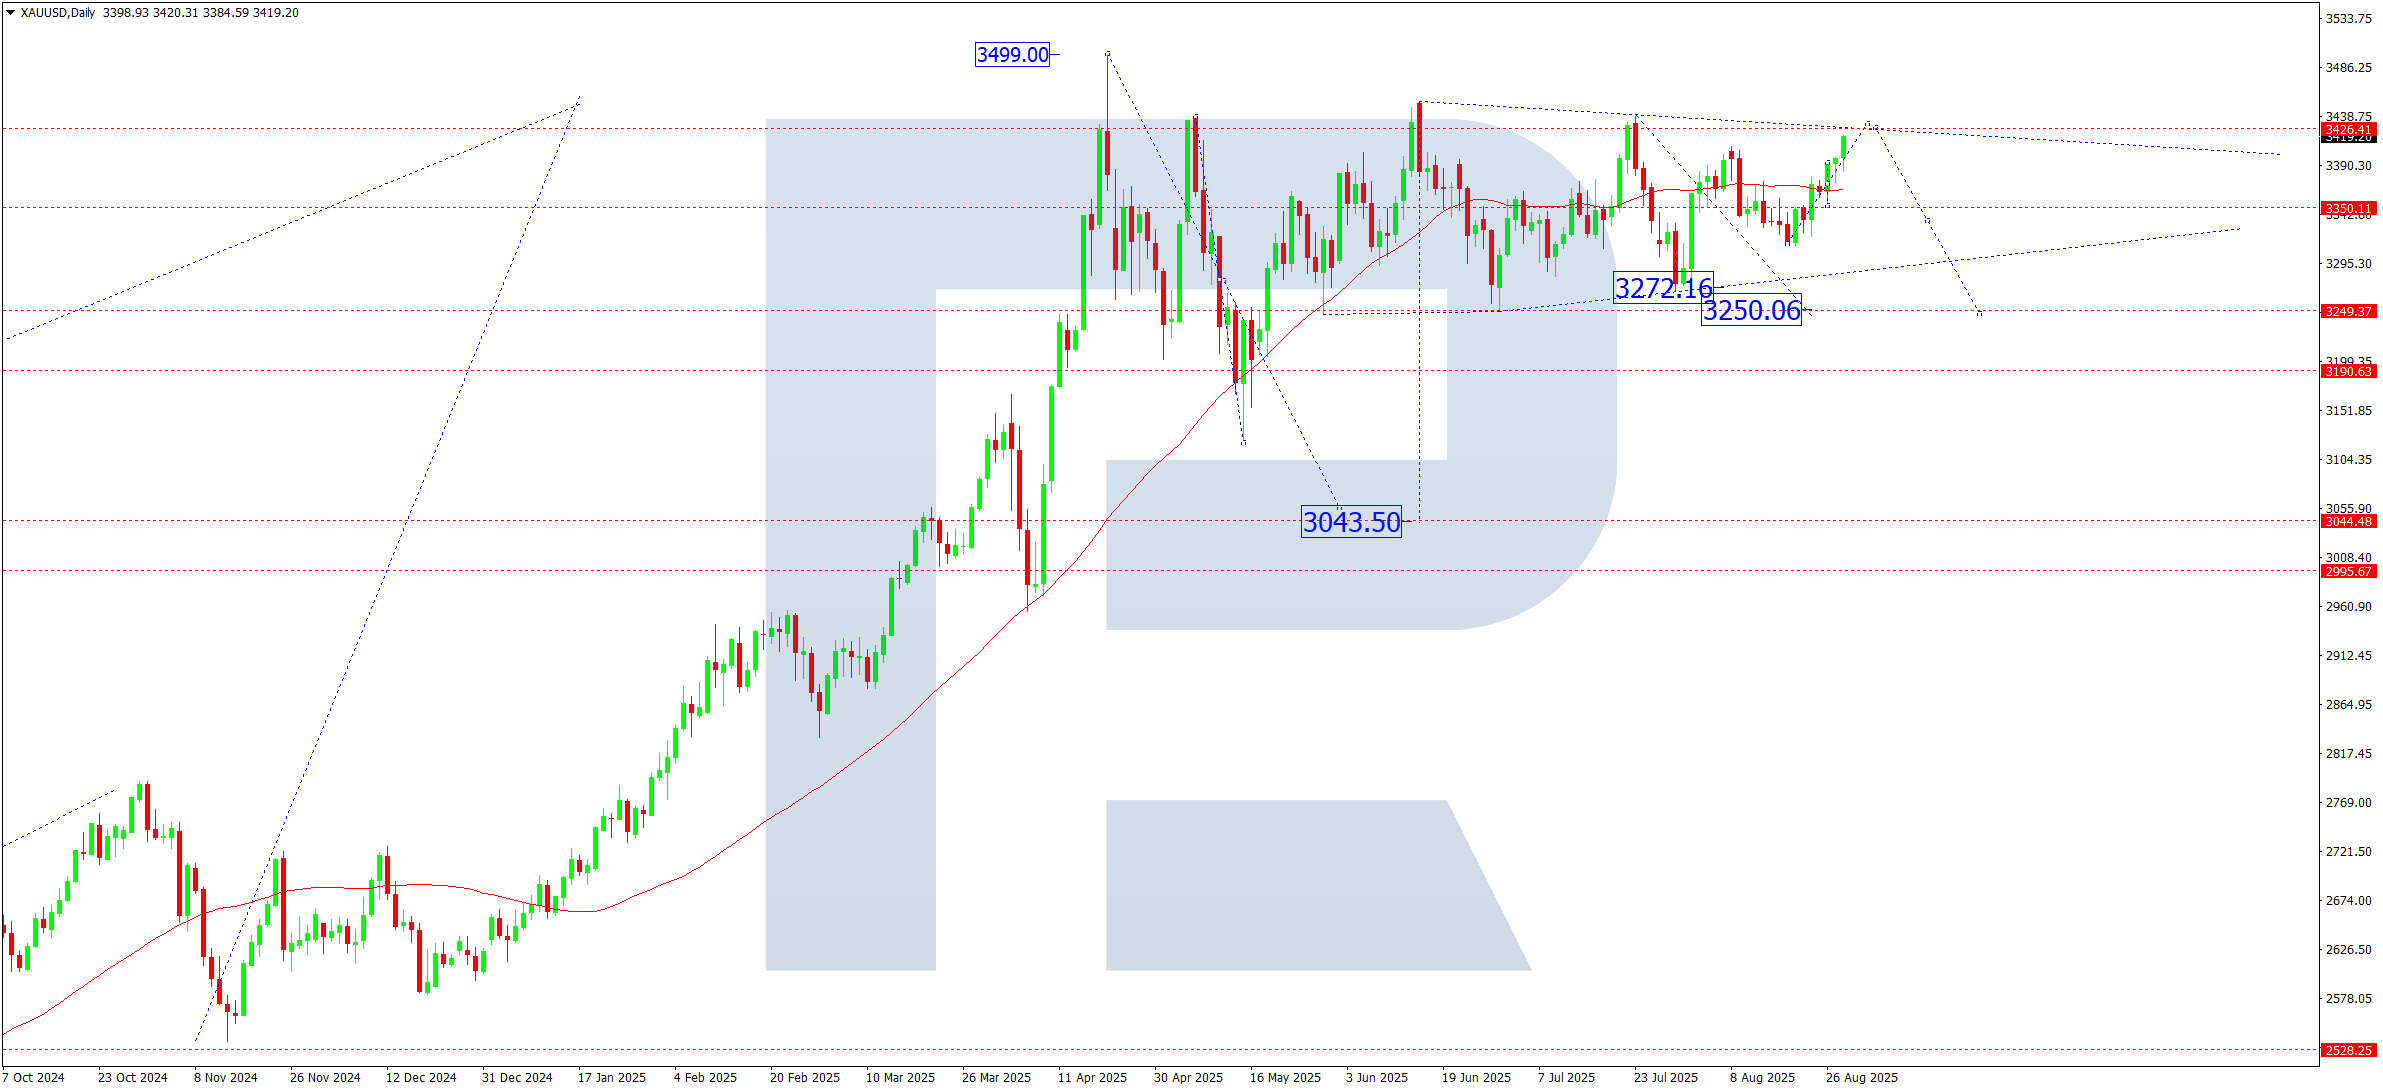
On the daily chart, gold found support at 3,373, where the SMA50 also lies. Next week, the upward wave is expected to continue towards the upper boundary of the consolidation range at 3,433. A breakout higher would extend growth to 3,474. Currently, the structure forms a symmetrical triangle top, often a signal of an upcoming major correction.
XAUUSD forecast scenarios
Bearish (base) scenario: a breakout and consolidation below 3,370 will trigger a downward wave, with targets at:
- 3,250 – intermediate support
- 3,050-3,040 – technical and fundamental correction zone (main target)
Bullish (alternative) scenario: a firm consolidation above 3,440 would open the door for further growth, with targets at:
- 3,500 – key May resistance level
- 3,535 – potential top of the extended fifth wave
Brent forecast
The Brent oil market remains sensitive to stockpile dynamics, geopolitical risks, and OPEC+ actions. The balance between supply and demand continues, creating volatility potential within the current range. Near-term trends will be shaped by stock data and global economic indicators.
Brent technical analysis
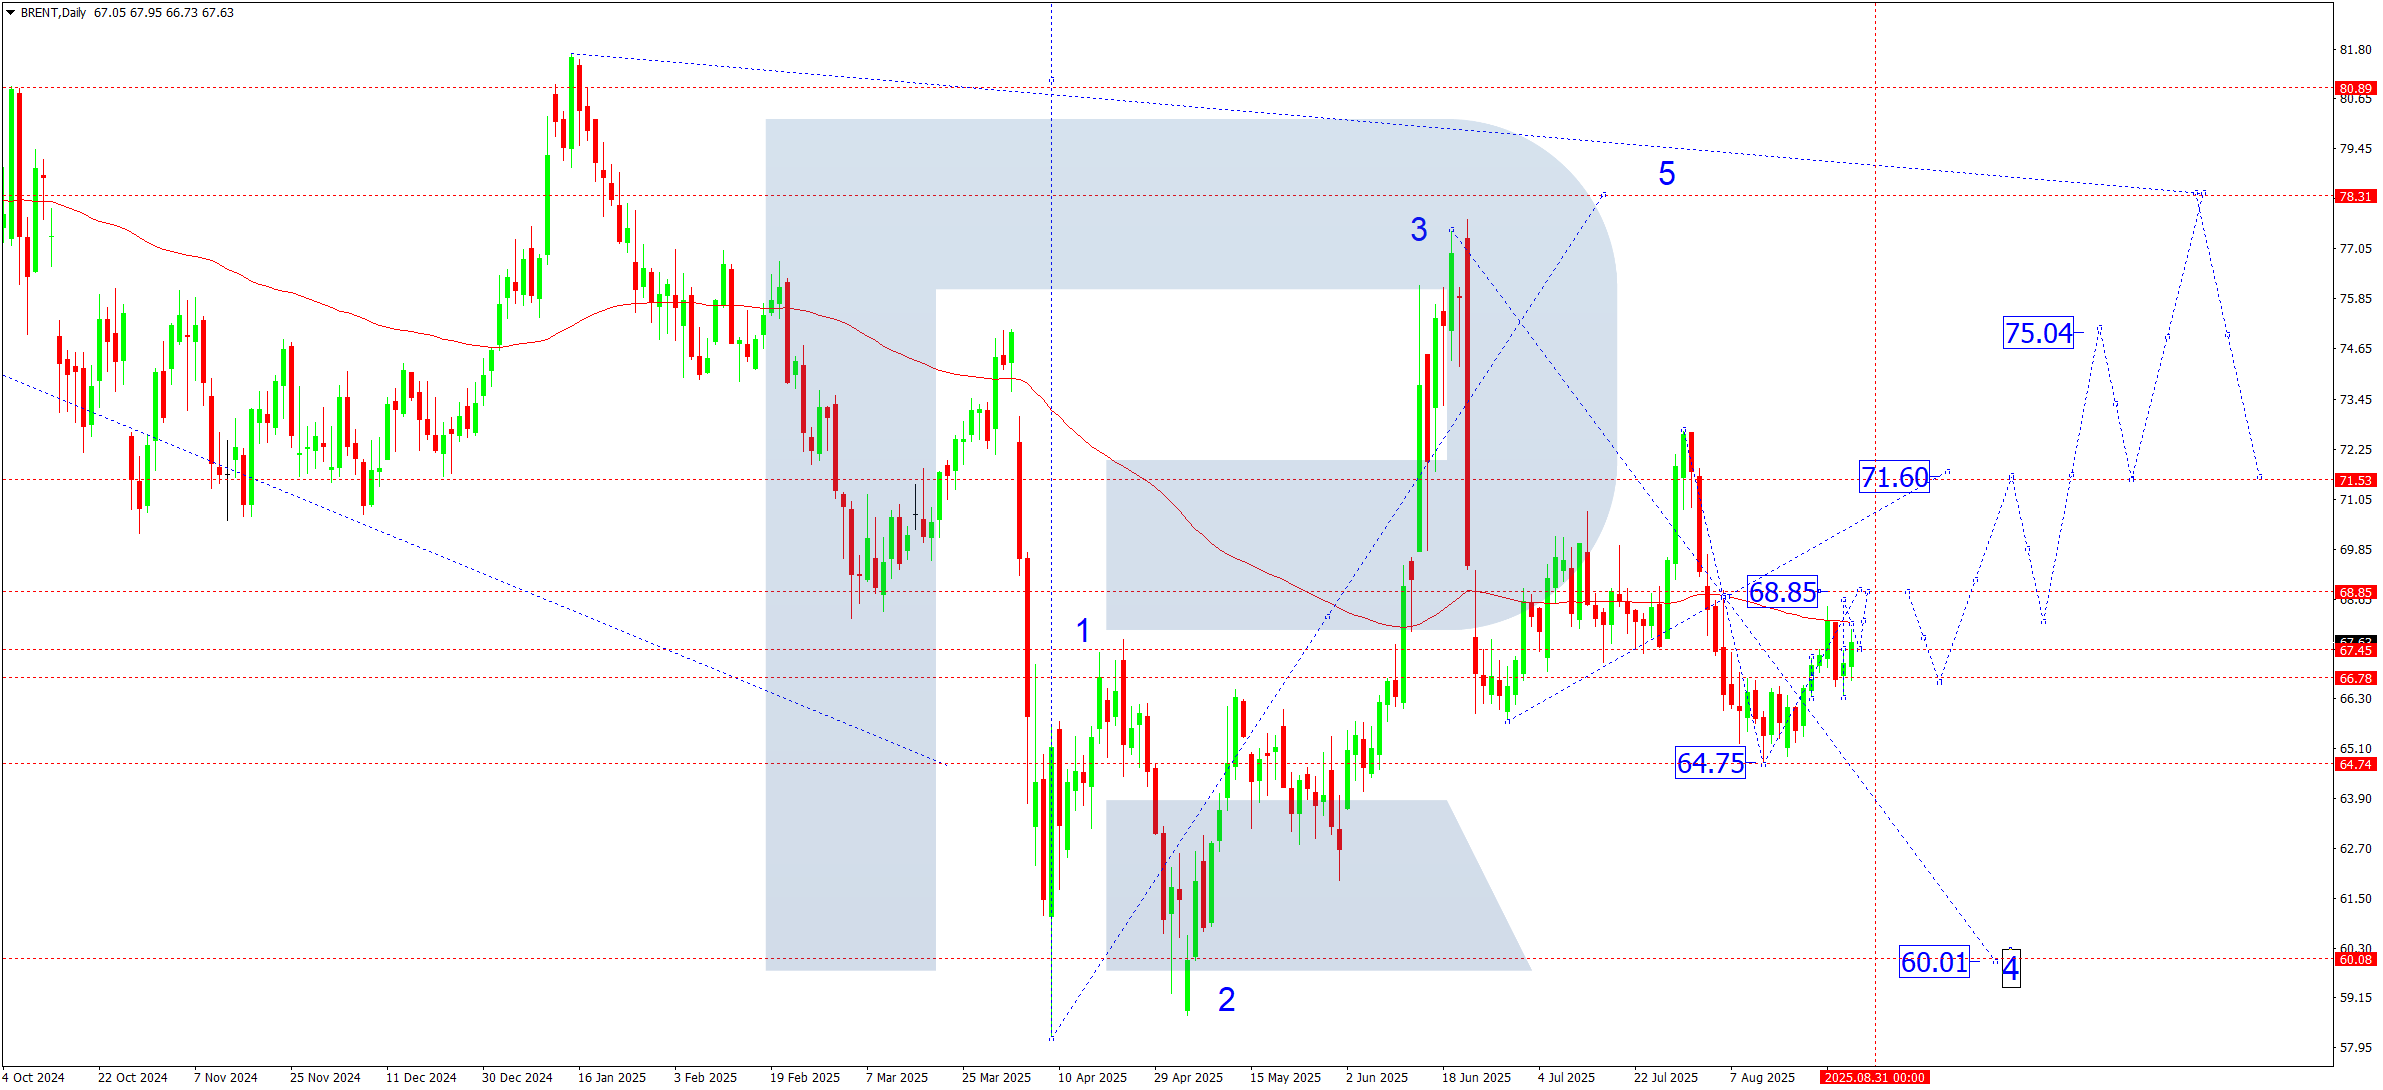
On the daily chart, Brent corrected towards 66.35 and found support, forming a growth wave structure towards 68.88. After reaching this level, a correction down to 66.66 is possible, followed by growth towards the key 71.60 level. From this level, a downward move towards 66.60 may occur, forming a broad consolidation range. A downward breakout could extend declines to 60.00. Subsequently, a new growth wave towards 75.00 is expected, with trend potential up to 78.30 (first target). If the 66.66 support level holds, another growth structure may form, aiming for 71.60.
Brent forecast scenarios
Bullish (base) scenario: a breakout above 66.60 confirmed trend resumption, with growth targets at:
- 71.60 – first target
- 68.88 – possible correction zone
- 75.00 – local target
- 78.30 – main fifth-wave target
Bearish (alternative) scenario: a breakout below 64.00 and consolidation lower will increase pressure, with the target at:
- 60.00 – key support level
Forecasts presented in this section only reflect the author’s private opinion and should not be considered as guidance for trading. RoboForex bears no responsibility for trading results based on trading recommendations described in these analytical reviews.