Weekly technical analysis and forecast (11-15 August 2025)
This weekly technical analysis highlights the key chart patterns and levels for EURUSD, USDJPY, GBPUSD, AUDUSD, USDCAD, gold (XAUUSD), and Brent crude oil to forecast market moves for the upcoming week (11-15 August 2025).
Major technical levels to watch this week
- EURUSD: Support: 1.1580, 1.1525. Resistance: 1.1680, 1.1750
- USDJPY: Support: 146.50, 145.55. Resistance: 149.35, 151.00
- GBPUSD: Support: 1.3255, 1.3200. Resistance: 1.3434, 1.3585
- AUDUSD: Support: 0.6400, 0.6277. Resistance: 0.6550, 0.6670
- USDCAD: Support: 1.3715, 1.3660. Resistance: 1.3800, 1.3900
- Gold: Support: 3,320, 3,250. Resistance: 3,385, 3,440
- Brent: Support: 68.60, 66.50. Resistance: 72.60, 76.50
EURUSD forecast
While the market remains cautiously optimistic about the euro, pressure from the US dollar persists. The dollar receives support from:
- expectations of continued tight Fed monetary policy
- steady US macroeconomic data
- rising US government bond yields
Meanwhile, the euro remains under pressure from weak economic reports from Germany and uncertainty over the ECB’s next steps. Under these conditions, the EURUSD pair stays pressured despite short-term upward corrections.
EURUSD technical analysis
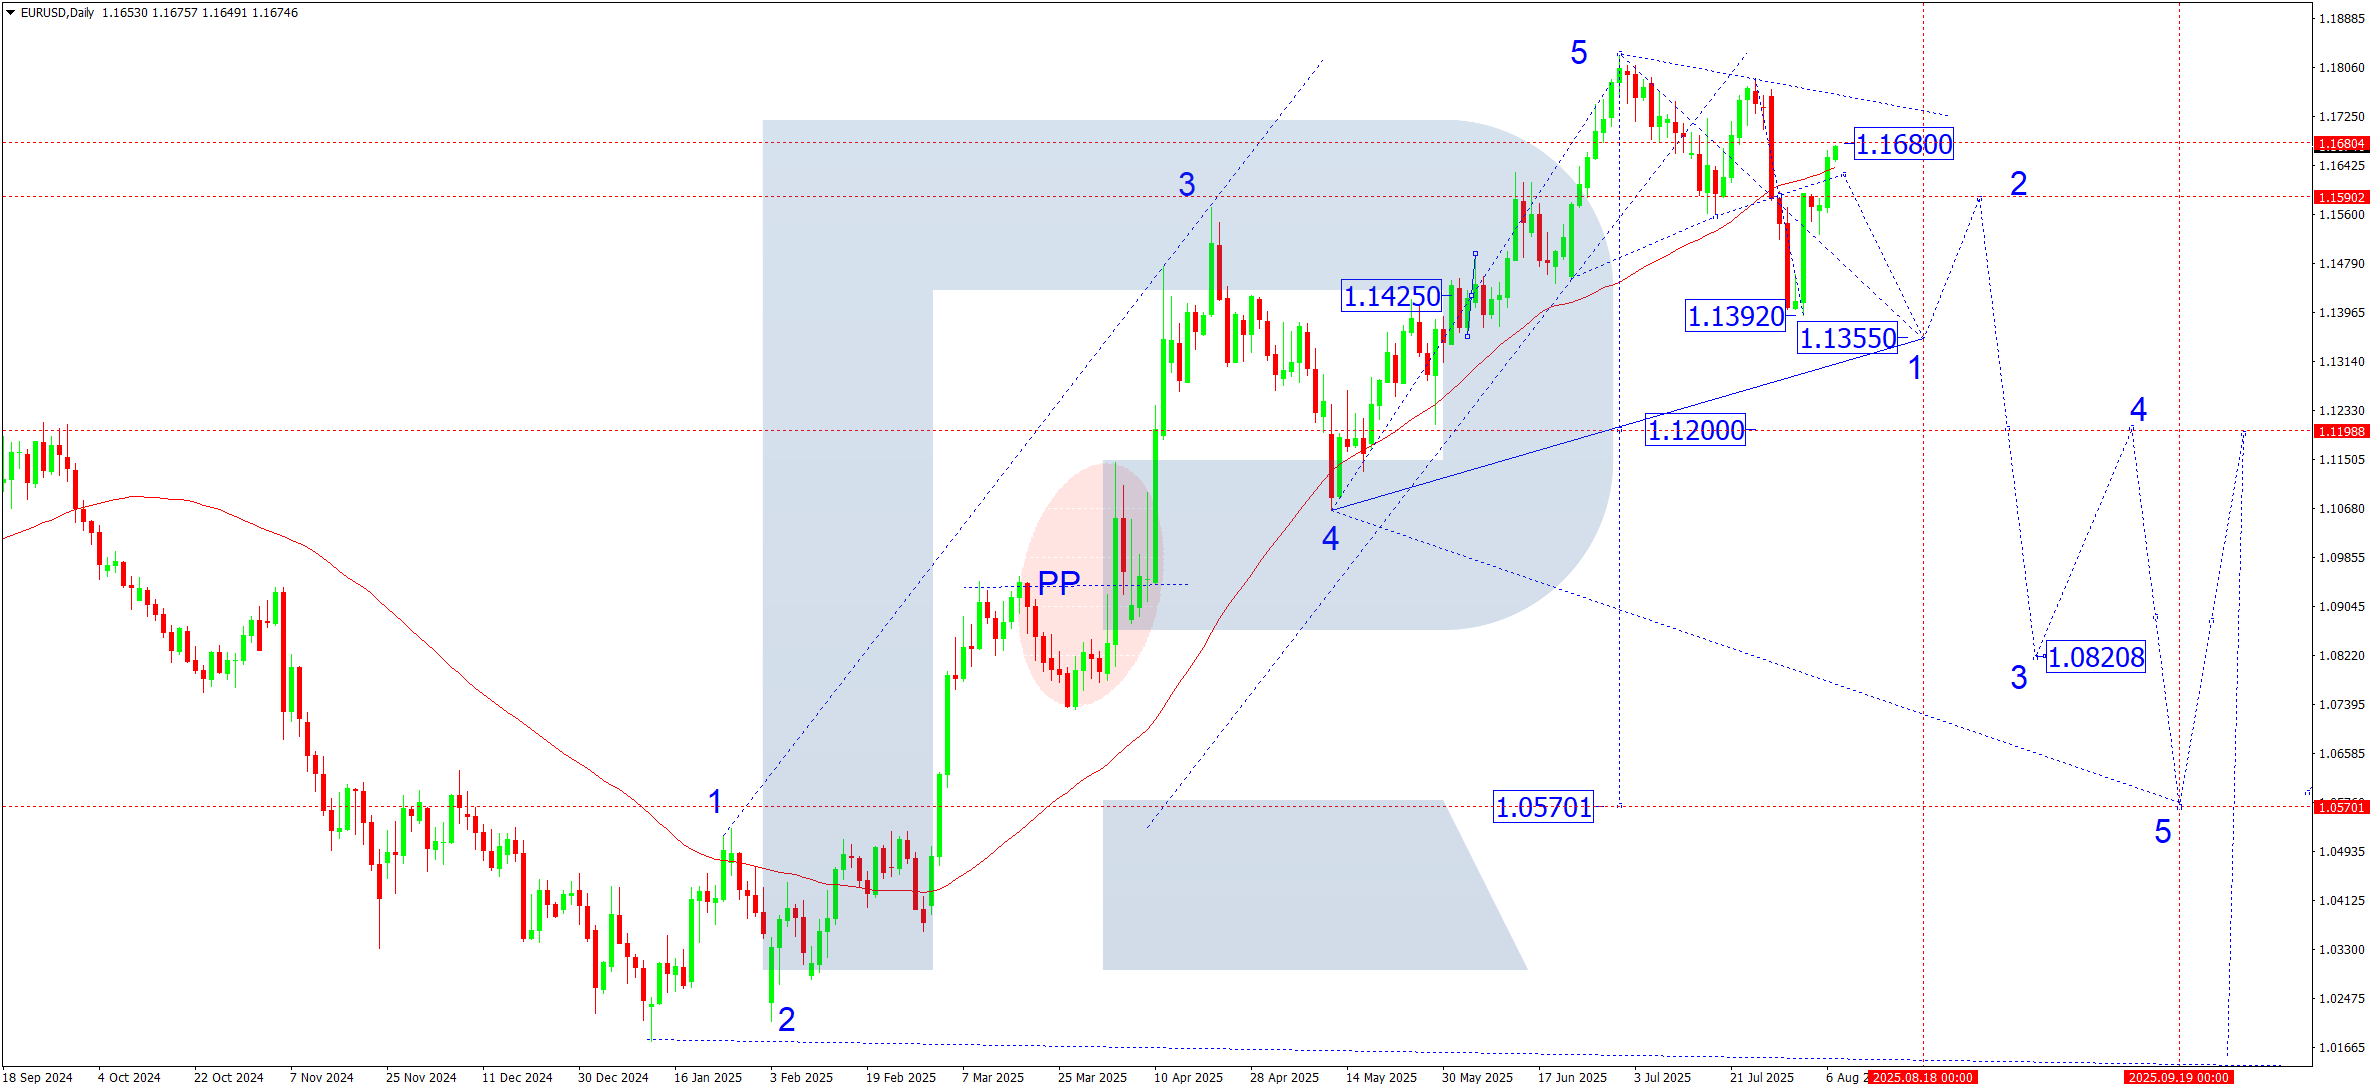
On the daily chart, the EURUSD pair formed a consolidation range below 1.1590 and, breaking upwards, tested the 1.1680 level. This move can be viewed as a corrective wave capped by SMA50 resistance, from which the price bounced down.
Next week is expected to see the completion of the corrective structure and the formation of a new downward wave with the nearest target at 1.1525. A breakout below this support level would open the way to a deeper correction towards 1.1355 as the first target. After reaching this zone, a rebound towards 1.1590 is possible – second target.
EURUSD forecast scenarios
Bearish scenario (base):
The upward correction is expected to be completed.
- Priority is a decline to 1.1525, then to 1.1355
- If these levels are reached, a technical rebound to 1.1590 is possible
Bullish scenario (alternative):
- If the pair forms a consolidation range above 1.1590 and breaks above 1.1680, growth towards 1.1750 is possible, and with further momentum, to 1.1830.
USDJPY forecast
Last week, the USDJPY pair corrected within the previously formed upward move. The dollar remains supported by the Fed’s hawkish stance, while the yen is pressured by the Bank of Japan’s dovish policy and persistent yield gap. However, seasonal activity and potential verbal interventions from Japanese authorities may have a short-term impact on the pair’s dynamics.
USDJPY technical analysis
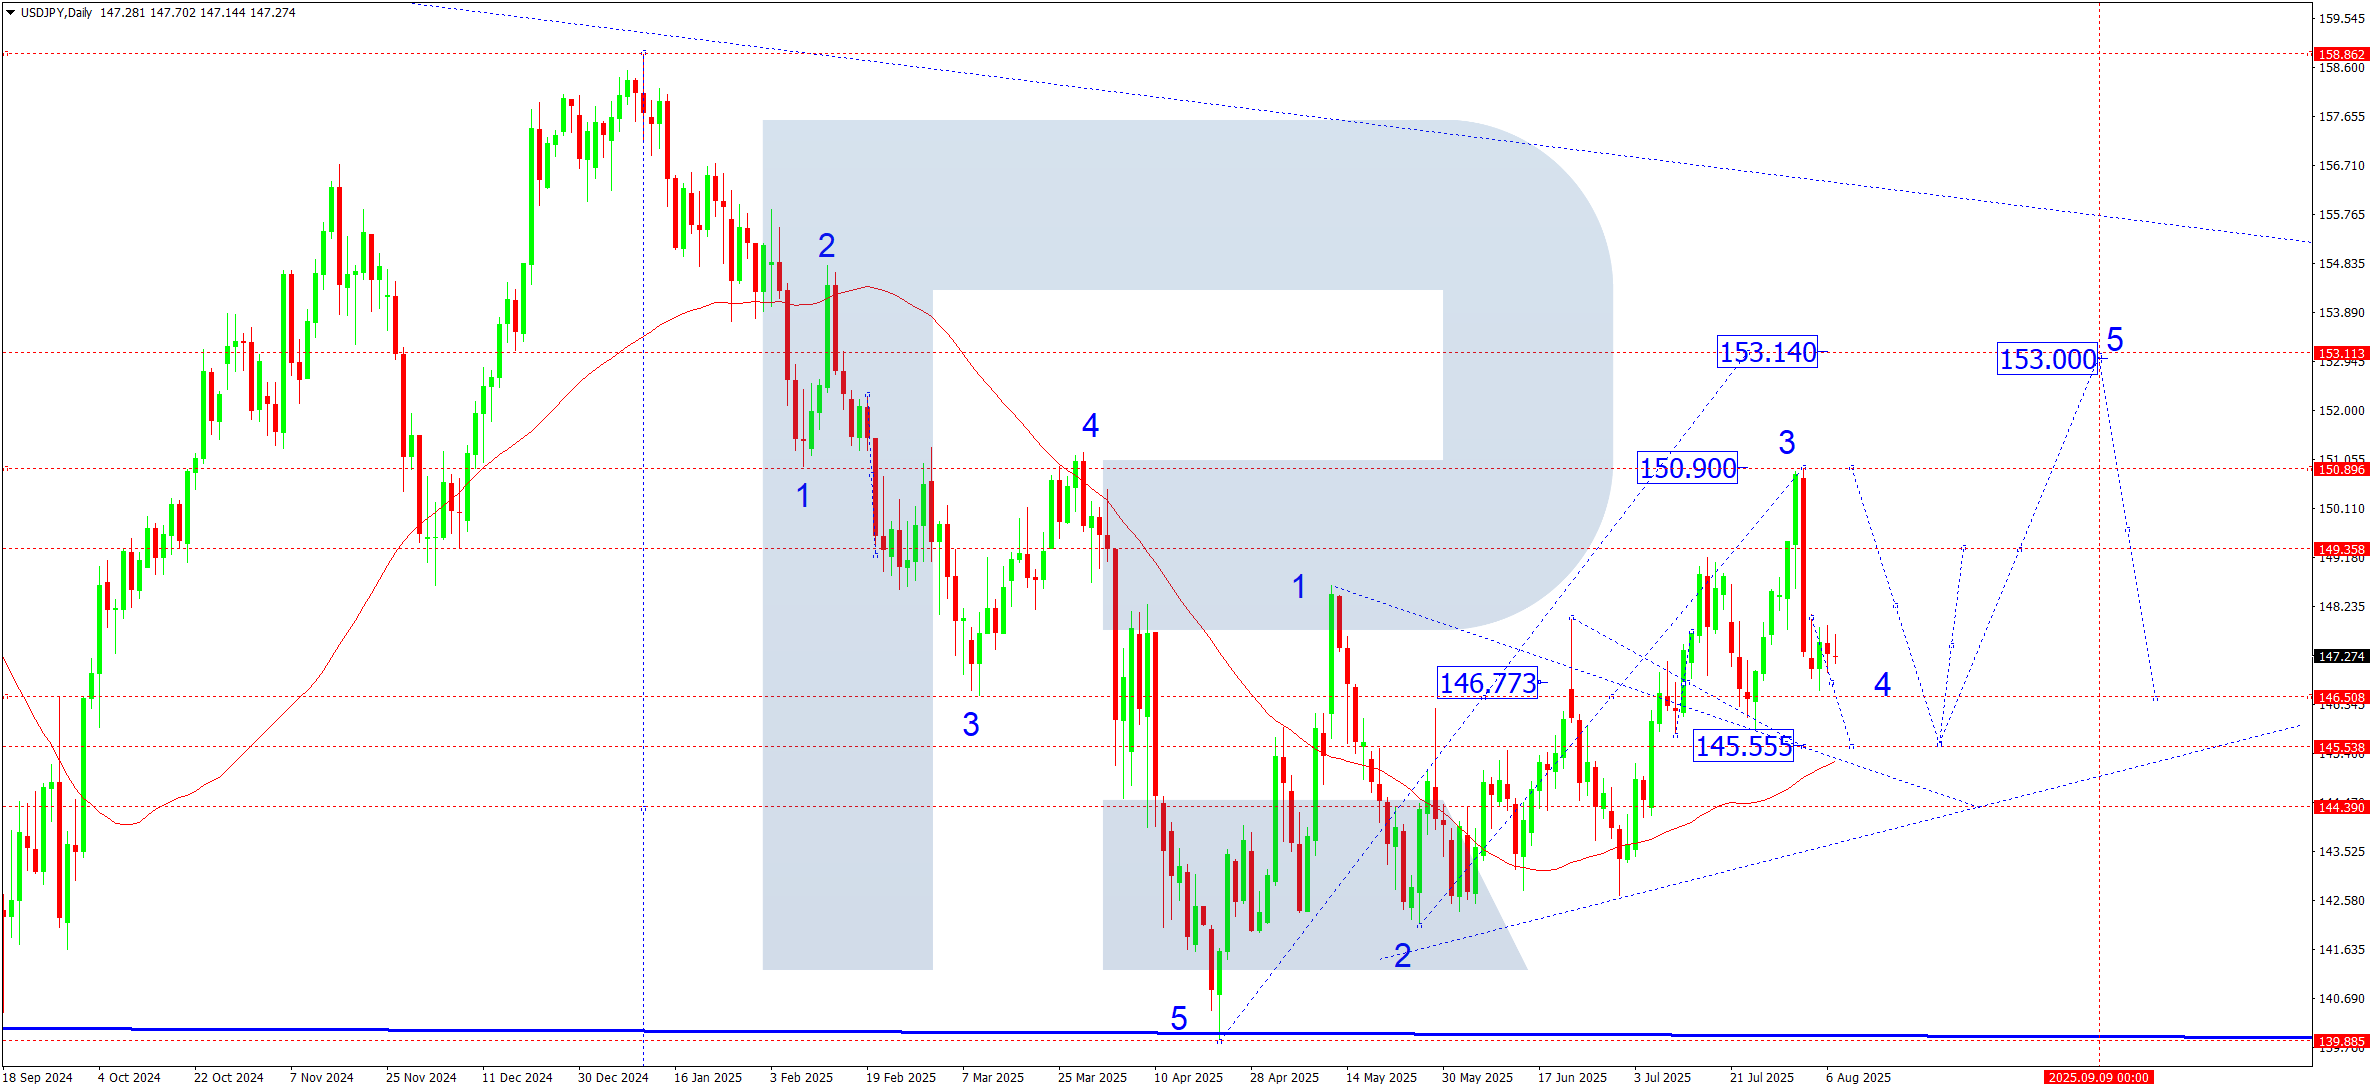
On the daily chart, a corrective wave was completed in the 146.44 area, followed by the formation of a consolidation range above this mark. From current levels, an upward breakout from the range and continuation of the bullish impulse appears possible.
A breakout above the 148.00 resistance level would open the potential for the fifth growth wave targeting 153.00, preliminarily via 151.00. Support in case of correction lies at 146.50 and 145.55, where the SMA50 also passes.
A breakout below 144.40 could activate a bearish scenario towards 142.50 and 140.00.
USDJPY forecast scenarios
Bullish scenario (main):
Completion of correction around 145.55;
Growth towards 149.35, and with consolidation above it, movement could continue towards 151.00 and 153.00.
Bearish scenario (alternative):
A confident breakout below the 144.40 level with increased volumes would open the potential for a decline to 142.50, and if pressure continues – to 140.00.
GBPUSD forecast
The Bank of England cut its key rate to 4%, the fifth cut this year, marking the lowest level since March 2023. The decision was split, with a 5:4 vote indicating increased inflation risks and imbalance in the board. Meanwhile, the economy shows signs of cooling: GDP is falling, inflation remains above target.
UK inflation in June stood at 3.6%, up from 3.4% in May. The inflation peak is expected at 4% in September before easing begins. Economic growth forecast: Q2 showed only +0.1% GDP growth, and experts expect a slow recovery. The 2025 growth forecast is 1.1-1.2%, above most EU countries, but accompanied by slowing industrial activity and rising unemployment. The market now balances between pressure on the pound from weaker fundamentals (rising inflation, weak GDP) and attempts to support the currency through future rate cuts. Signals from the Bank of England and upcoming inflation and GDP data will be crucial for the pair’s next trend.
GBPUSD technical analysis
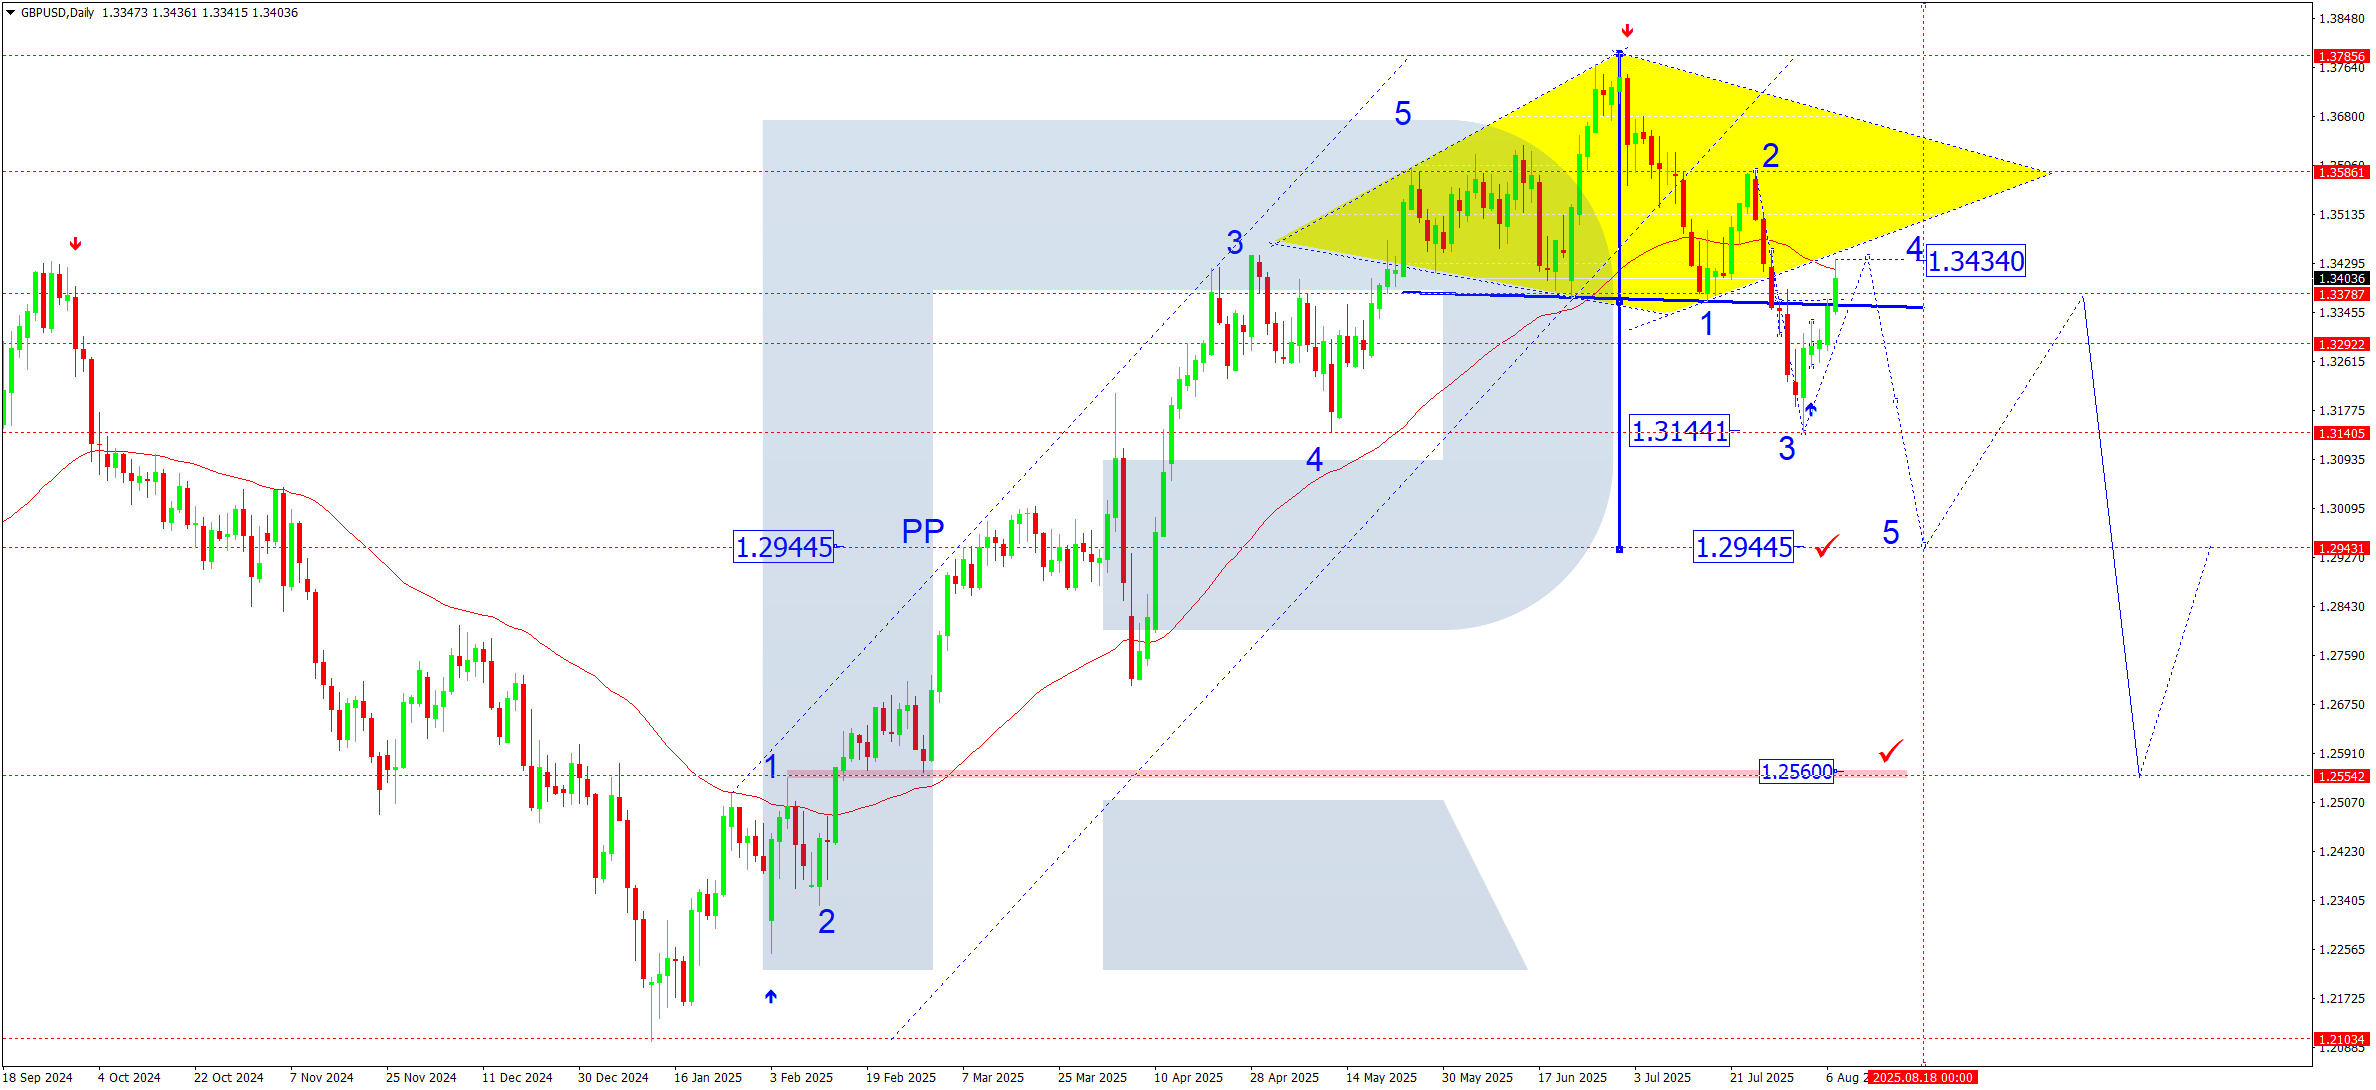
On the daily chart, the GBPUSD pair broke upwards from the consolidation range around 1.3292 and tested 1.3434, completing the corrective move. Next week is expected to see a decline to 1.3255. A breakout of this level will open the way to 1.3200 and then to 1.2944.
Trading below the SMA50 confirms the bearish bias. Only a steady move above 1.3580 followed by a breakout above 1.3600 would cancel the bearish scenario and return the market to growth towards 1.3800-1.4000.
GBPUSD forecast scenarios
Bearish scenario (base):
- Completion of the 4th wave near 1.3434
- Development of the 5th wave targeting 1.2944
Bullish scenario (alternative):
- Consolidation above 1.3600 will trigger growth to 1.3660, 1.3800, and 1.4000
- With strong momentum, a spike to 1.4160 is possible
AUDUSD forecast
The Reserve Bank of Australia (RBA) kept rates at 4.35% in August and announced a pause in the hiking cycle, citing slowing inflation and signs of a cooling labour market. However, the statement stressed that “inflation risks remain elevated,” limiting the potential for significant AUD strengthening.
The US side benefits from steady Fed rate expectations and persistently high Treasury yields, supporting the dollar and pressuring the AUDUSD pair. Australia’s retail sales report showed a 0.4% decline in June (worse than the 0.1% forecast), increasing pressure on the Aussie amid expectations of slower economic growth.
AUDUSD technical analysis
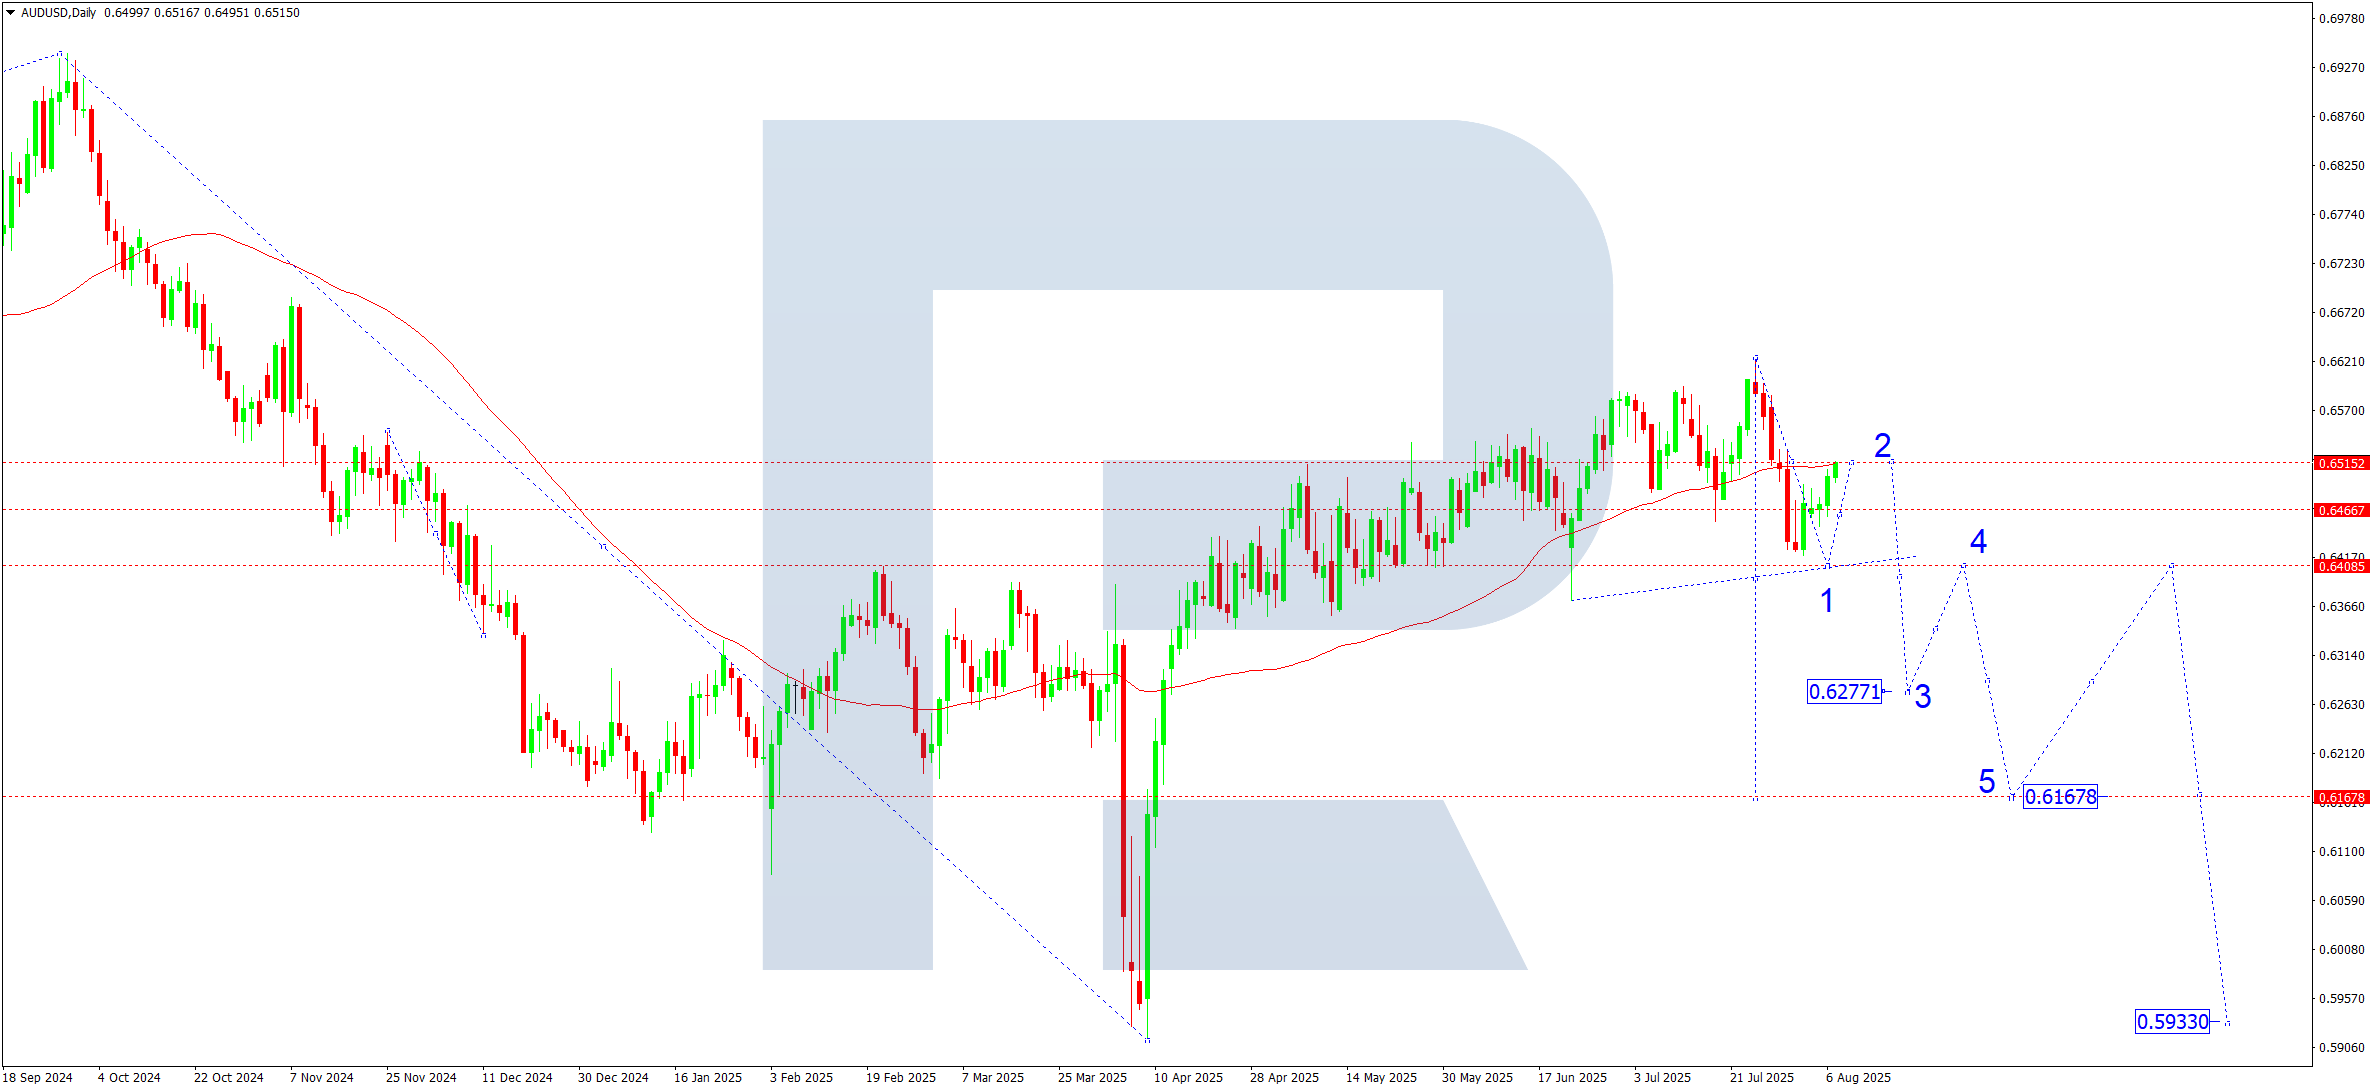
On the daily chart, the AUDUSD pair corrected to 0.6540, where the SMA50 lies. This resistance area pushed the price down. Next week is expected to see a new downward wave develop with an initial target at 0.6400. After the price reaches this area, the second corrective wave towards 0.6500 is possible, after which the downtrend is likely to resume towards 0.6277 and then 0.6170.
However, if buyers push the price above 0.6550 and gain a foothold there, this could open the door for growth to 0.6670 and higher if demand for risk and commodities persists.
AUDUSD forecast scenarios
Bearish scenario (base):
Consolidation below 0.6500 confirms the completion of the correction.
Downside targets:
- 0.6400 – first target
- 0.6277 – local target
- 0.6170 – main target of the first wave
Bullish scenario (alternative):
A confident consolidation above 0.6550 would open the way for growth.
Upside targets:
- 0.6670 – resistance area
- 0.6820 – local target
- 0.6969 – major target (extended 5th wave)
USDCAD forecast
With oil prices stabilising and expectations of a Fed policy pause growing, the Canadian dollar receives local support. At the same time, Canada’s July employment data was mixed. Unemployment rose slightly, while job creation exceeded expectations, fuelling speculation about the Bank of Canada’s next steps.
The US, in turn, published labour market data indicating slower wage growth, which could pressure the dollar. The week’s focus will be on US inflation (CPI) data, which may set the pair’s short-term direction.
USDCAD technical analysis
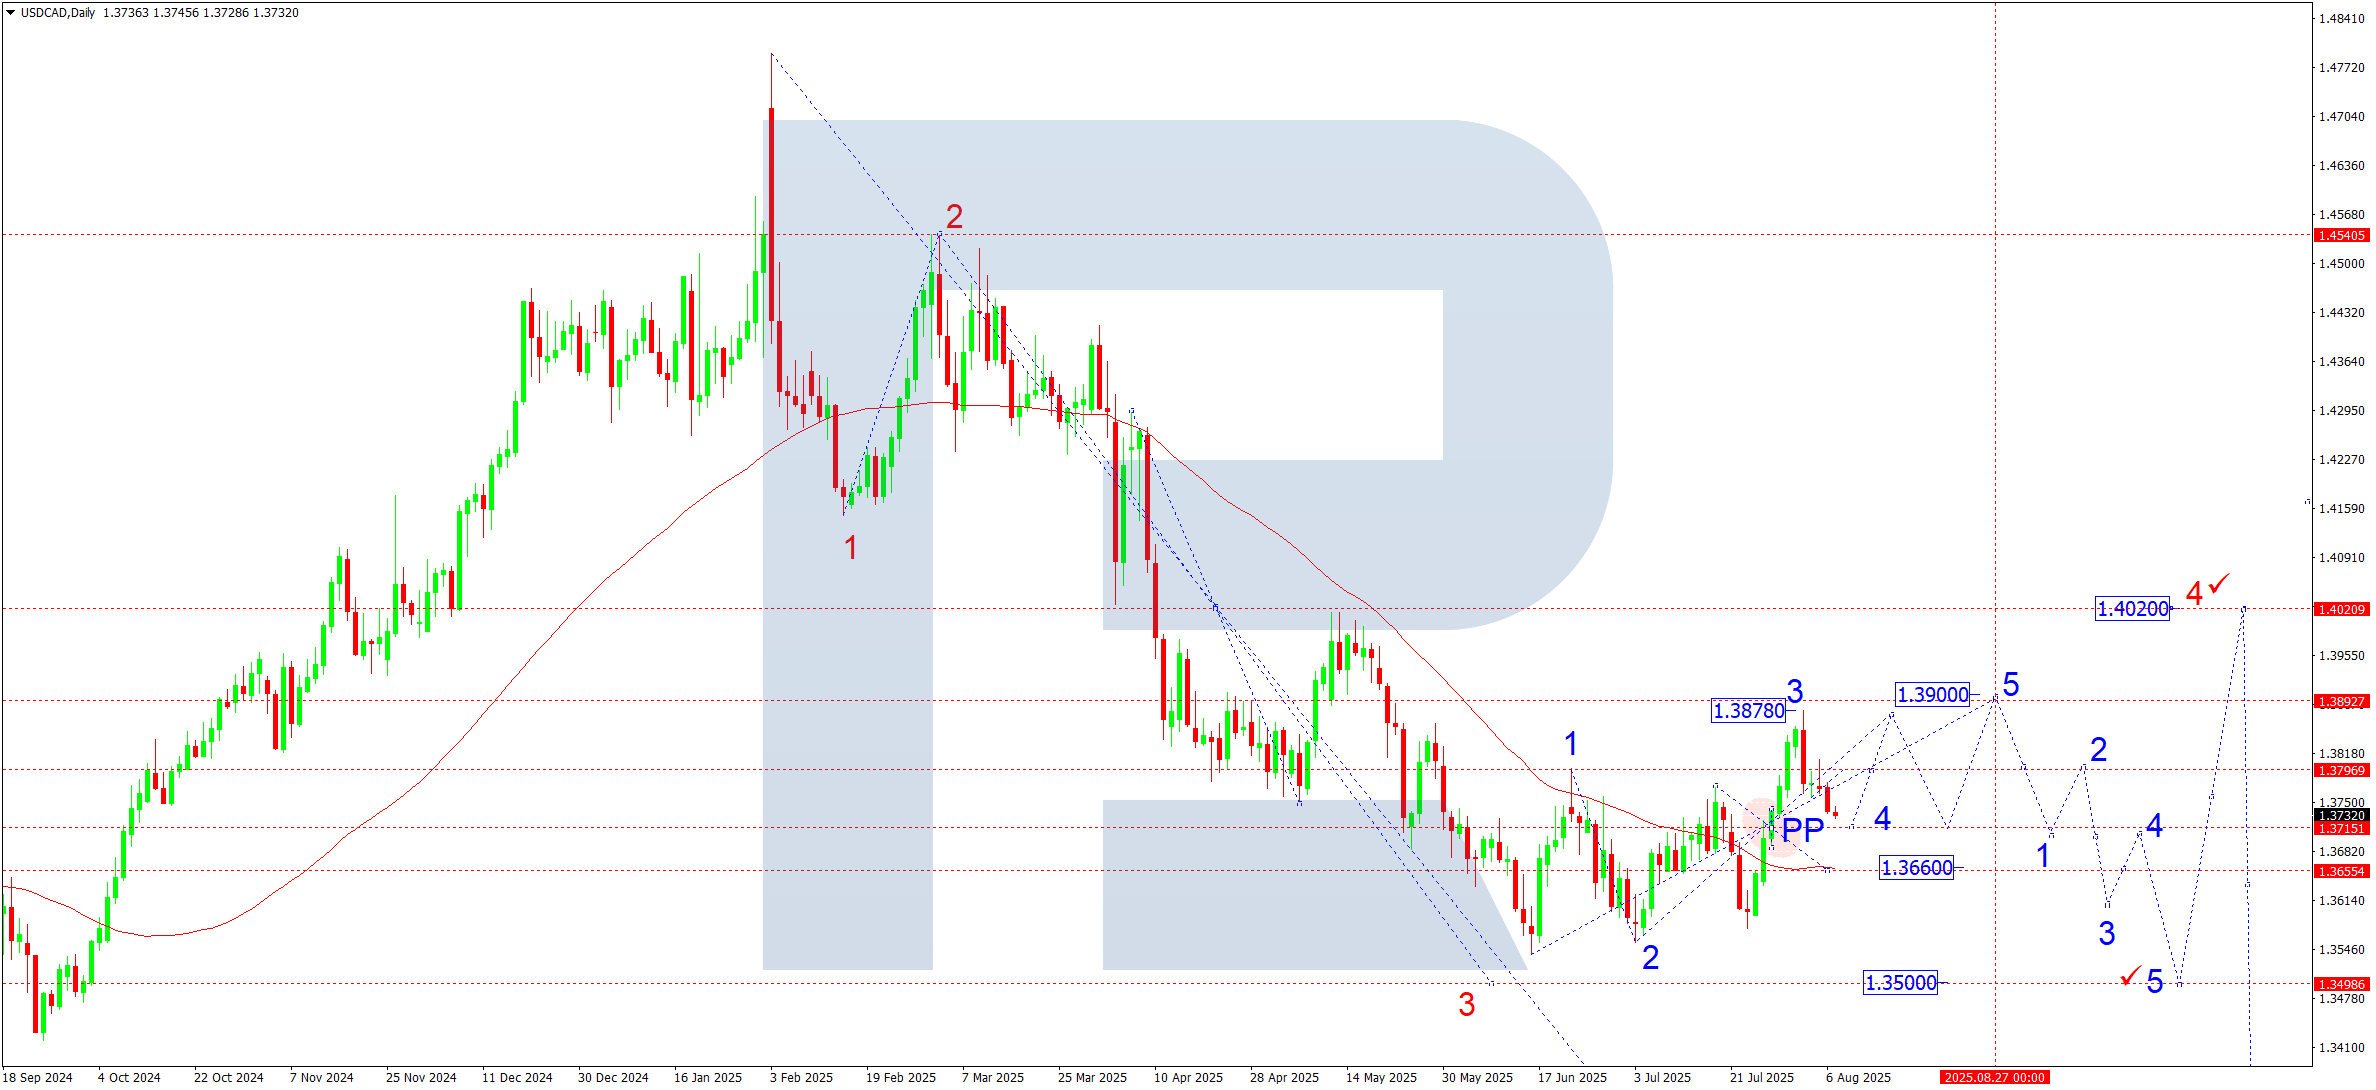
On the daily chart, the USDCAD pair broke below 1.3750 and continues to correct towards 1.3715 (retesting from above), confirming the weekly pivot point (PP). This forms the fourth corrective wave, which could extend to 1.3660. Once the current correction ends, the fifth growth wave is expected to start, aiming for 1.3900.
However, from a broader perspective, the bias remains neutral to bearish. The dominant trend is still downward, and the current structure is seen as a correction within a downtrend. The key target of the main downward wave is 1.3500.
USDCAD forecast scenarios
Bearish scenario (base):
The current correction is expected to complete near 1.3900, after which the market will resume its decline.
Downside targets:
- 1.3700 – first target
- 1.3660 – second target
- 1.3600 – third target
- 1.3500 – main target (within the third wave from 1.4540)
Bullish scenario (alternative):
Consolidation above 1.3800 will open the potential for growth to 1.3900, and then to 1.4020 as the main correction target.
If this level is reached, further downside could be reconsidered, with a new target set at 1.3255.
XAUUSD forecast
This week, gold remains under the influence of mixed factors. On one hand, expectations of a Fed rate hike pause are rising amid moderate inflation data and slower US economic growth, supporting gold as a safe-haven asset. On the other hand, reduced geopolitical tensions and rising stock indices limit demand for safe havens.
The market also closely watches US Treasury yields: a downward correction could boost gold demand. A key trigger will be the US CPI release, which could provide a short-term impulse amid expectations for the Fed’s future policy.
XAUUSD technical analysis
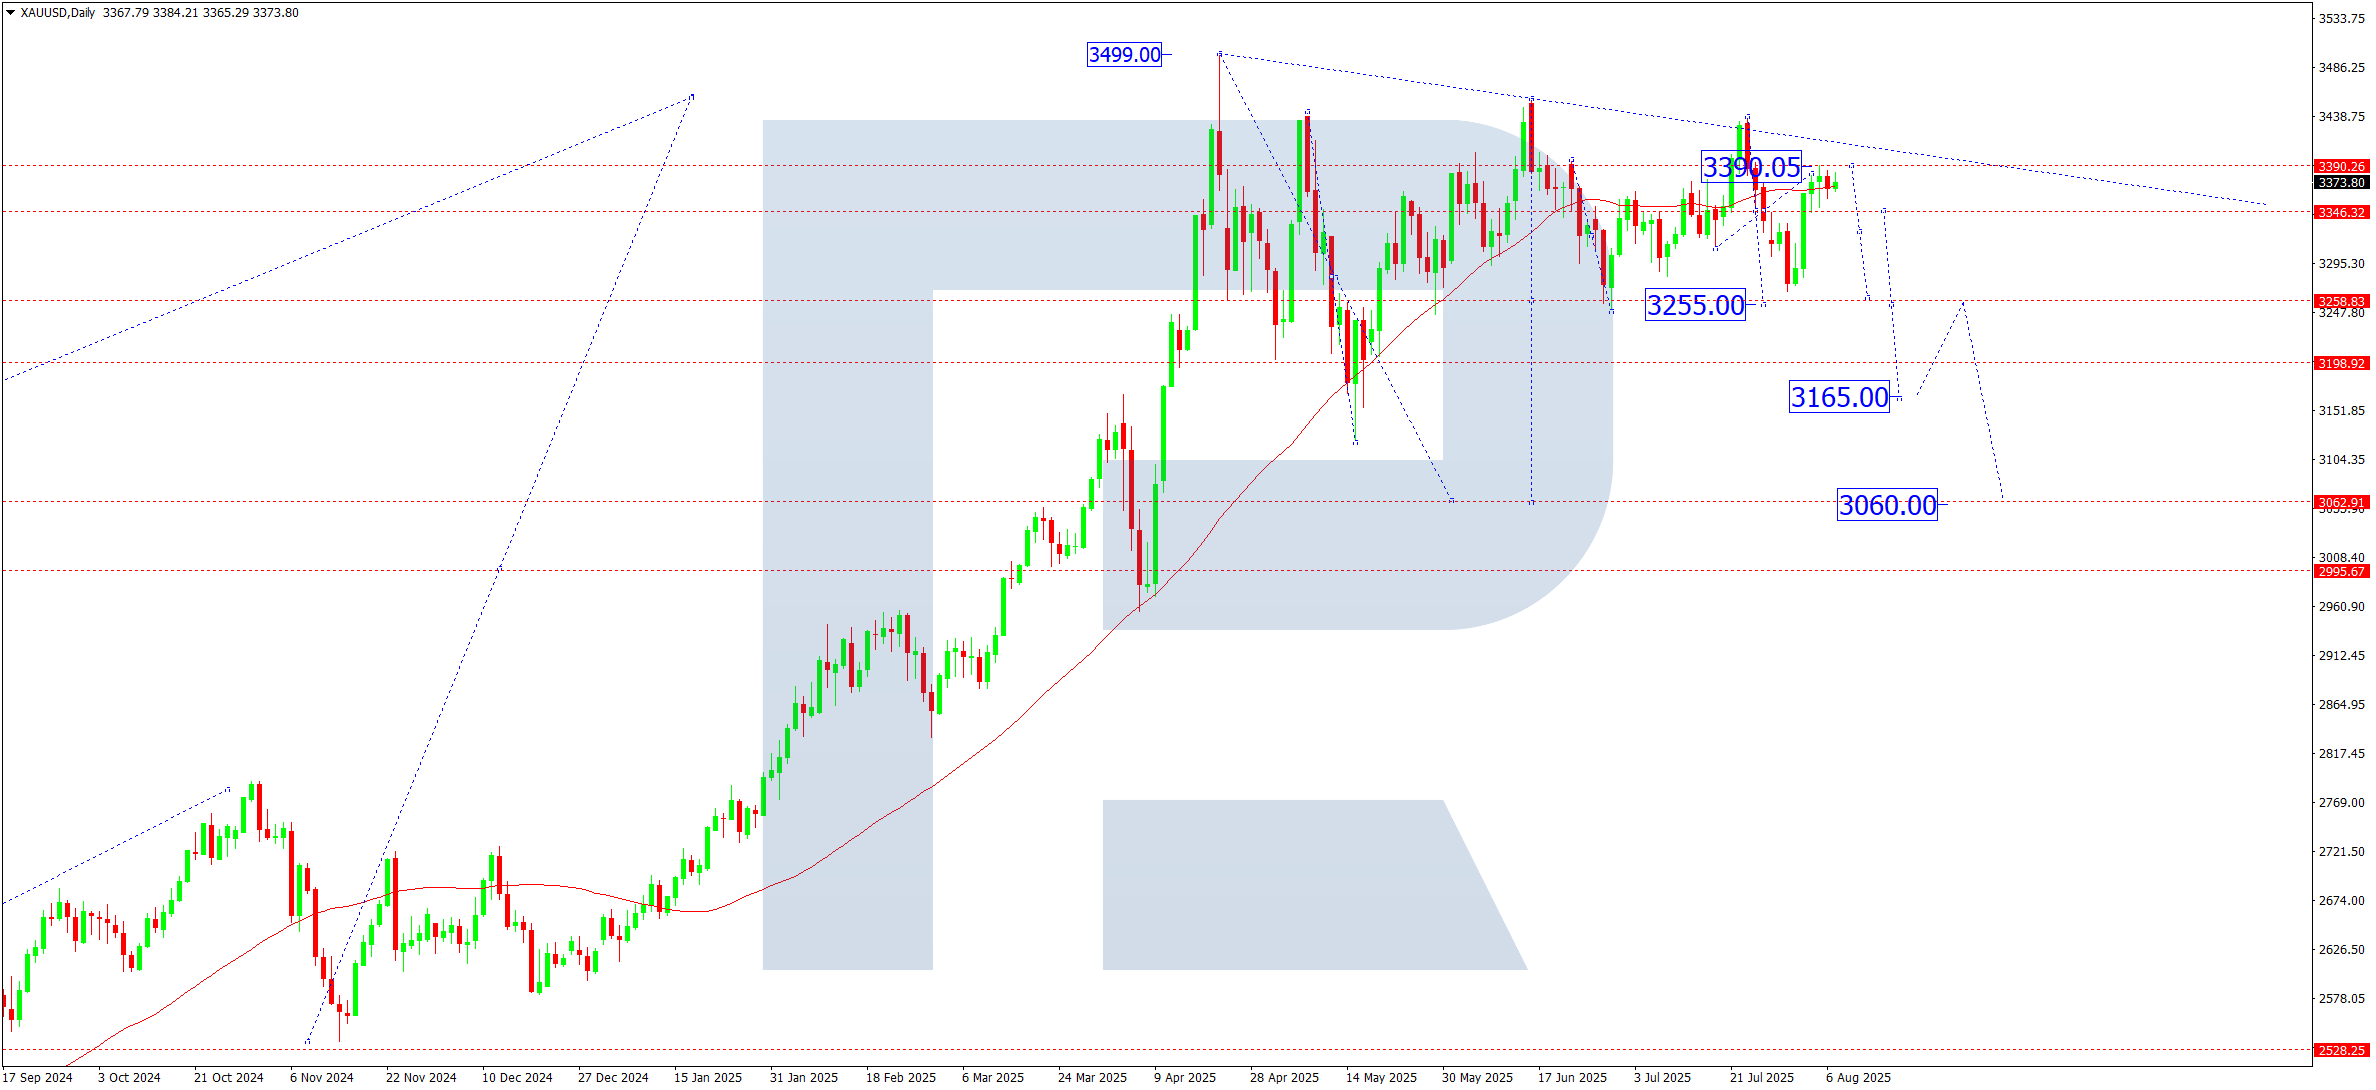
On the daily chart, XAUUSD is forming a consolidation range near 3,350, taking the shape of a Symmetrical Triangle. Such a pattern often precedes a sharp breakout and a strong move.
If prices break below 3,320, it will confirm a reversal and the start of a corrective phase with initial targets at 3,250-3,240, a key support area. Consolidation below these levels could open the way for a deeper correction towards 3,060-3,050.
However, a confident breakout above 3,415 could see the uptrend resume towards 3,500 and higher.
XAUUSD forecast scenarios
Bearish scenario (base):
A breakout and consolidation below 3,320 would trigger a downward wave.
Downside targets:
- 3,250-3,240 – key support
- 3,060-3,050 – technical correction area (according to the wave model)
Bullish scenario (alternative):
A breakout above 3,415 would signal continued growth.
Targets:
- 3,500 – key May resistance level
- 3,535 – possible upper boundary of the extended 5th wave
Brent forecast
Oil prices remain under pressure amid ongoing uncertainty in commodity markets. Price pressure comes from:
- Rising US crude inventories in the latest EIA report fuelled expectations of weaker demand
- Falling business activity in China, the largest oil importer, continues to raise concerns over global commodity demand
- However, the market is pricing in potential OPEC+ actions, including a likely extension of output limits if prices fall further, which supports quotes
- Geopolitical tensions in the Middle East remain an additional risk factor, posing a volatility risk
Brent technical analysis
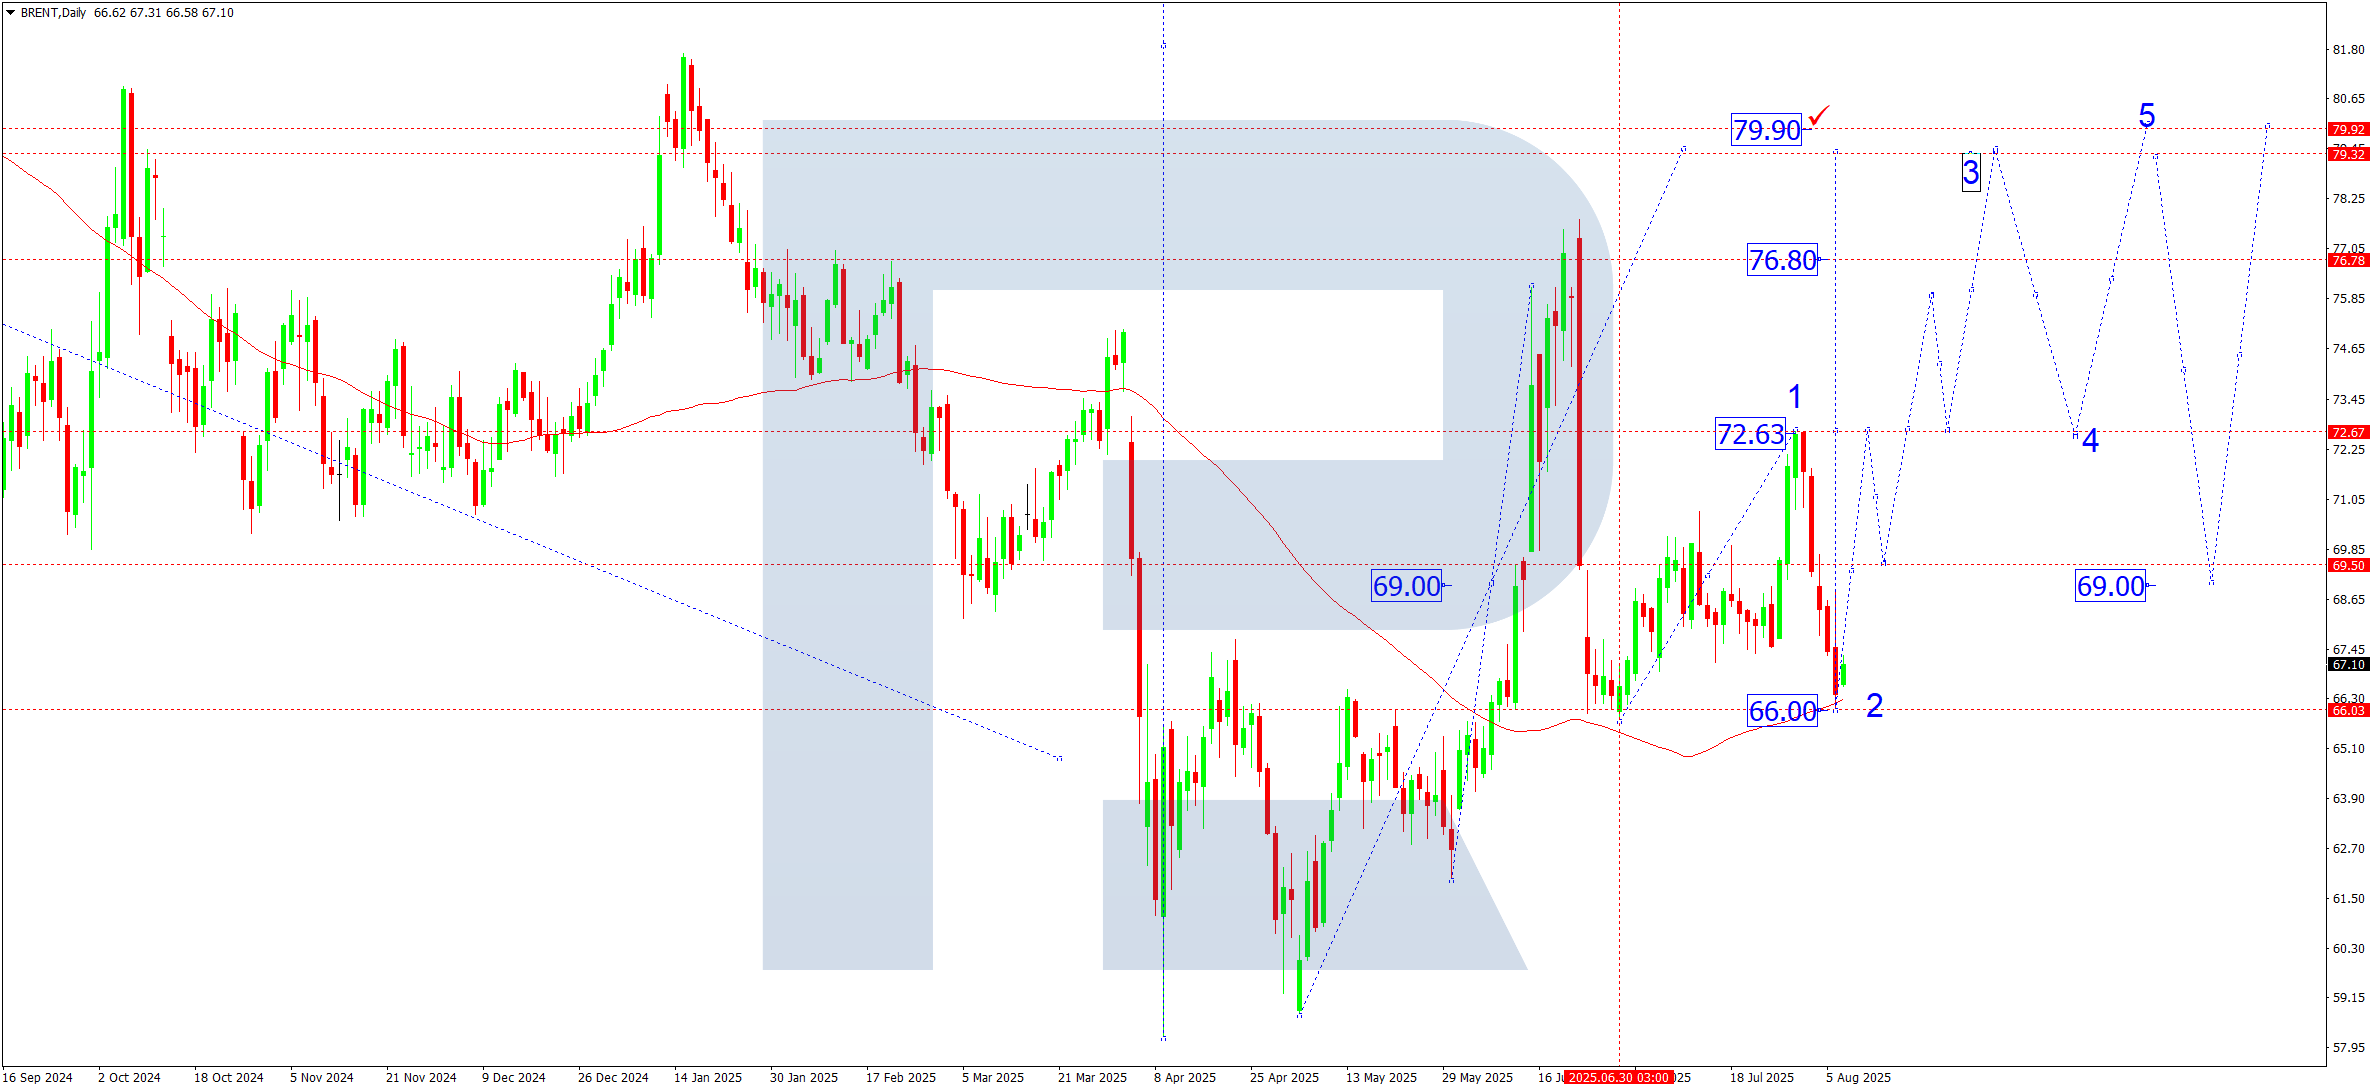
On the daily chart, Brent crude, after consolidating near 69.35, broke below the lower boundary of the range and reached support at 66.00, where the SMA50 passes.
This level may serve as the end point of the correction and the start of a new growth wave. If support here holds, an upward move towards 72.62 is expected. Breaking above this area would open the way to 76.00 and 79.30 as part of the continued medium-term uptrend.
Brent forecast scenarios
Bullish scenario (base):
Holding support at 66.00 will confirm the end of the corrective wave.
Upside targets:
- 72.60 – intermediate resistance level
- 76.00 – local target
- 79.30 – key growth wave target
Bearish scenario (alternative):
A breakout and consolidation below 66.00 will increase corrective pressure.
Downside targets:
- 64.00 – important support level
- 62.00 – lower boundary of May consolidation
Forecasts presented in this section only reflect the author’s private opinion and should not be considered as guidance for trading. RoboForex bears no responsibility for trading results based on trading recommendations described in these analytical reviews.