
Daily technical analysis and forecast for 13 July 2026
Here is a detailed daily technical analysis and forecast for EURUSD, USDJPY, GBPUSD, AUDUSD, USDCAD, XAUUSD, Brent and BTCUSD for 13 July 2026.
EURUSD forecast
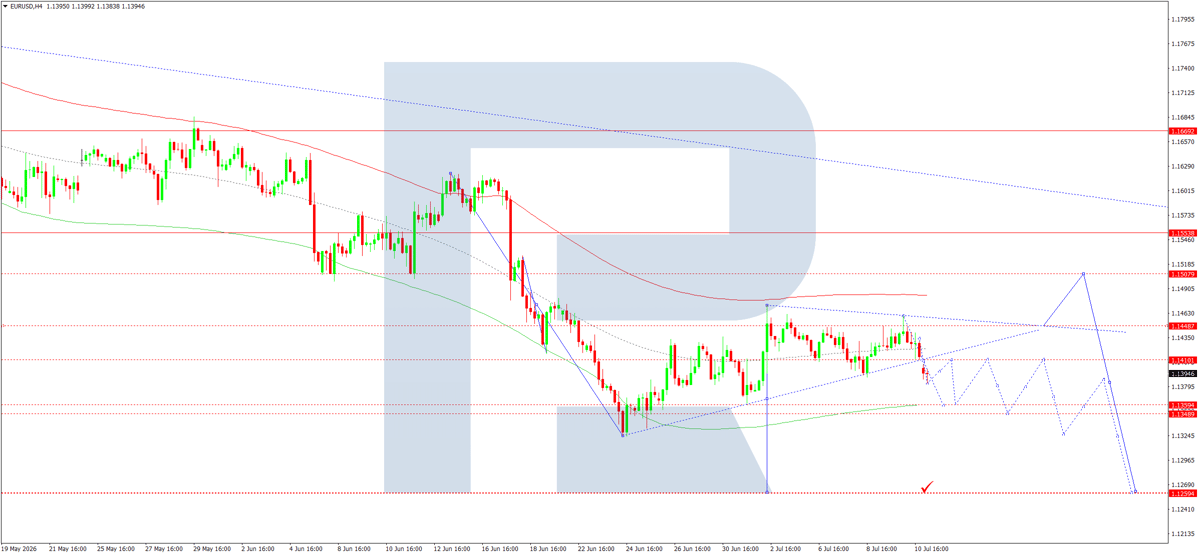
On the H4 chart, the EURUSD pair broke below 1.1410 and completed a downward wave to 1.1384. Today, 13 July 2026, the market is expected to develop a narrow consolidation range around 1.1410. If the price breaks above the range, it could extend towards 1.1500. A downside breakout would signal a continued downward wave to 1.1350, with the downtrend potentially extending to 1.1260, the primary target.
Technically, this scenario is confirmed by the Elliott wave structure and the wave matrix with a pivot point at 1.1680, a key level in the current EURUSD downward wave. At the moment, the market is forming a consolidation range around the central line of the Price Envelope at 1.1410. A decline to its lower boundary at 1.1300 is expected afterwards.
Technical indicators for today's EURUSD forecast suggest a decline to 1.1350.
USDJPY forecast
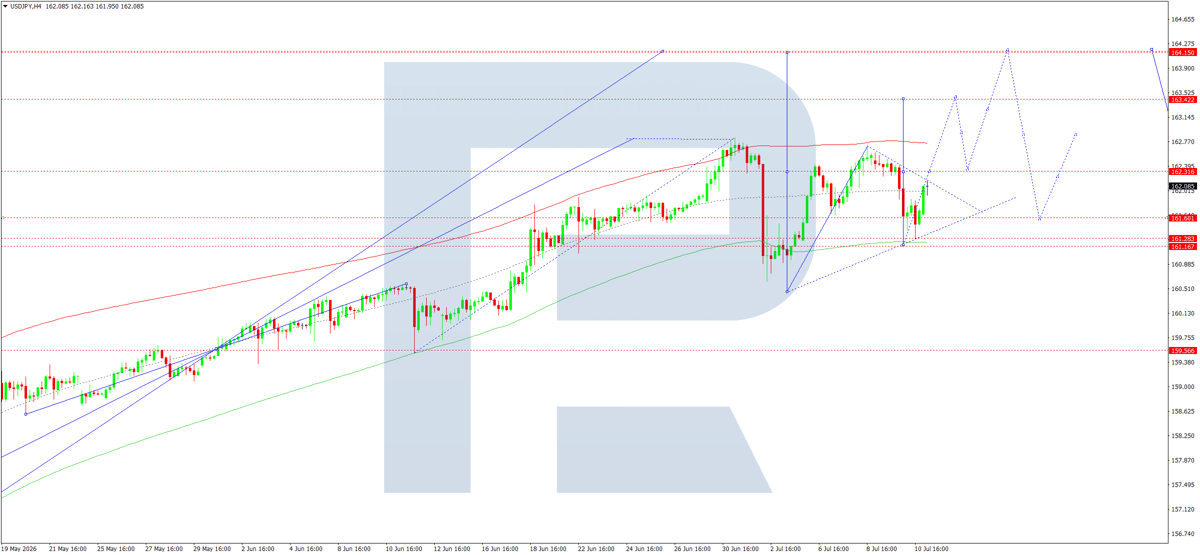
On the H4 chart, the USDJPY pair found support at 161.28 and broke above 161.90. Today, 13 July 2026, the market is expected to continue its upward wave towards 162.30. A pullback to 161.90 cannot be ruled out, followed by a rally to 163.40, with the uptrend potentially extending to 164.15. A new consolidation range may then form below this level.
Technically, this scenario for USDJPY is confirmed by the Elliott wave structure and the upward wave matrix with a pivot point at 159.10, a key level in the current wave. At the moment, the market is forming a consolidation range around 162.30. A downside breakout would open the door for a decline to the lower boundary of the Price Envelope at 161.30, while an upside breakout would pave the way for a move towards its upper boundary at 163.40.
Technical indicators for today's USDJPY forecast suggest a rally to 163.40.
GBPUSD forecast
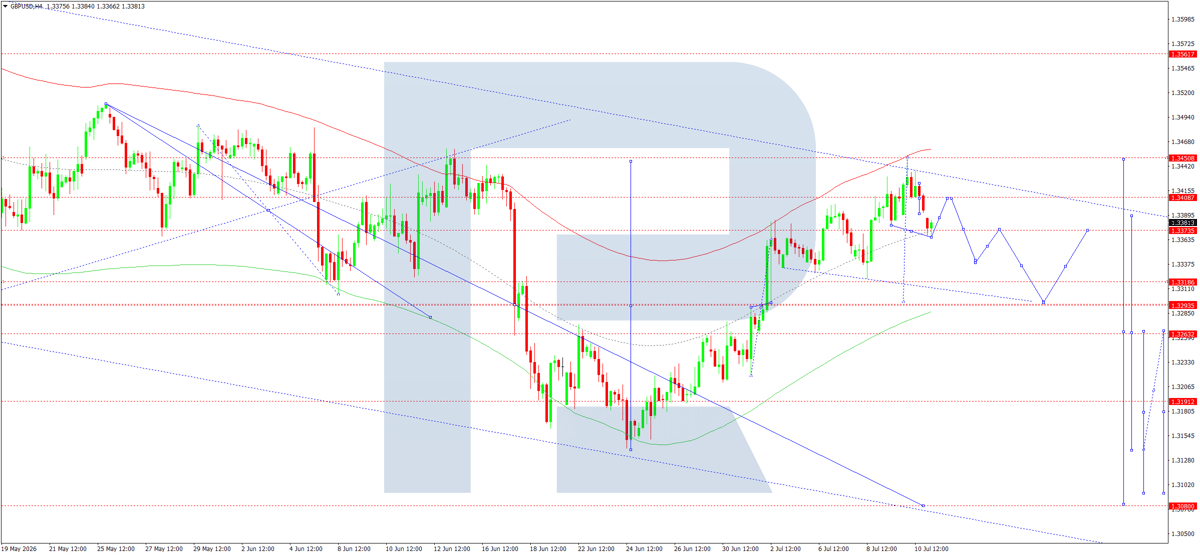
On the H4 chart, the GBPUSD pair broke below 1.3383 and completed a downward wave to 1.3450. Today, 13 July 2026, the market is expected to rise to 1.3400 and then decline to 1.3340. A breakout below this level would open the way for the downtrend to continue towards 1.3290. A rebound to 1.3340 may then follow.
Technically, this scenario for GBPUSD is confirmed by the Elliott wave structure and the downward wave matrix with a pivot point at 1.3300, a key level in the current downward wave. Today, the market completed a downward wave to the central line of the Price Envelope at 1.3366. A decline towards its lower boundary at 1.3290 is expected afterwards. This is the first target.
Technical indicators for today's GBPUSD forecast suggest a decline to 1.3290.
AUDUSD forecast
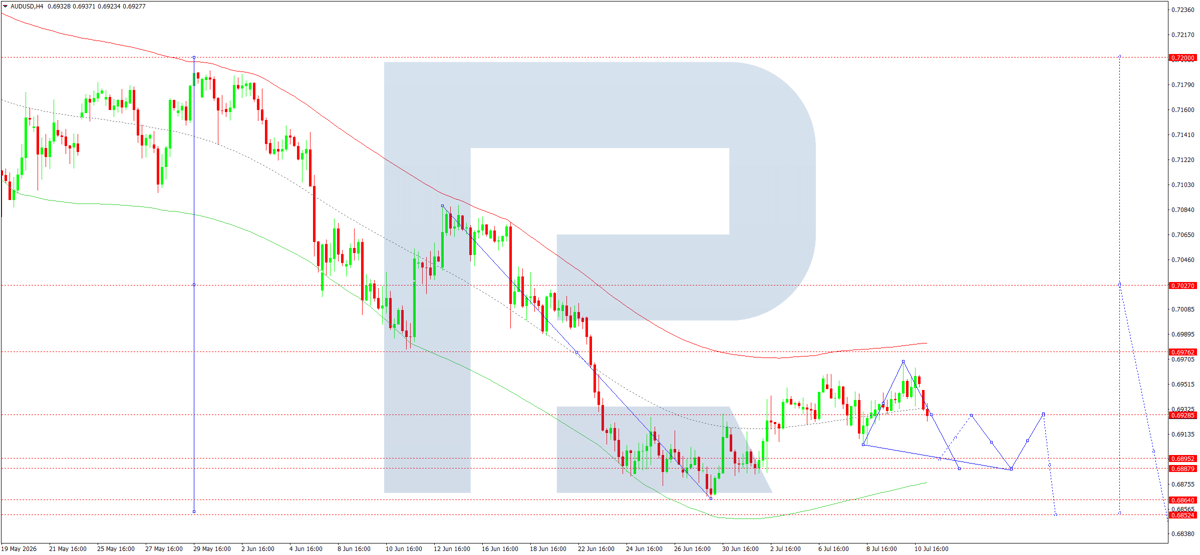
On the H4 chart, the AUDUSD pair is developing a downward wave towards 0.6895. Today, 13 July 2026, the market is expected to develop a consolidation range below this level. An upside breakout could trigger a correction towards 0.6930. A downside breakout may extend the downward wave to 0.6855.
Technically, this scenario is confirmed by the Elliott wave structure and the downward wave matrix with a pivot point at 0.7200, a key level in the current wave for AUDUSD. At the moment, the market completed a downward wave to the central line of the Price Envelope at 0.6930. A decline towards its lower boundary at 0.6888 is expected afterwards, followed by a rally to 0.6933.
Technical indicators for today's AUDUSD forecast suggest the upward wave could continue to 0.6888.
USDCAD forecast
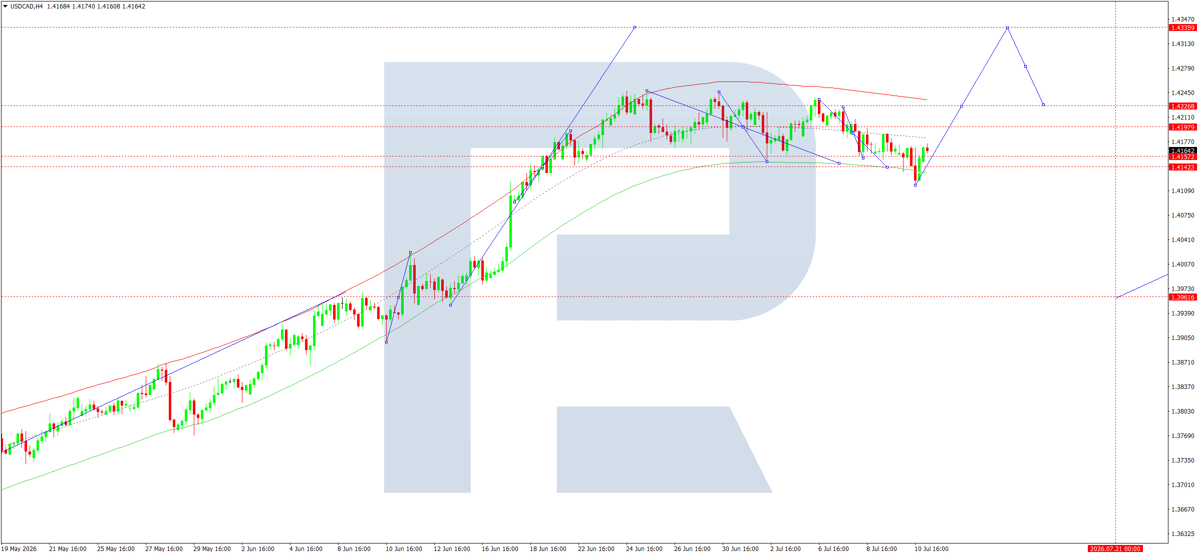
On the H4 chart, the USDCAD pair completed a downward wave to 1.4116 and an upward wave to 1.4660. Today, 13 July 2026, the market is expected to develop a consolidation range around 1.4145. A downside breakout would open the potential for a decline to 1.4090, while an upside breakout would signal the continuation of the upward wave to 1.4228 and possibly further to 1.4335.
Technically, this scenario is confirmed by the Elliott wave structure and the upward wave matrix with a pivot point at 1.3629, a key level in the current wave for USDCAD. At the moment, the market completed a downward structure to the lower boundary of the Price Envelope at 1.4116. A consolidation range is expected to form around this level. A downside breakout would open the way to 1.4090, while an upside breakout would pave the way for a move towards its upper boundary at 1.4228.
Technical indicators for today's USDCAD forecast suggest a rally towards 1.4228.
XAUUSD forecast
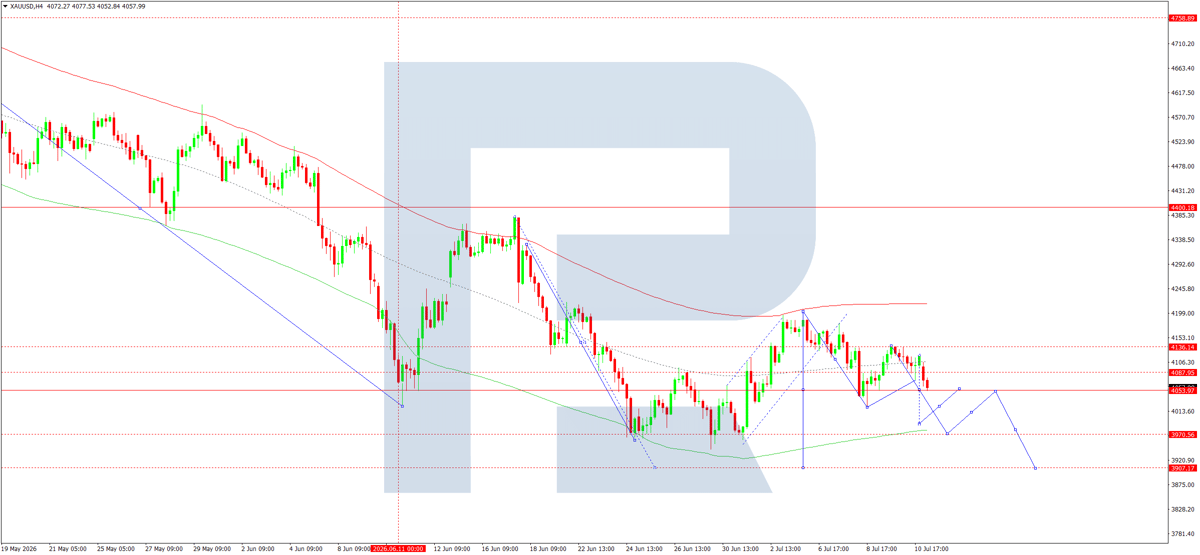
On the H4 chart, XAUUSD completed a downward wave to 4,050. Today, 13 July 2026, the market is expected to continue its downward movement towards 3,989, possibly edging lower to 3,910, a local target.
Technically, this scenario is confirmed by the Elliott wave structure and the downward wave matrix with a pivot point at 4,550, a key level in the current wave for XAUUSD. At the moment, the market completed a downward wave to the central line of the Price Envelope at 4,050. A decline towards its lower boundary at 3,989 is expected afterwards.
Technical indicators for today's XAUUSD forecast suggest a decline to 3,989.
Brent forecast
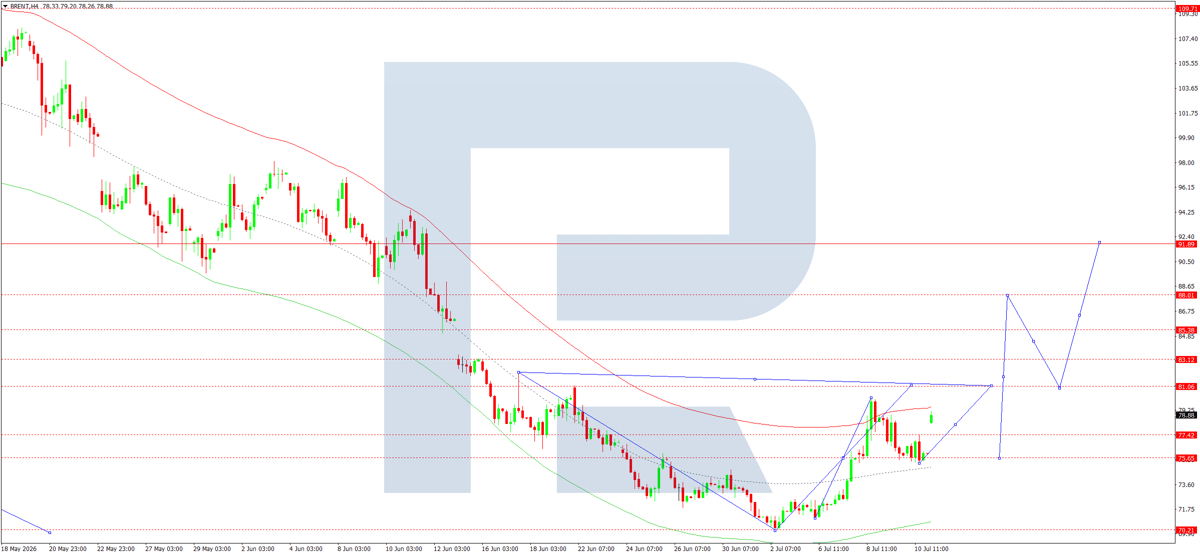
On the H4 chart, Brent broke above 77.40 and is developing an upward wave towards 80.20. Today, 13 July 2026, the market may continue to rise to 81.05. A decline to 75.65 may then follow. This will effectively establish the boundaries of a consolidation range around 75.65. A downside breakout from the range could extend the decline to 72.50. A recovery to 78.30 may then follow, with the potential for a further rally to 85.50. An immediate upside breakout would open the way for a move to 88.00.
Technically, this scenario is confirmed by the Elliott wave structure and the downward wave matrix with a pivot point at 98.00, a key level in the current wave for Brent. At the moment, the market is forming a consolidation range around the central line of the Price Envelope at 75.65. A rally towards its upper boundary at 81.05 is expected afterwards.
Technical indicators for today's Brent forecast suggest continued growth towards 81.05.
BTCUSD forecast
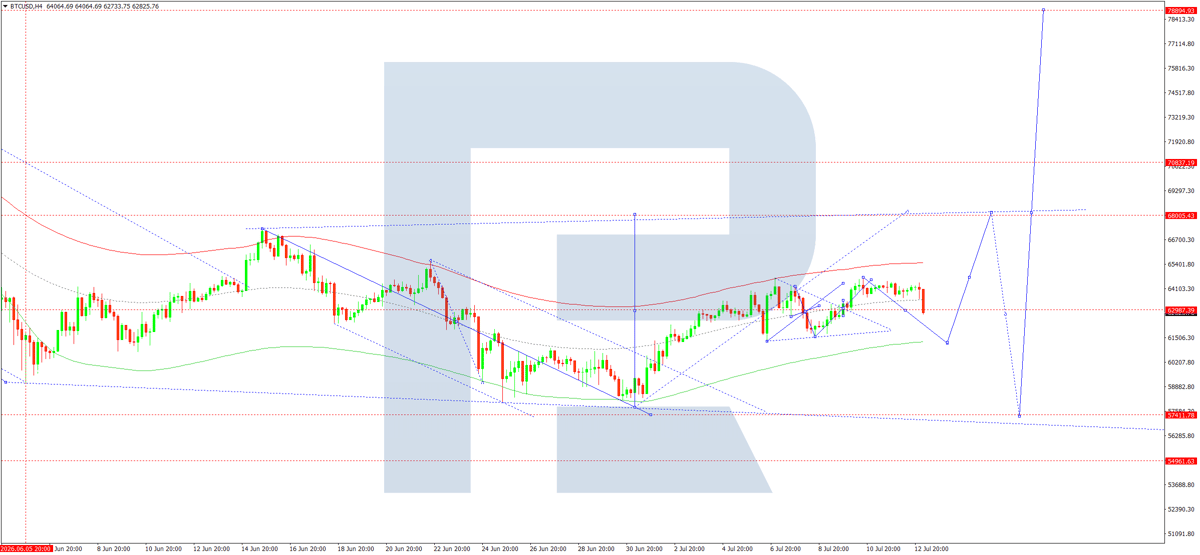
On the H4 chart, BTCUSD completed an upward wave to 64,440. Today, 13 July 2026, the market may develop a downward wave towards 62,900. A consolidation range is effectively forming around this level. A downside breakout could extend the decline to 61,244, while an upside breakout would open the door for a move towards 68,000.
Technically, this scenario is confirmed by the Elliott wave structure and the downward wave matrix with a pivot point at 70,900, a key level in the current wave for BTCUSD. At the moment, the market is developing a downward structure towards the lower boundary of the Price Envelope at 61,244. A rally to its upper boundary at 68,000 is expected afterwards.
Technical indicators for today's BTCUSD forecast suggest a decline to 61,244.
Editors’ picks
 EURUSD forecast 2026–2027: technical analysis, price levels & predictions
The ECB holds rates at 2.15% while the Fed stays at 3.75% — and that divergence is the central driver of EURUSD in 2026. The pair is range-bound between 1.1400 and 1.1915, with Deutsche Bank targeting 1.2500 and Morgan Stanley calling for 1.3000 by year-end. We analyse the technicals, break down the macro factors, and outline three trading scenarios with specific entry levels.
 Gold (XAUUSD) forecast 2026: predictions based on fundamental and technical analysis
Gold has corrected over 25% from its all-time high of 5,597 USD and is now trading near 4,100 USD — testing a critical support zone. Is this the bottom, or will the downtrend continue? We break down the key levels (support 3,920 USD, breakout trigger 4,500 USD), three trading scenarios with entry levels, and what J.P. Morgan, Goldman Sachs and Deutsche Bank are forecasting for gold in 2026.
Forecasts presented in this section only reflect the author’s private opinion and should not be considered as guidance for trading. RoboForex bears no responsibility for trading results based on trading recommendations described in these analytical reviews.