Daily technical analysis and forecast for 20 November 2025
Here is a detailed daily technical analysis and forecast for EURUSD, USDJPY, GBPUSD, AUDUSD, USDCAD, XAUUSD and Brent for 20 November 2025.
EURUSD forecast
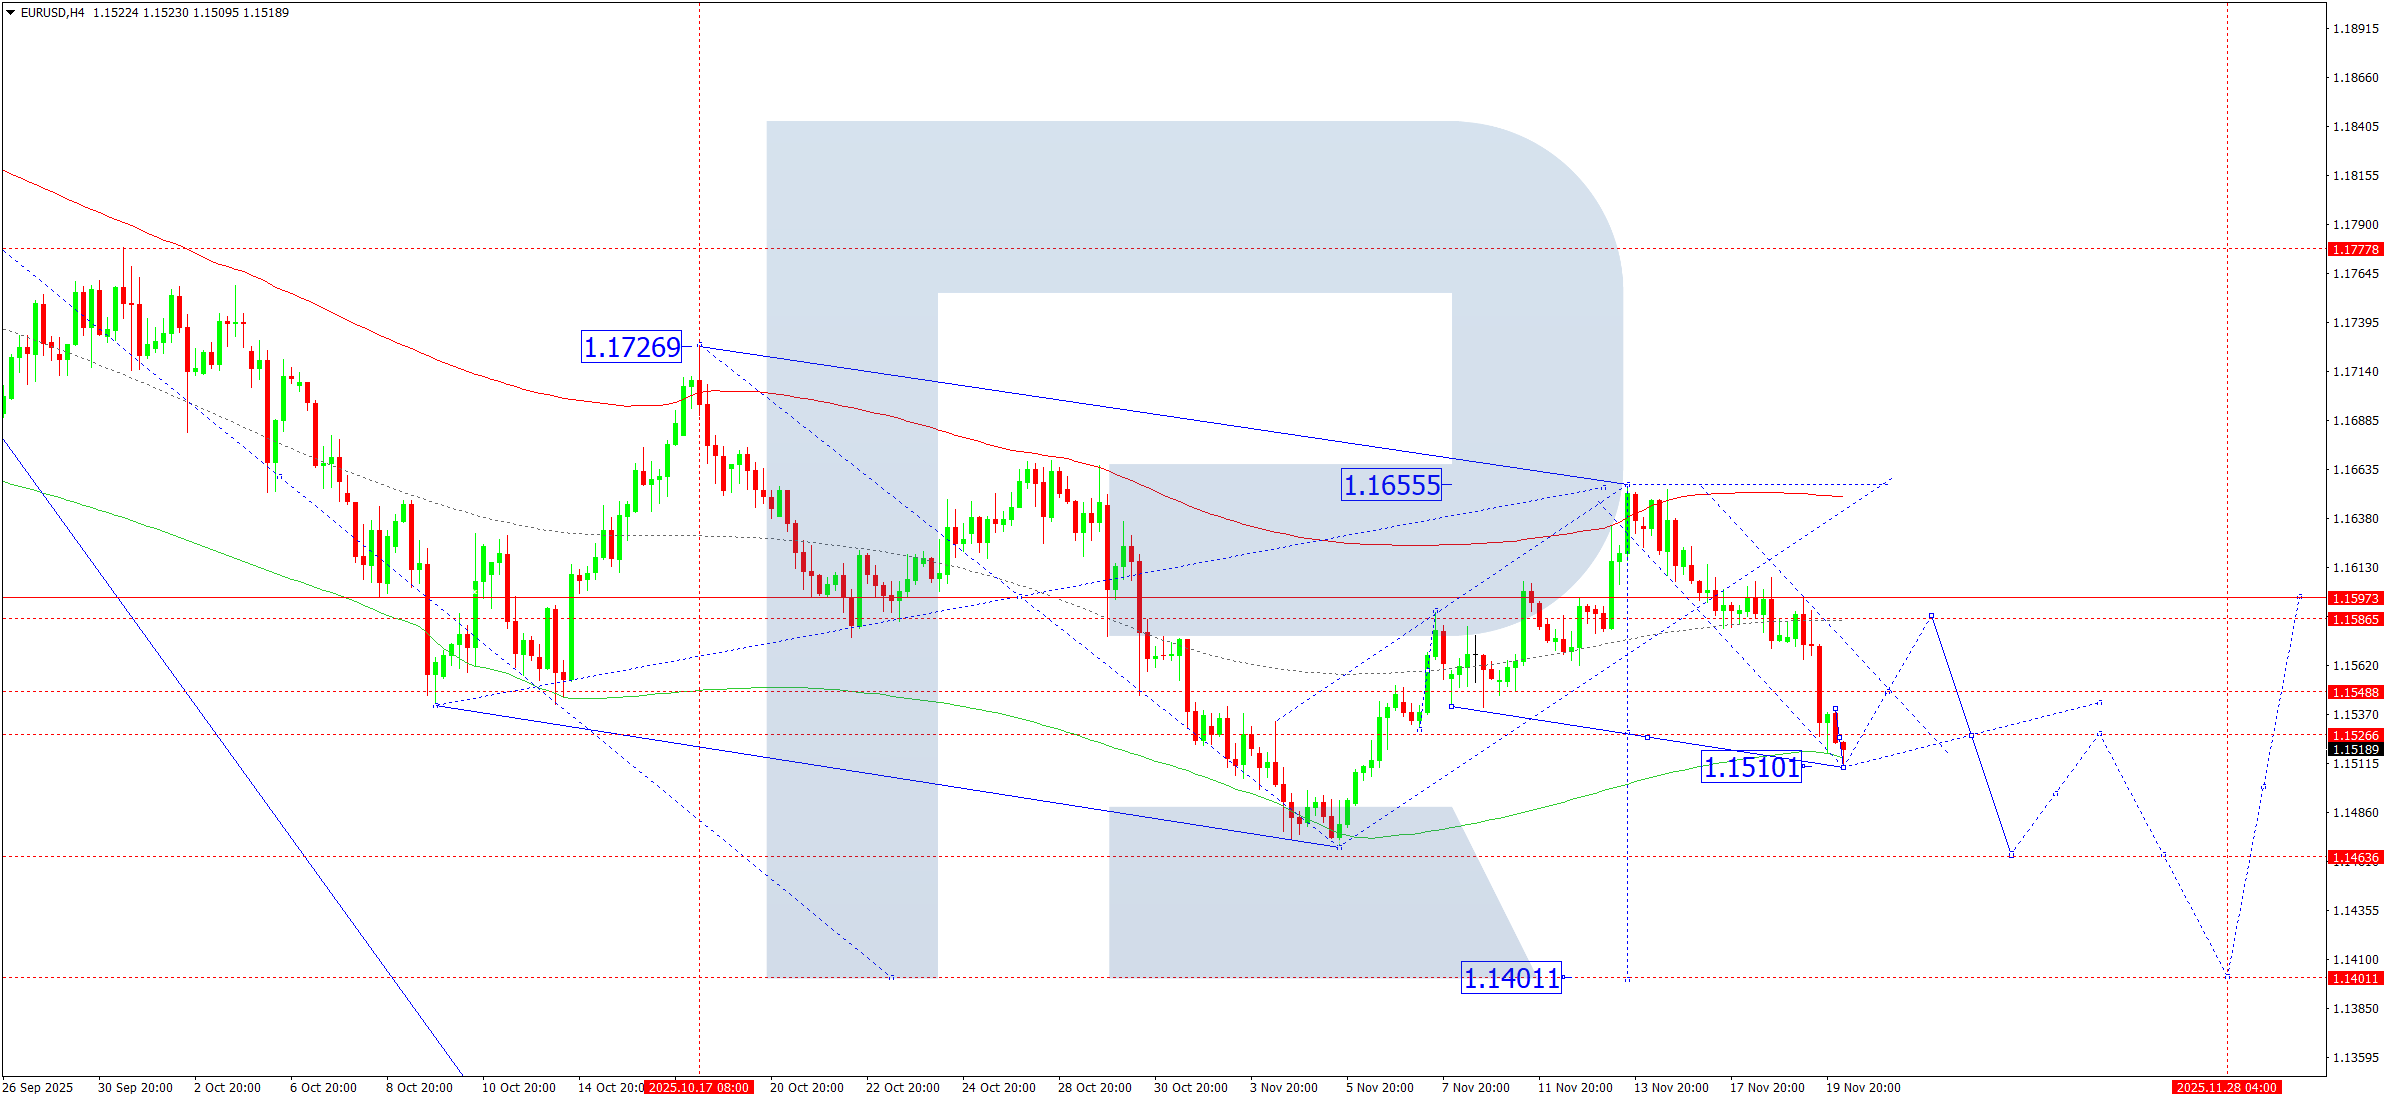
On the H4 chart of EURUSD, the market broke downwards from the consolidation range. On 20 November 2025, a downward wave completed towards 1.1510. This decline represents the beginning of the fifth downward wave. Currently, a narrow consolidation range is forming above this level. The range may expand upwards to 1.1548, with a possible corrective move towards 1.1585. Afterwards, a decline towards 1.1464 is expected. The target is local, within the structure of the downward wave towards 1.1401.
The Elliott wave structure and the downward wave matrix with a pivot point at 1.1660 confirm this scenario and act as the key elements in the EURUSD wave structure. At the moment, the market completed a downward wave towards the lower boundary of the Price Envelope at 1.1510. Today, a corrective move towards 1.1548 is possible as a minimum. Afterwards, the scenario includes a downward wave towards the lower boundary of the Price Envelope at 1.1464, with the potential to extend the trend to 1.1401.
Technical indicators for today’s EURUSD forecast suggest a correction towards 1.1548, followed by a decline towards 1.1464.
USDJPY forecast
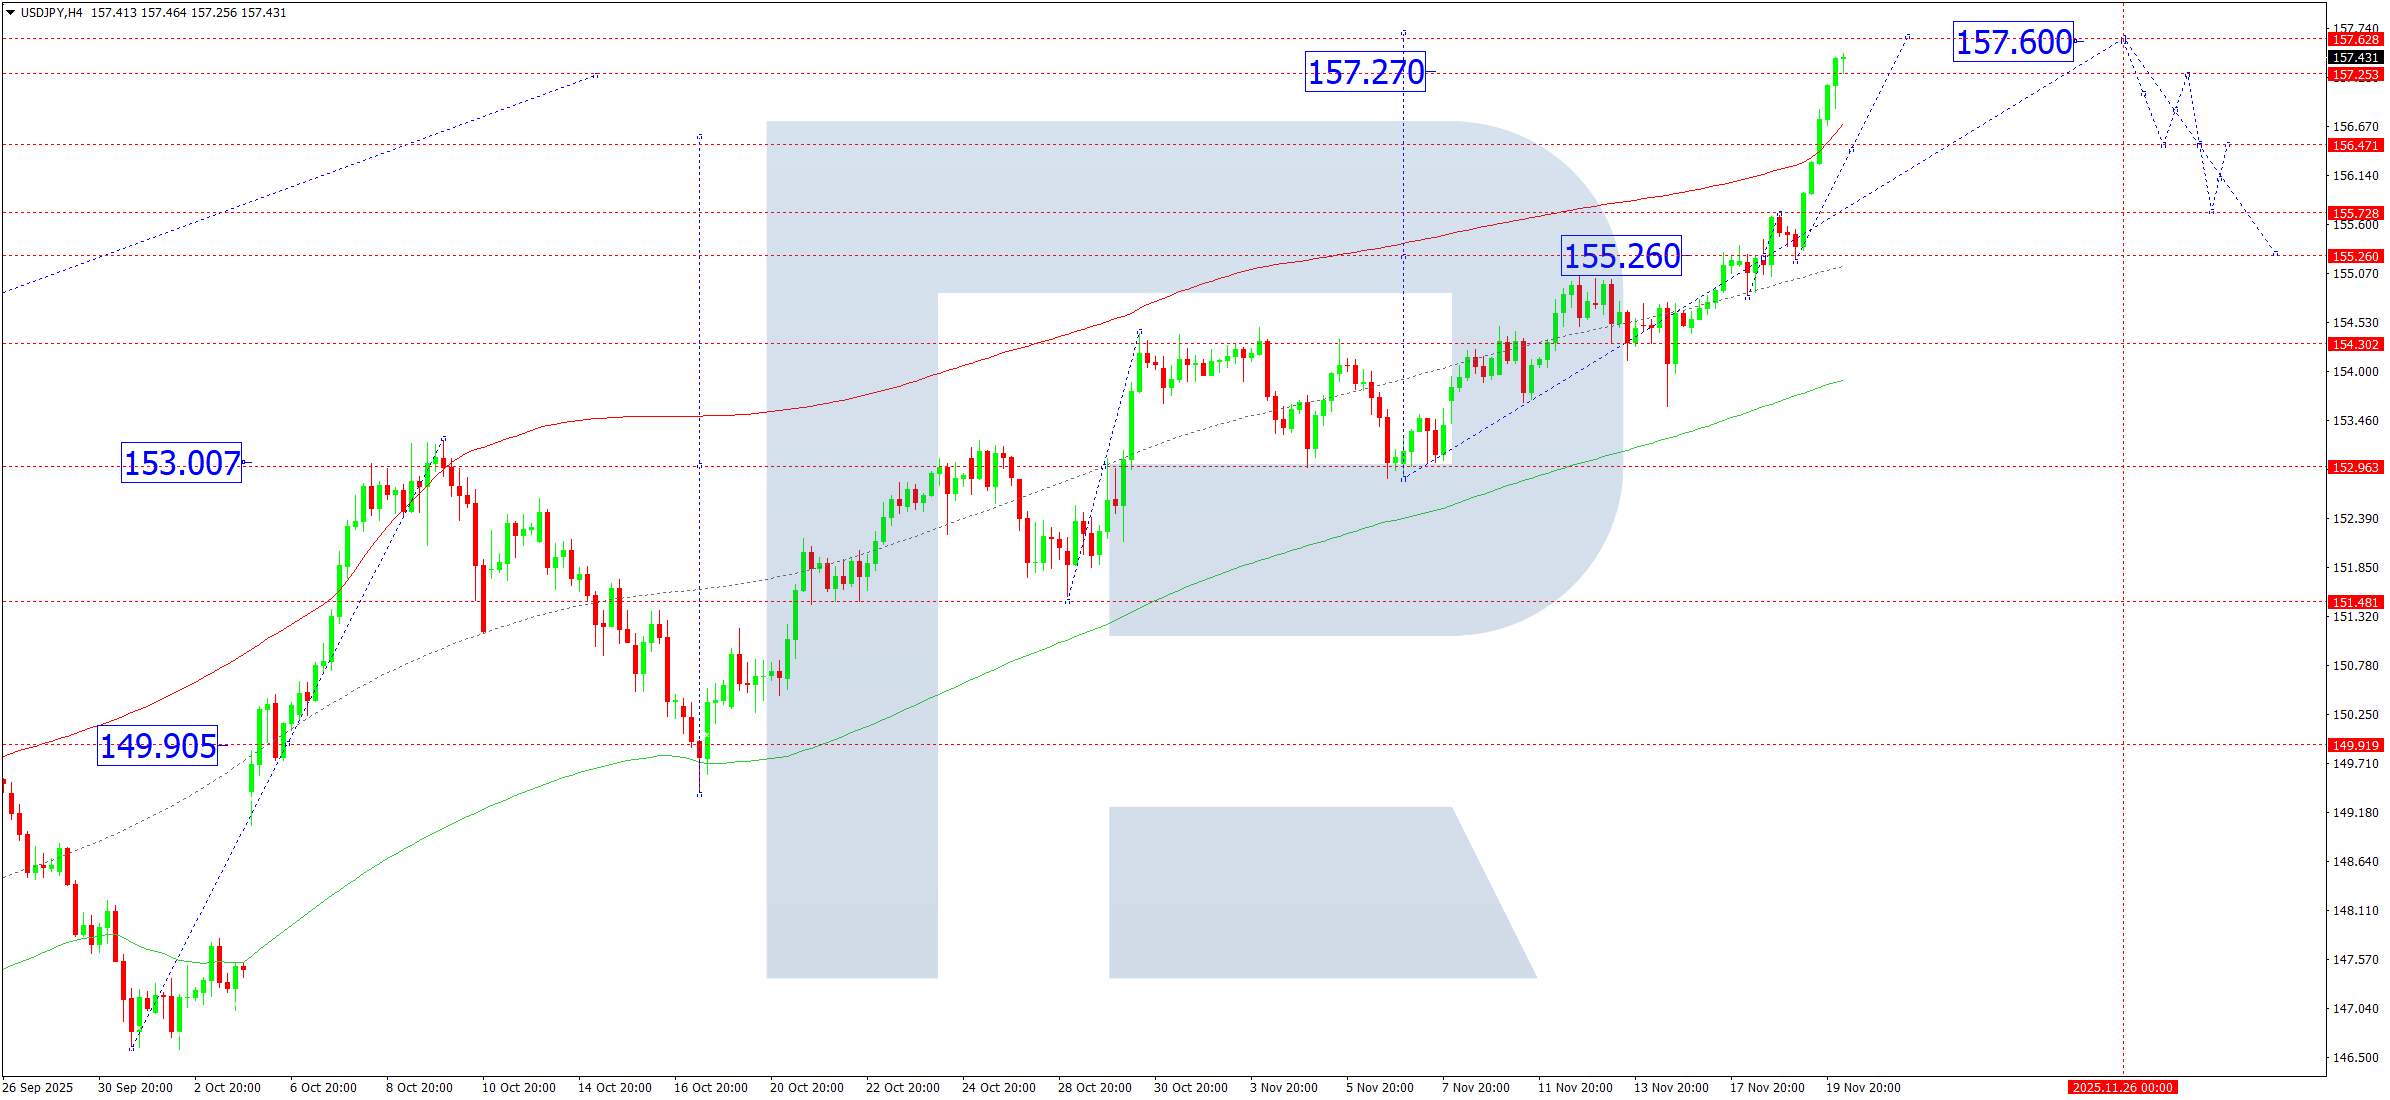
On the H4 chart of USDJPY, the market formed a consolidation range around 155.26 and broke upwards, reaching the estimated target of the upward wave at 157.27. On 20 November 2025, a compact consolidation range may form below this level. A downward breakout suggests the beginning of a correction towards 155.26 at least, while an upward breakout brings into focus an extension of the wave towards 157.60.
The Elliott wave structure and the upward wave matrix with a pivot point at 153.00 confirm this scenario and act as the key elements in this wave structure. Currently, the market has completed an upward wave towards 157.20 and is forming a consolidation range below it. A corrective move towards the central line of the Price Envelope at 155.26 is possible. Afterwards, a rise towards the upper boundary at 157.60 remains likely.
Technical indicators for today’s USDJPY forecast suggest a correction towards 155.26 and growth towards 157.60.
GBPUSD forecast
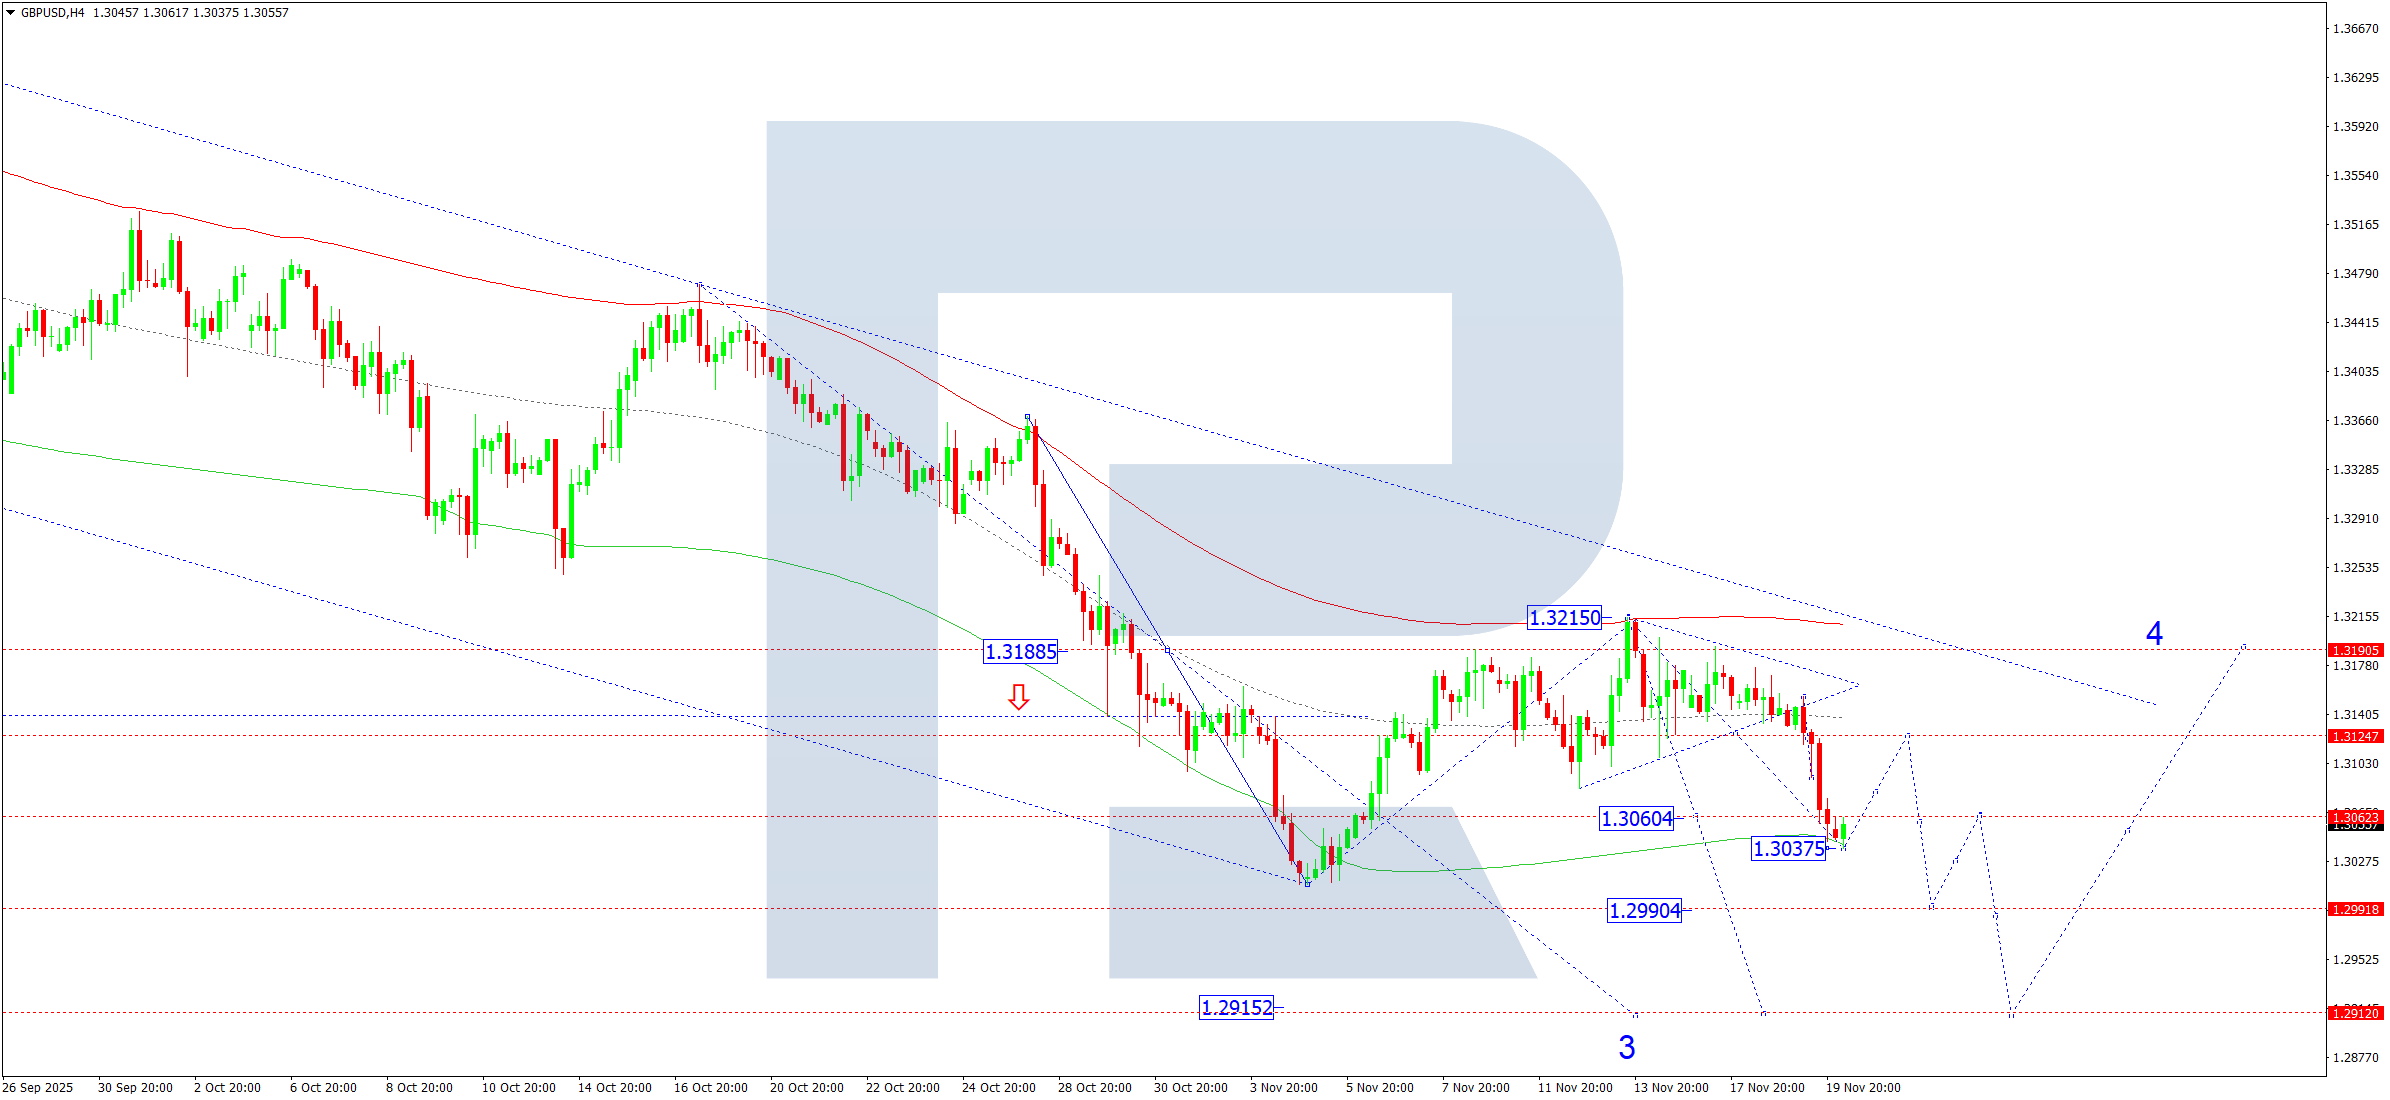
On the H4 chart of GBPUSD, the market completed a downward wave towards 1.3037. On 20 November 2025, a consolidation range may develop above this level. An upward breakout could lead to a corrective move towards 1.3080. A downward breakout would open the potential for a continuation of the wave towards 1.2990, with the potential to extend the trend to 1.2915, a local target.
The Elliott wave structure and the downward wave matrix with a pivot point at 1.3188 confirm this scenario and act as the key elements in this wave structure. The market has completed a downward wave towards the lower boundary of the Price Envelope at 1.3037. Today, a correction towards its central line at 1.3080 is possible, followed by a continued downward wave towards its lower boundary at 1.2990.
Technical indicators for today’s GBPUSD forecast suggest a continued downward movement towards 1.2990.
AUDUSD forecast
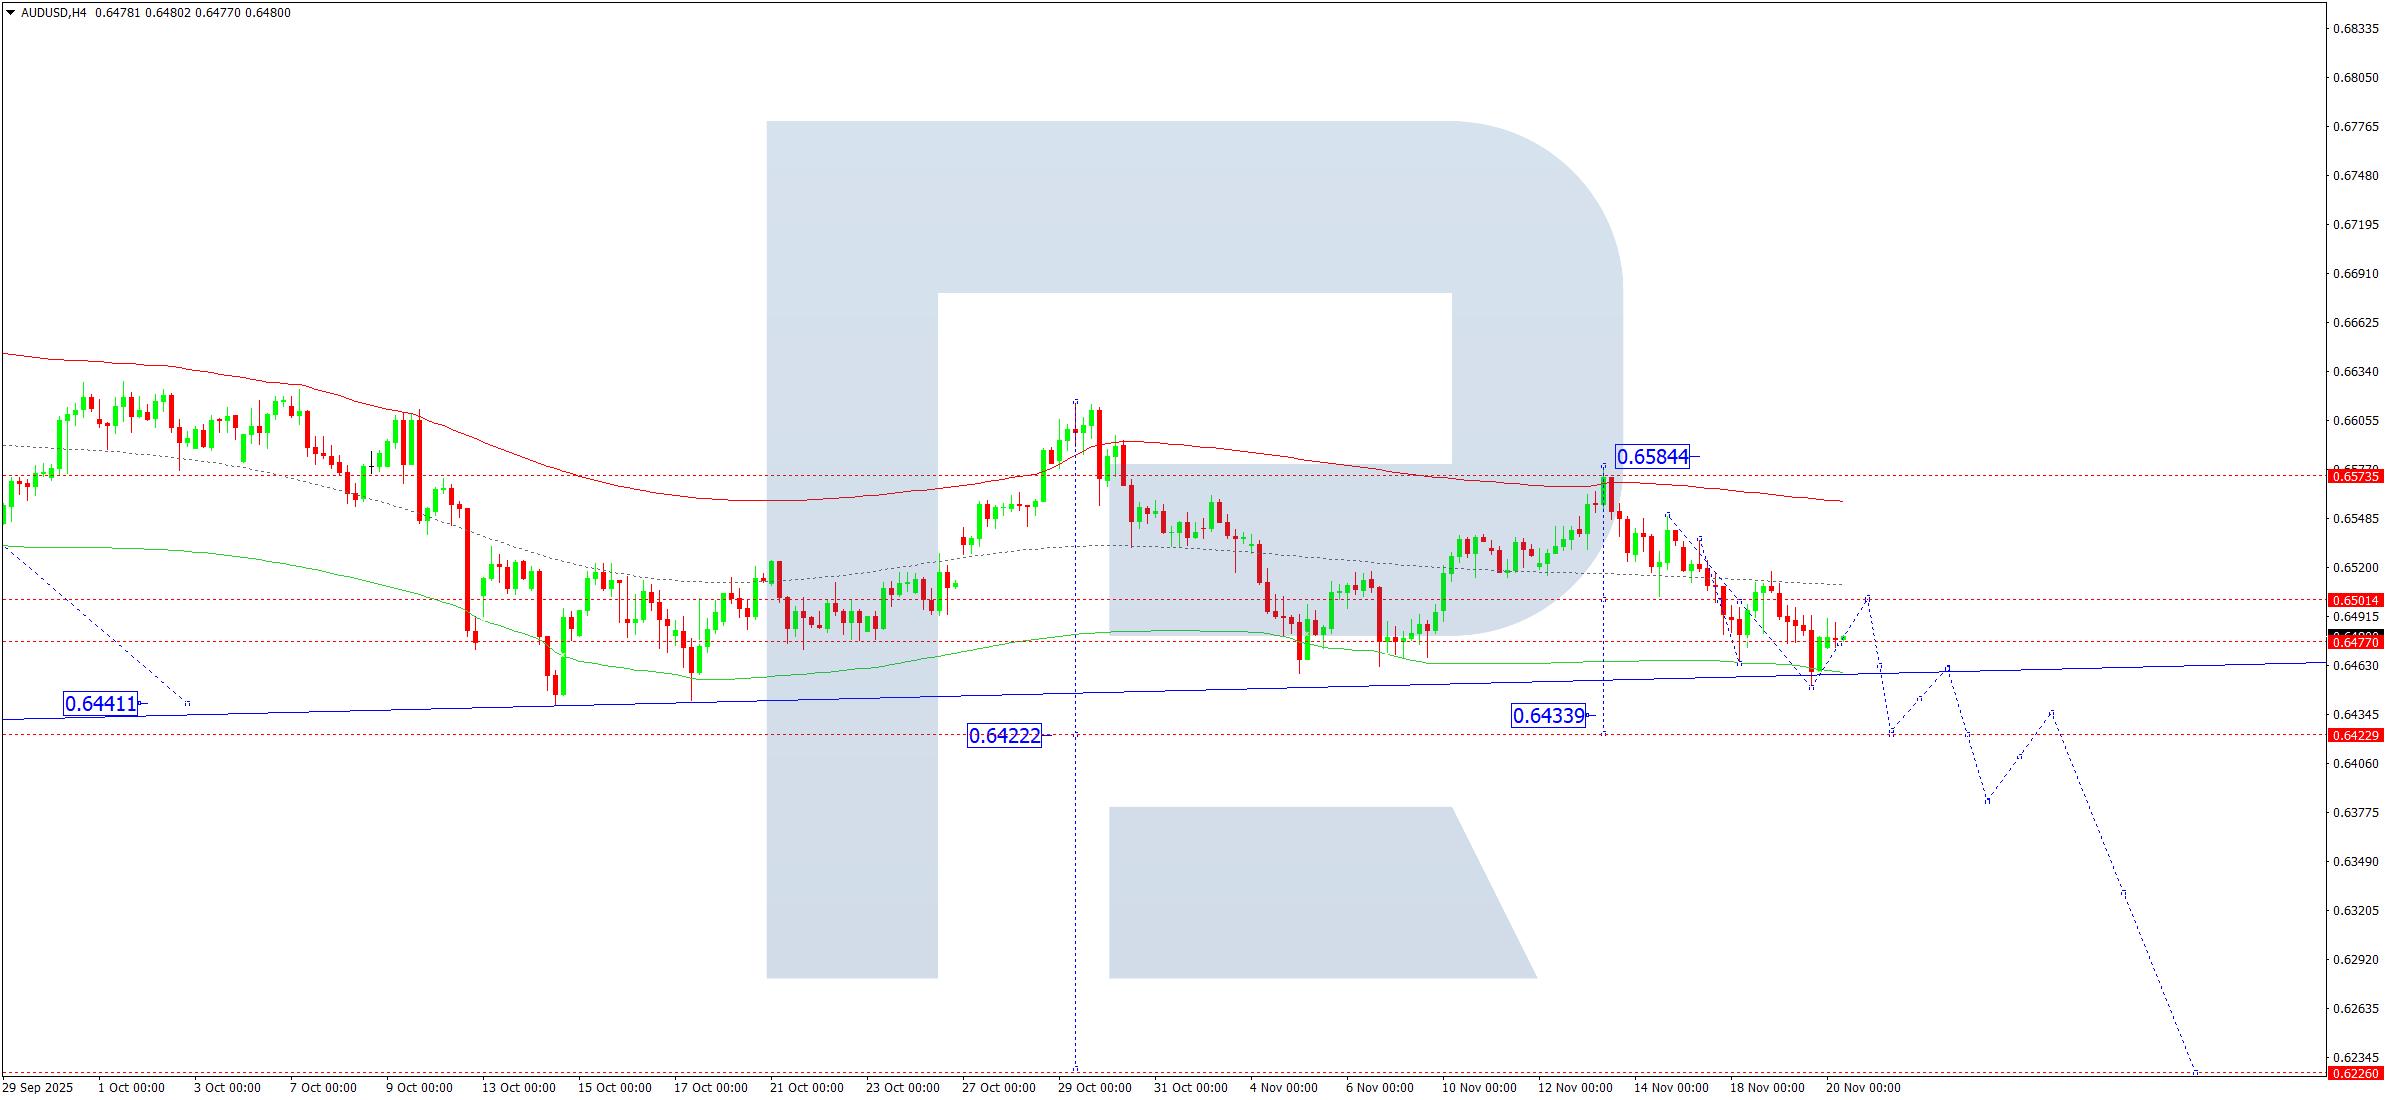
On the H4 chart of AUDUSD, the market completed the local target of the downward wave at 0.6450. On 20 November 2025, a correction towards 0.6477 formed. Currently, a consolidation range is developing around this level. An upward breakout may extend the correction towards 0.6500 (testing from below). Afterwards, a decline towards 0.6422 is expected as a local target.
The Elliott wave structure and the downward wave matrix in AUDUSD with a pivot point at 0.6570 confirm this scenario and act as the key elements in this wave structure. At the moment, the market completed a downward wave towards the lower boundary of the Price Envelope at 0.6450. Today, the scenario includes a rise towards its central line at 0.6500, followed by continued downward movement towards its lower boundary at 0.6422.
Technical indicators for today’s AUDUSD forecast suggest further decline towards 0.6422.
USDCAD forecast
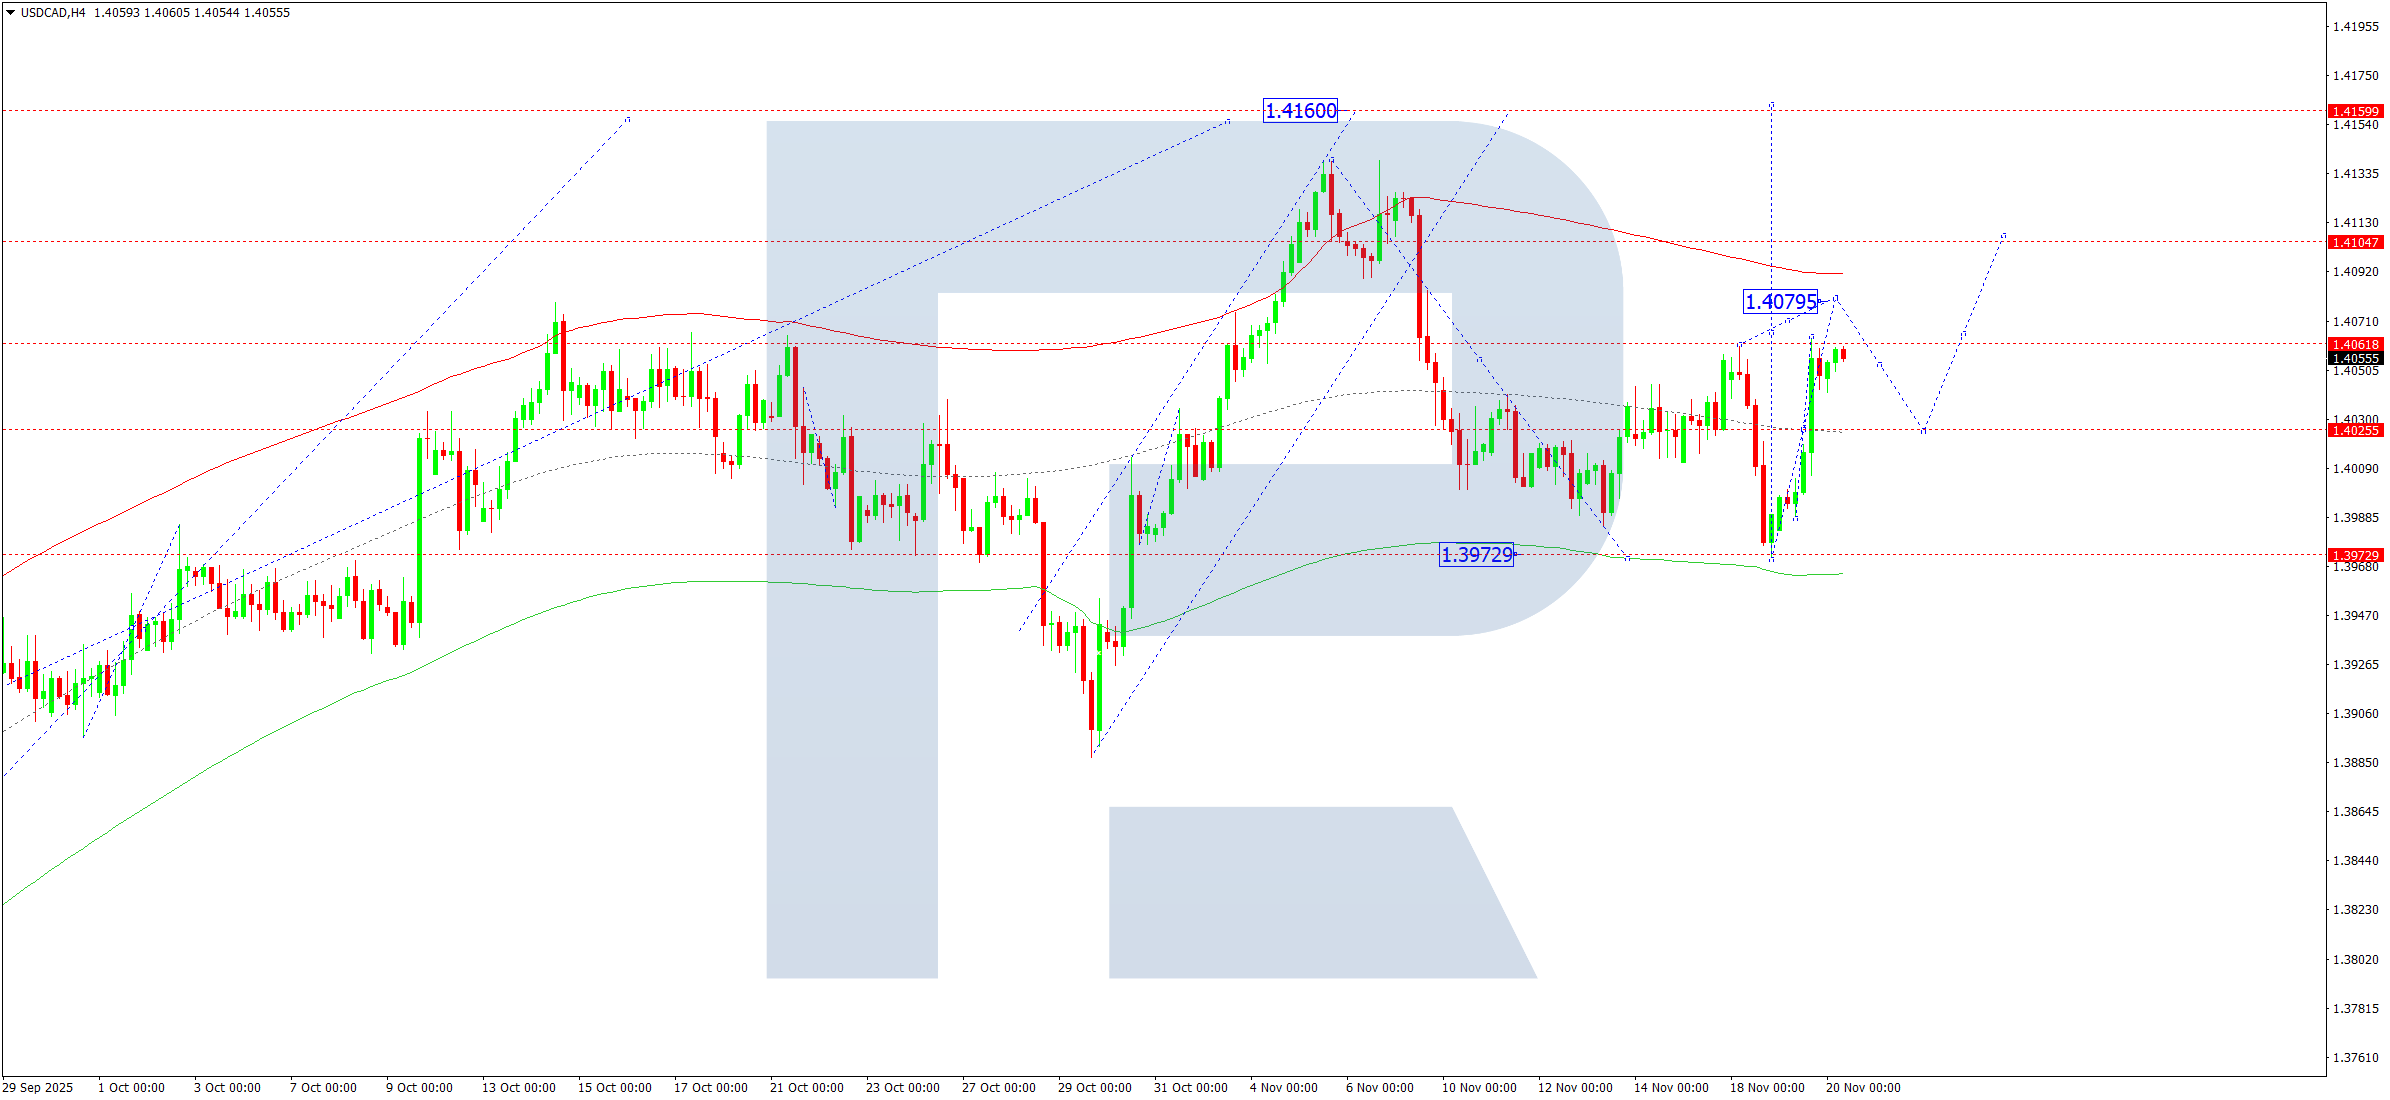
On the H4 chart of USDCAD, the market completed an upward wave towards 1.4064. On 20 November 2025, a correction towards 1.4025 may begin. Afterwards, a rise towards 1.4080 is likely, with the potential to develop the fifth wave structure towards 1.4160.
The Elliott wave structure and the upward wave matrix with a pivot point at 1.3939 confirm this scenario and act as the key elements for USDCAD in this wave structure. Currently, the market continues the wave towards the upper boundary of the Price Envelope at 1.4080. Today, the relevant scenario includes reaching this target level and forming a correction towards its central line at 1.4025, followed by a rise towards its upper boundary at 1.4140.
Technical indicators for today’s USDCAD forecast suggest continued upward movement towards 1.4080.
XAUUSD forecast
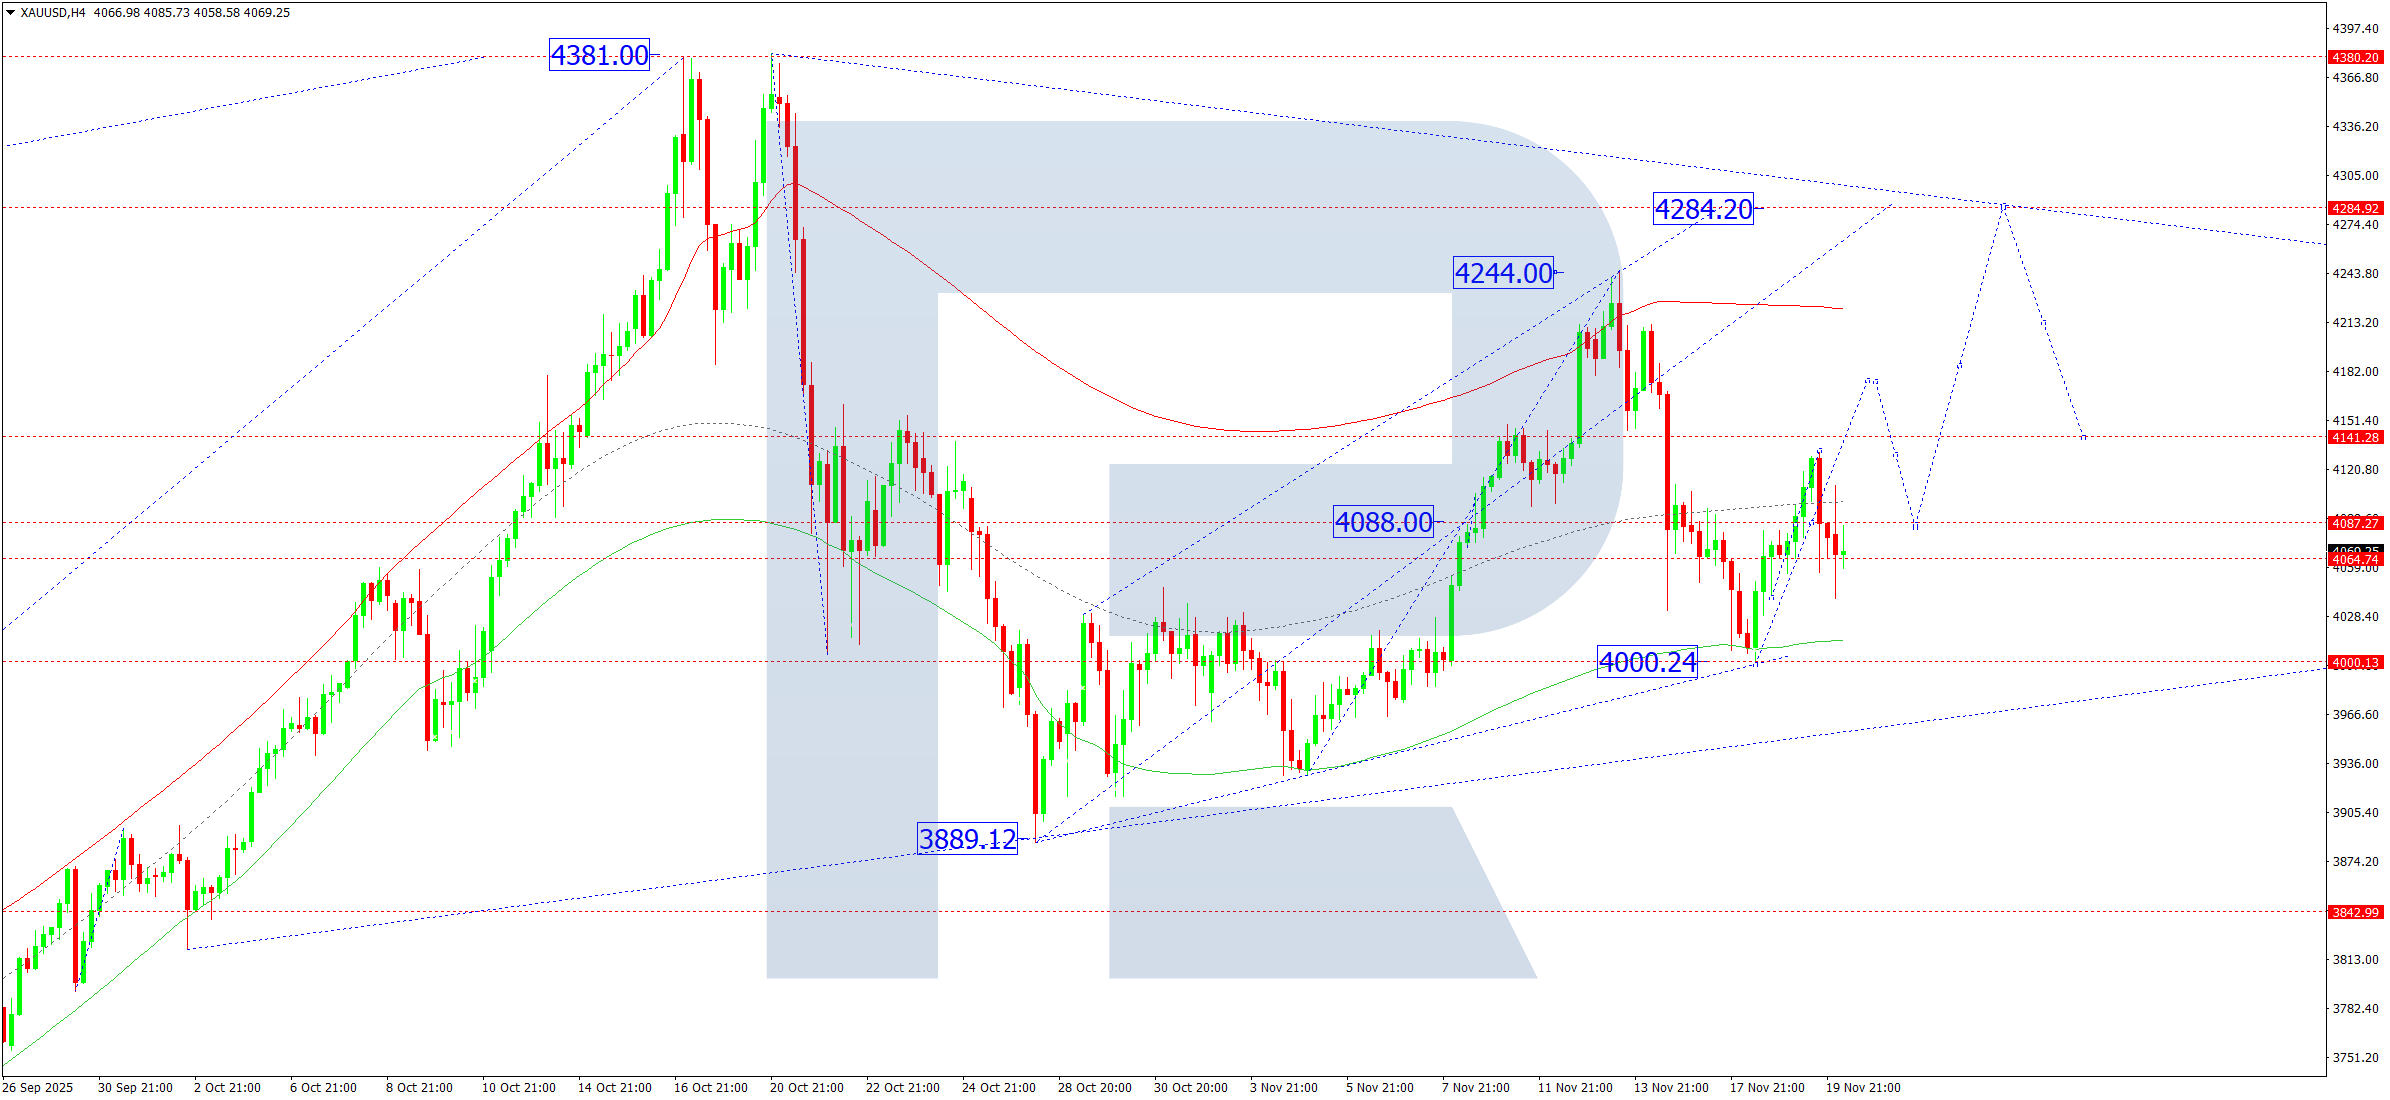
On the H4 chart of XAUUSD, the market forms a consolidation range around 4,088. On 20 November 2025, an upward impulse towards 4,180 remains possible as the first target within the structure of the upward wave towards 4,284.
The Elliott wave structure and the upward wave matrix with a pivot point at 4,088 confirm this scenario and act as the key elements in this wave. At the moment, the market continues developing the fifth upward wave towards the upper boundary of the Price Envelope at 4,284.
Technical indicators for today’s XAUUSD forecast point to an upward wave towards 4,180, 4,208 and 4,284.
Brent forecast
On the H4 chart of Brent crude, the market forms a consolidation range around 64.00. On 20 November 2025, an upward breakout from the range opens the potential for the continuation of the upward wave towards 66.10, with scope to extend the wave towards 70.00. A downward breakout from the range does not exclude the possibility of another corrective move towards 61.75. After this correction completes, a rise towards 70.00 becomes possible.
The Elliott wave structure and the upward wave matrix with a pivot point at 64.00 confirm this scenario and act as the key elements for Brent in this wave. Currently, the market is consolidating around the central line of the Price Envelope at 64.00. Today, a downward breakout opens the possibility of a continued correction towards its lower boundary at 61.75. An upward breakout opens the potential for an upward wave towards its upper boundary at 66.10.
Technical indicators in today’s Brent forecast suggest a decline towards 61.75 and a rise towards 66.10.

Forecasts presented in this section only reflect the author’s private opinion and should not be considered as guidance for trading. RoboForex bears no responsibility for trading results based on trading recommendations described in these analytical reviews.