Daily technical analysis and forecast for 19 November 2025
Here is a detailed daily technical analysis and forecast for EURUSD, USDJPY, GBPUSD, AUDUSD, USDCAD, XAUUSD and Brent for 19 November 2025.
EURUSD forecast
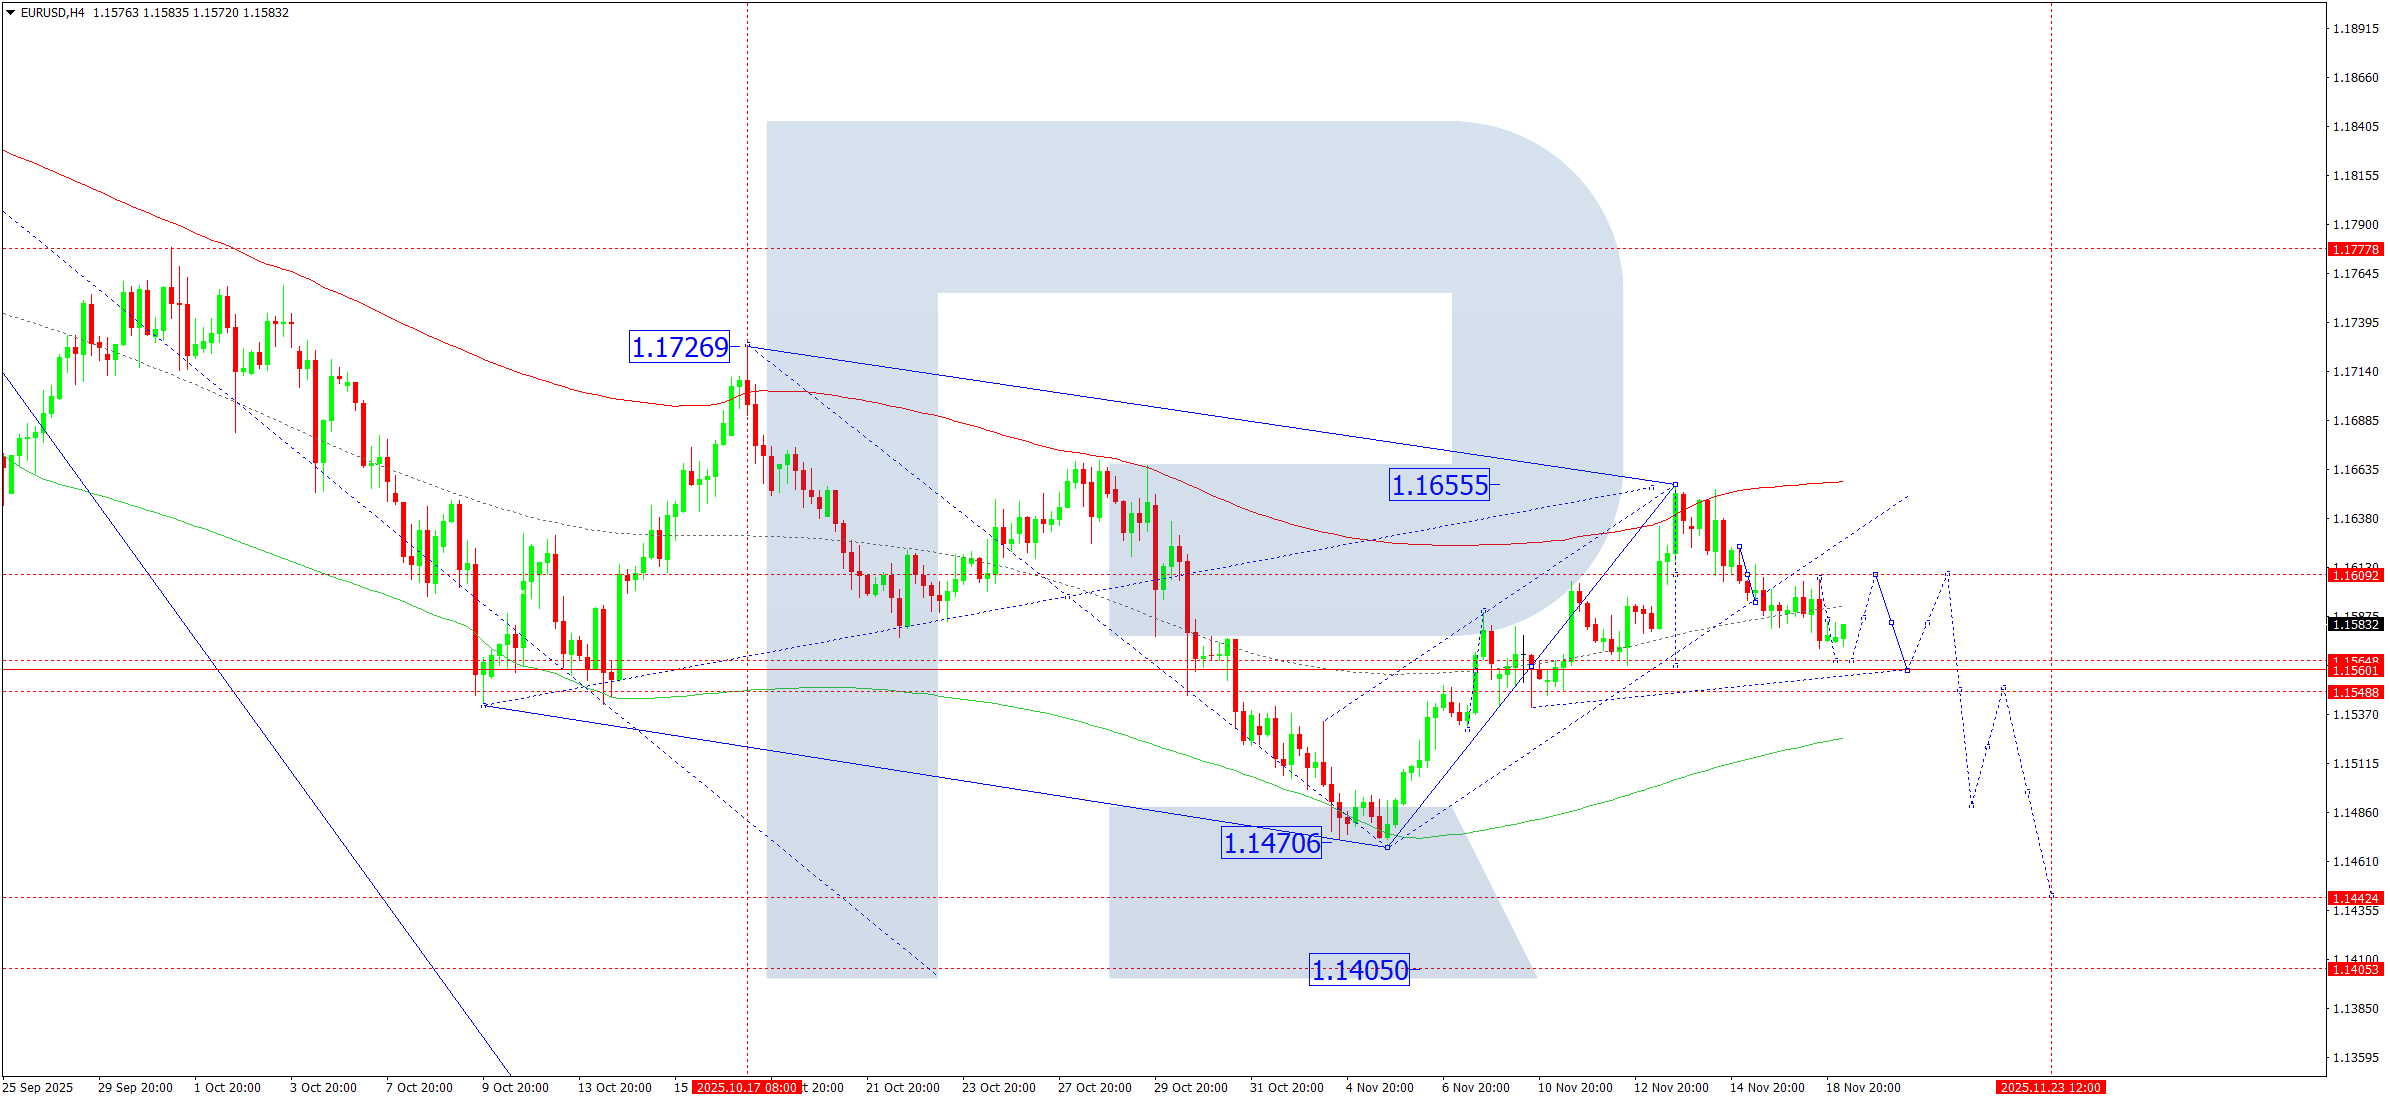
On the EURUSD H4 chart, the market formed a narrow consolidation range around 1.1608 and broke downwards out of the range. The upward wave channel has practically broken. On 19 November 2025, part of the next downward impulse towards 1.1570 has already formed. At the moment, the market is developing a narrow consolidation range above this level. The range could expand downwards to 1.1565 and upwards to 1.1600 before the price drops to 1.1560. This is the first target within the structure of the downward wave towards 1.1405.
The Elliott wave structure and the downward wave matrix with a pivot point at 1.1660 confirm this scenario and act as the key elements in the EURUSD wave structure. At the moment, the market forms a downward wave towards the central line of the Price Envelope at 1.1560. Today, a move to this level and a corrective leg towards 1.1606 are possible. Afterwards, the scenario includes a downward wave towards the lower boundary of the Price Envelope at 1.1515, with the potential to extend the trend to 1.1405.
Technical indicators for today’s EURUSD forecast suggest a decline towards 1.1560.
USDJPY forecast
On the USDJPY H4 chart, the market completed an upward wave towards 155.70. On 19 November 2025, a compact consolidation range may form below this level. A breakout downwards from the range brings a correction towards 154.66 into focus at least. Afterwards, an upward wave towards 156.55 becomes possible as a local target. Later, a correction towards 153.00 is not excluded.
The Elliott wave structure and the upward wave matrix with a pivot point at 153.00 confirm this scenario and act as the key elements in this wave structure. At the moment, the market has completed an upward wave towards 155.70 and is forming a consolidation range below this level. A corrective move towards the central line of the Price Envelope at 154.66 is possible. Afterwards, a rise towards its upper boundary at 156.55 remains likely.
Technical indicators for today’s USDJPY forecast suggest a decline towards 154.66, followed by a rise towards 156.55.

GBPUSD forecast
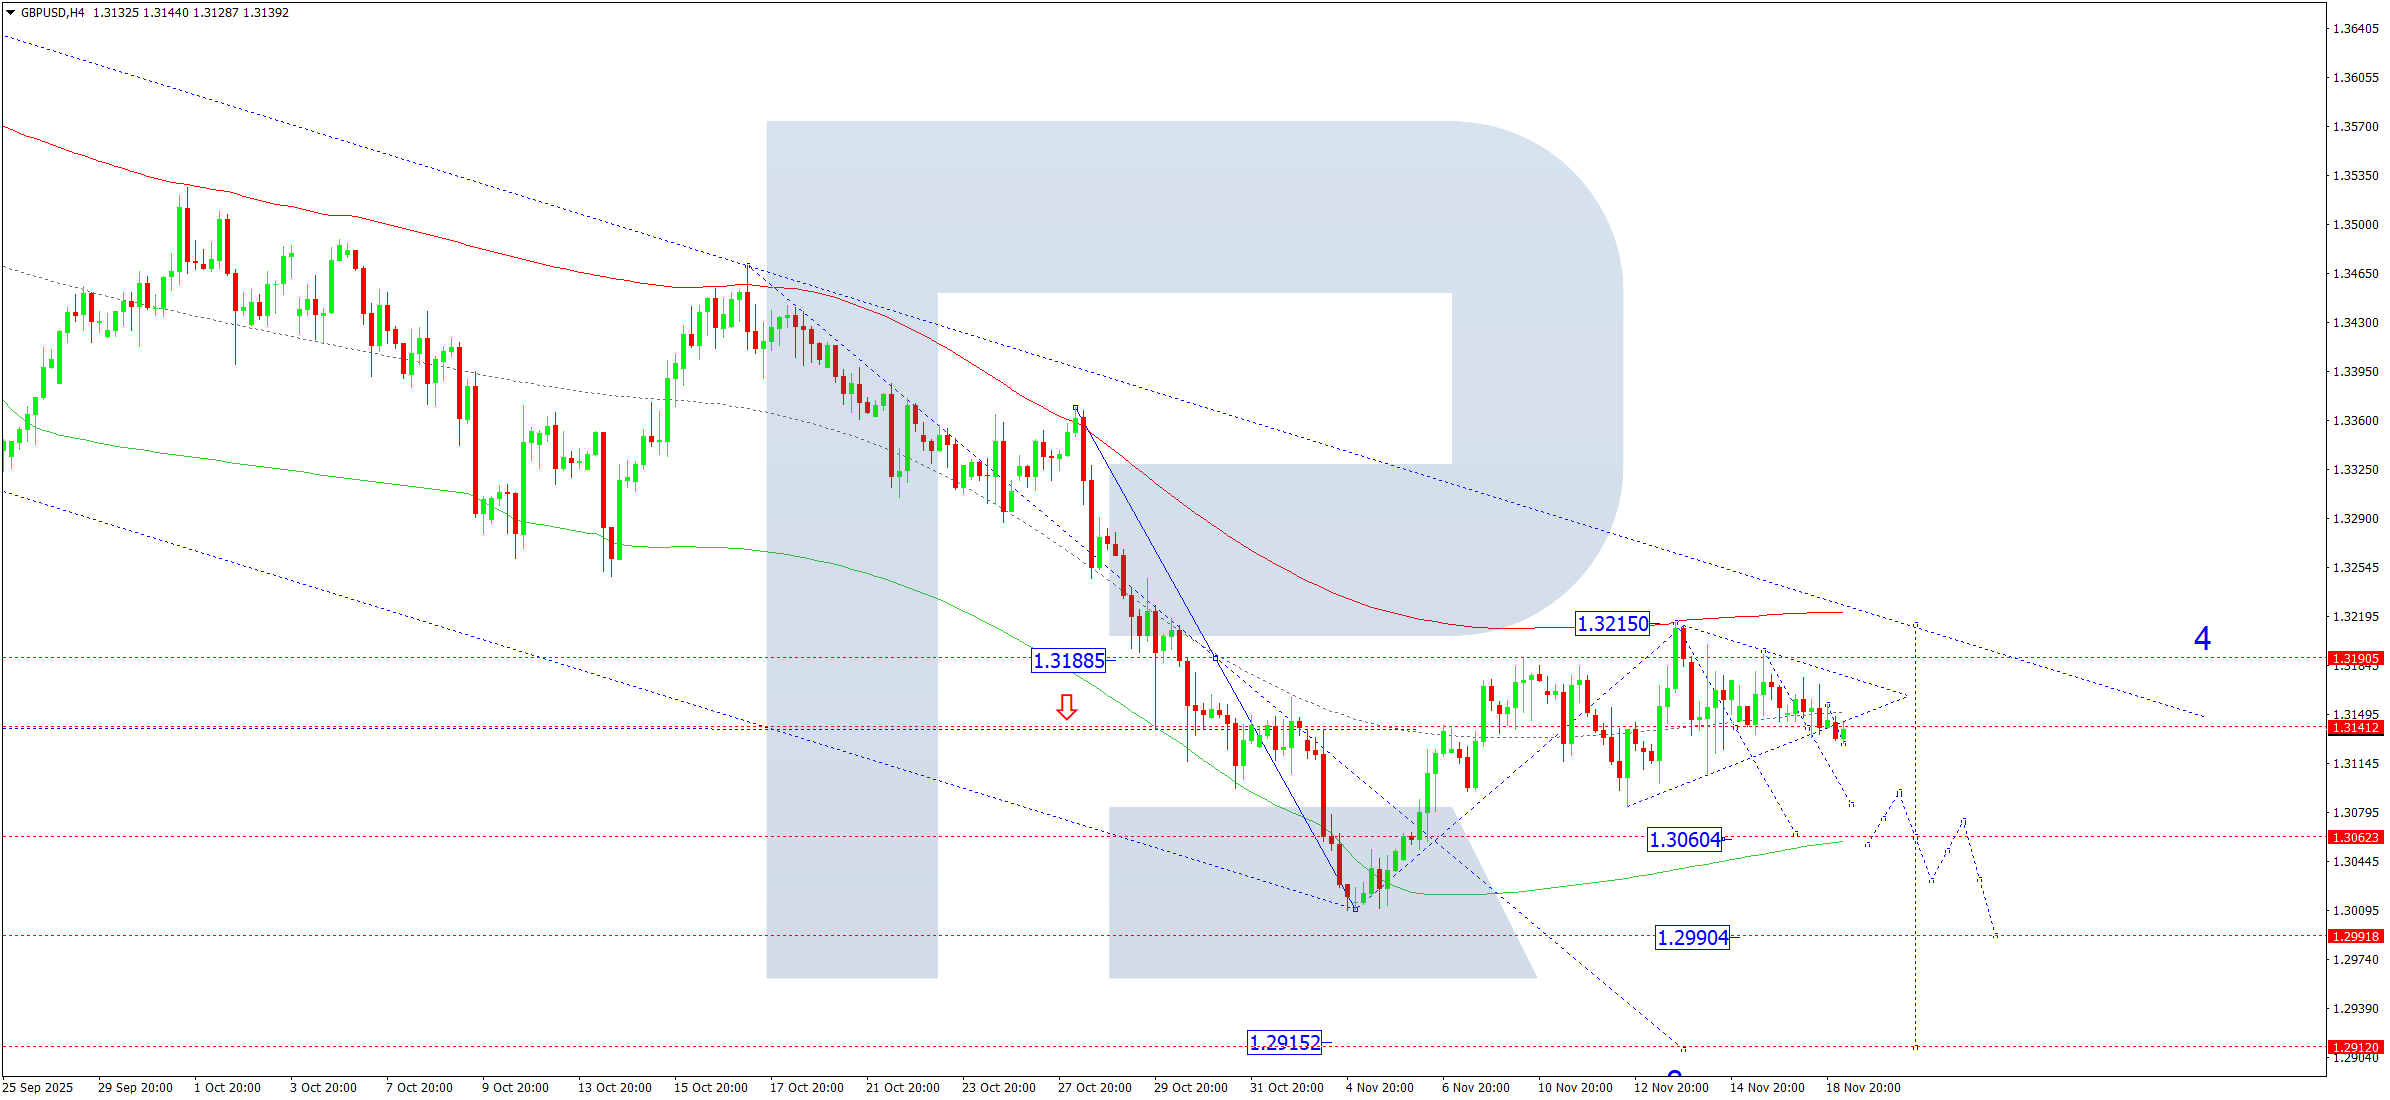
On the GBPUSD H4 chart, the market continues to develop a consolidation range around 1.3140. On 19 November 2025, a breakout downwards from this range and a new downward impulse towards 1.3060 are expected. A breakout below 1.3060 opens the potential for the continuation of the wave towards 1.2990, with the potential to extend the trend to 1.2915 as a local target.
The Elliott wave structure and the downward wave matrix with a pivot point at 1.3188 confirm this scenario and act as the key elements in this wave structure. At the moment, the market completed a correction wave towards the upper boundary of the Price Envelope at 1.3215 (testing from below). Today, the downward wave could continue towards its lower boundary at 1.3060.
Technical indicators for today’s GBPUSD forecast suggest the beginning of a downward wave towards 1.3060.
AUDUSD forecast
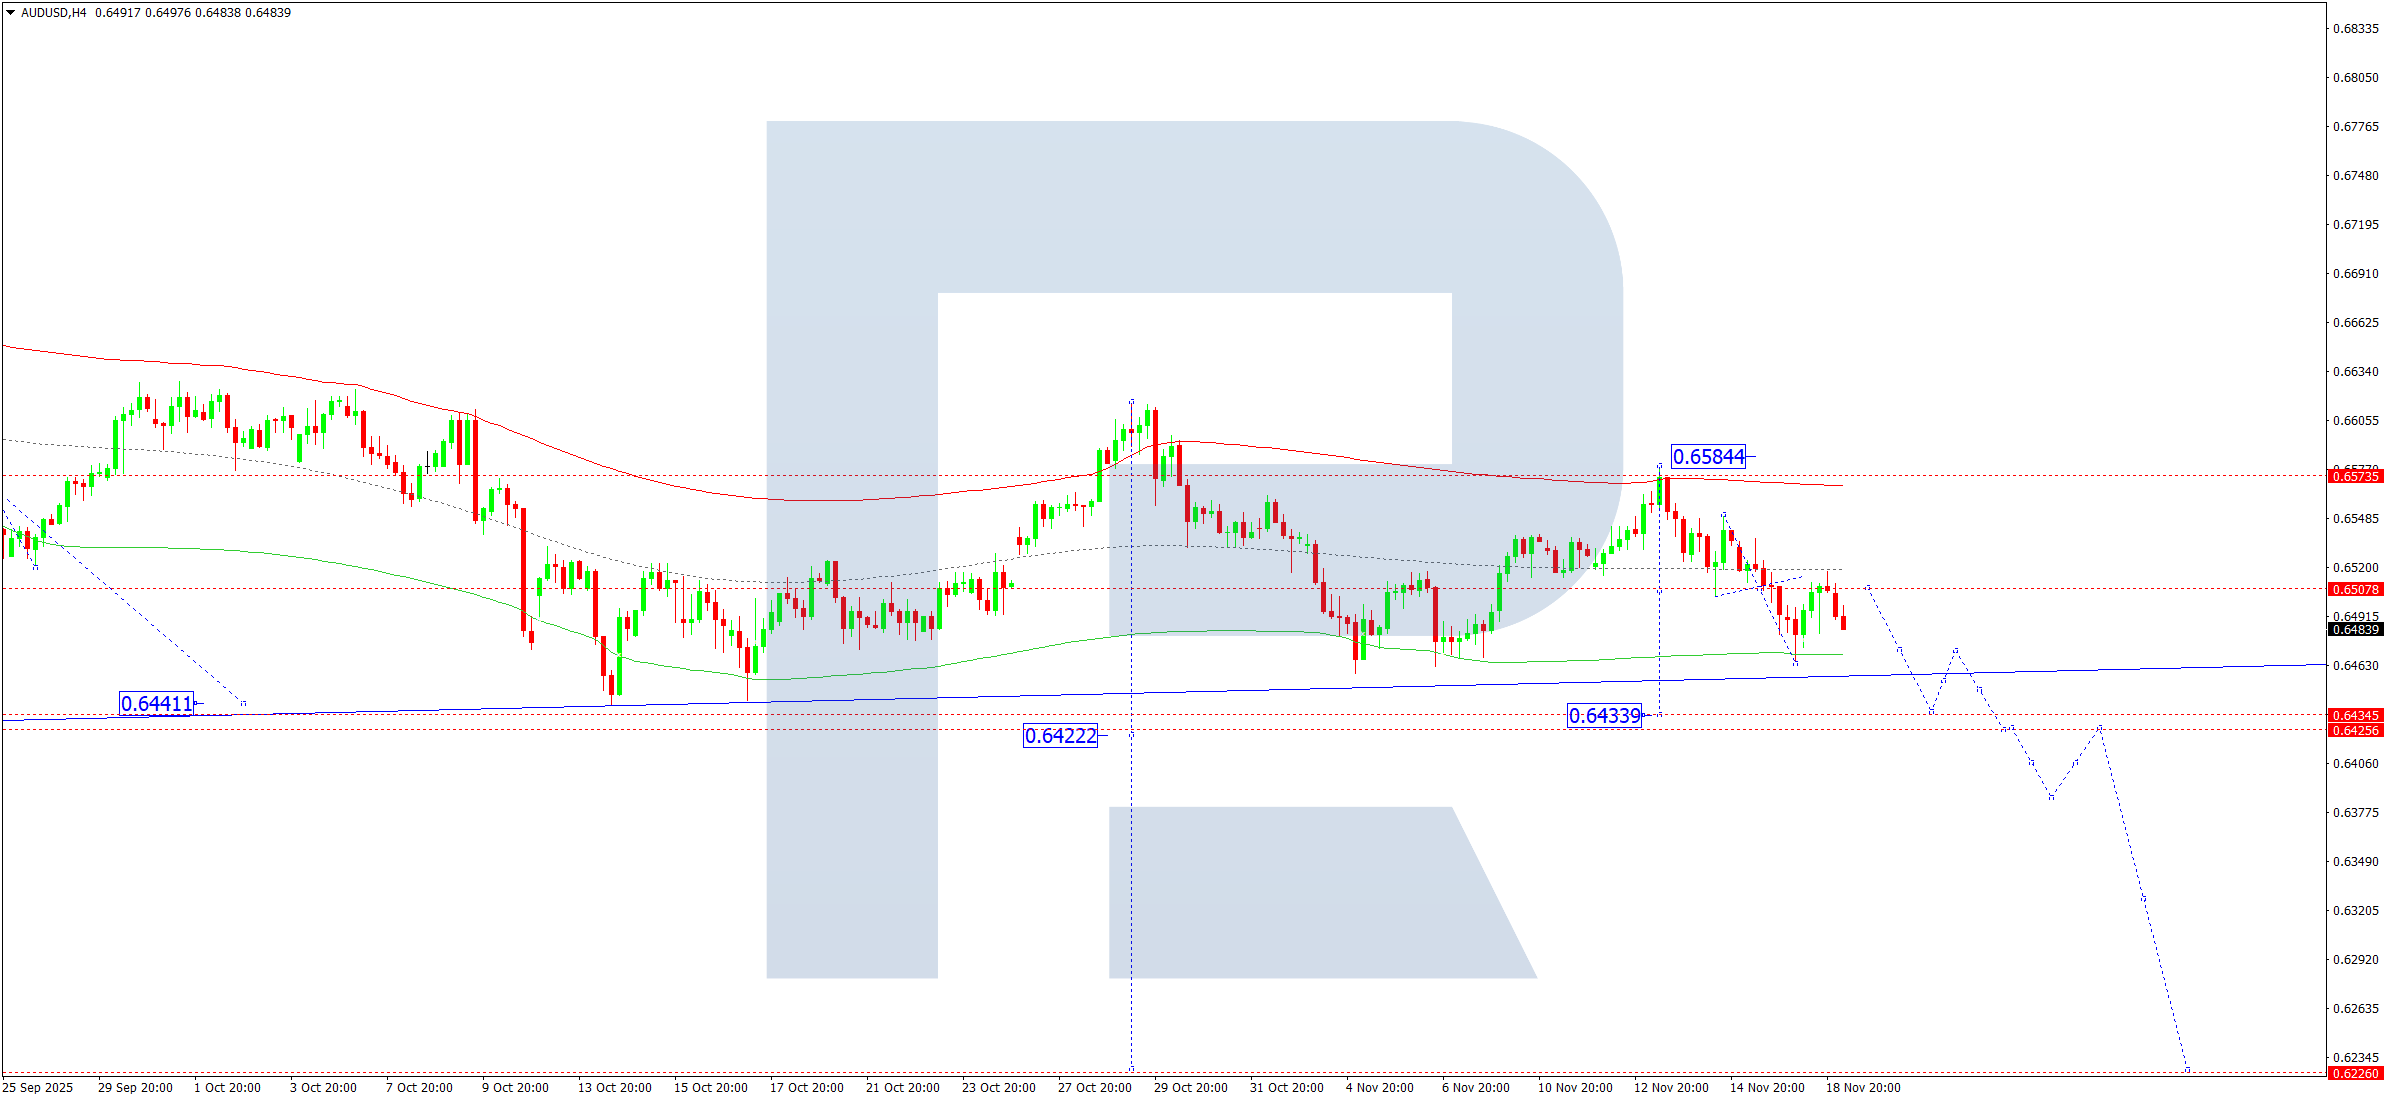
On the AUDUSD H4 chart, the market completed a correction towards 0.6560. On 19 November 2025, the market continues to develop a downward wave towards 0.6434 as a local, estimated target. Afterwards, a compact consolidation range may form around this level. A breakout downwards would open the potential for the continuation of the third downward wave along the trend towards 0.6222.
The Elliott wave structure and the downward wave matrix in AUDUSD with a pivot point at 0.6570 confirm this scenario and act as the key elements in this wave structure. At the moment, the market completed a correction wave towards the upper boundary of the Price Envelope at 0.6584. Today, the outlook includes a continued downward movement towards its lower boundary at 0.6434.
Technical indicators for today’s AUDUSD forecast suggest a continuation of the downward wave towards 0.6434.
USDCAD forecast
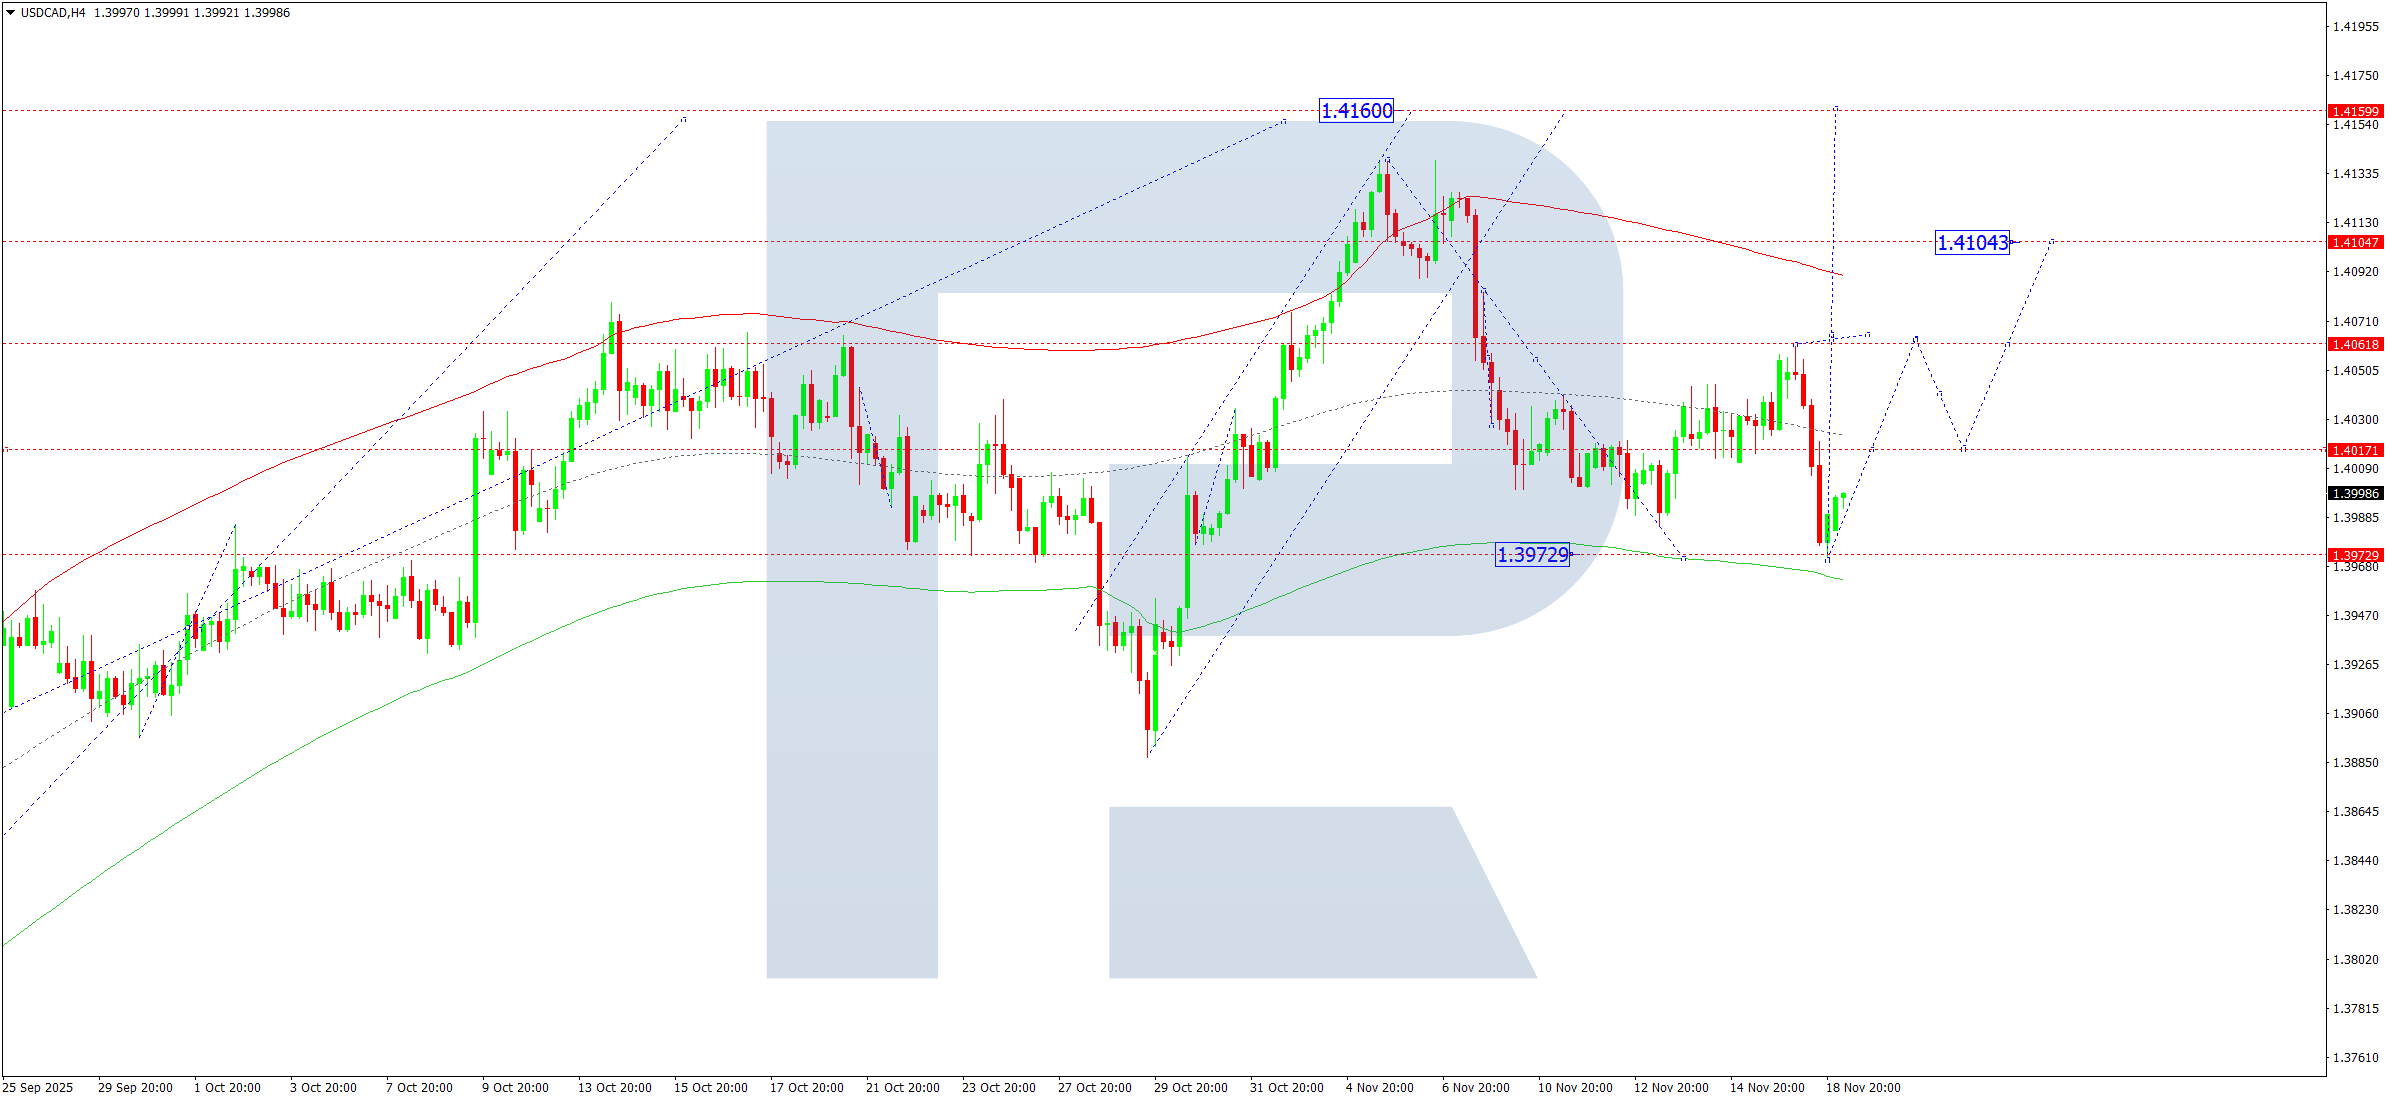
On the USDCAD H4 chart, the market completed a downward wave towards 1.3970. On 19 November 2025, a rising wave towards 1.4017 may start. A breakout above this level would open the potential for the continuation of the wave towards 1.4062. This is the first target within the structure of the upward wave towards 1.4160.
The Elliott wave structure and the upward wave matrix with a pivot point at 1.3939 confirm this scenario and act as the key elements for USDCAD in this wave structure. At the moment, the market continues its correction towards the lower boundary of the Price Envelope at 1.3973. Today, the relevant scenario includes the beginning of a rising wave towards its upper boundary at 1.4160.
Technical indicators for today’s USDCAD forecast suggest a continued upward movement towards 1.4160.
XAUUSD forecast
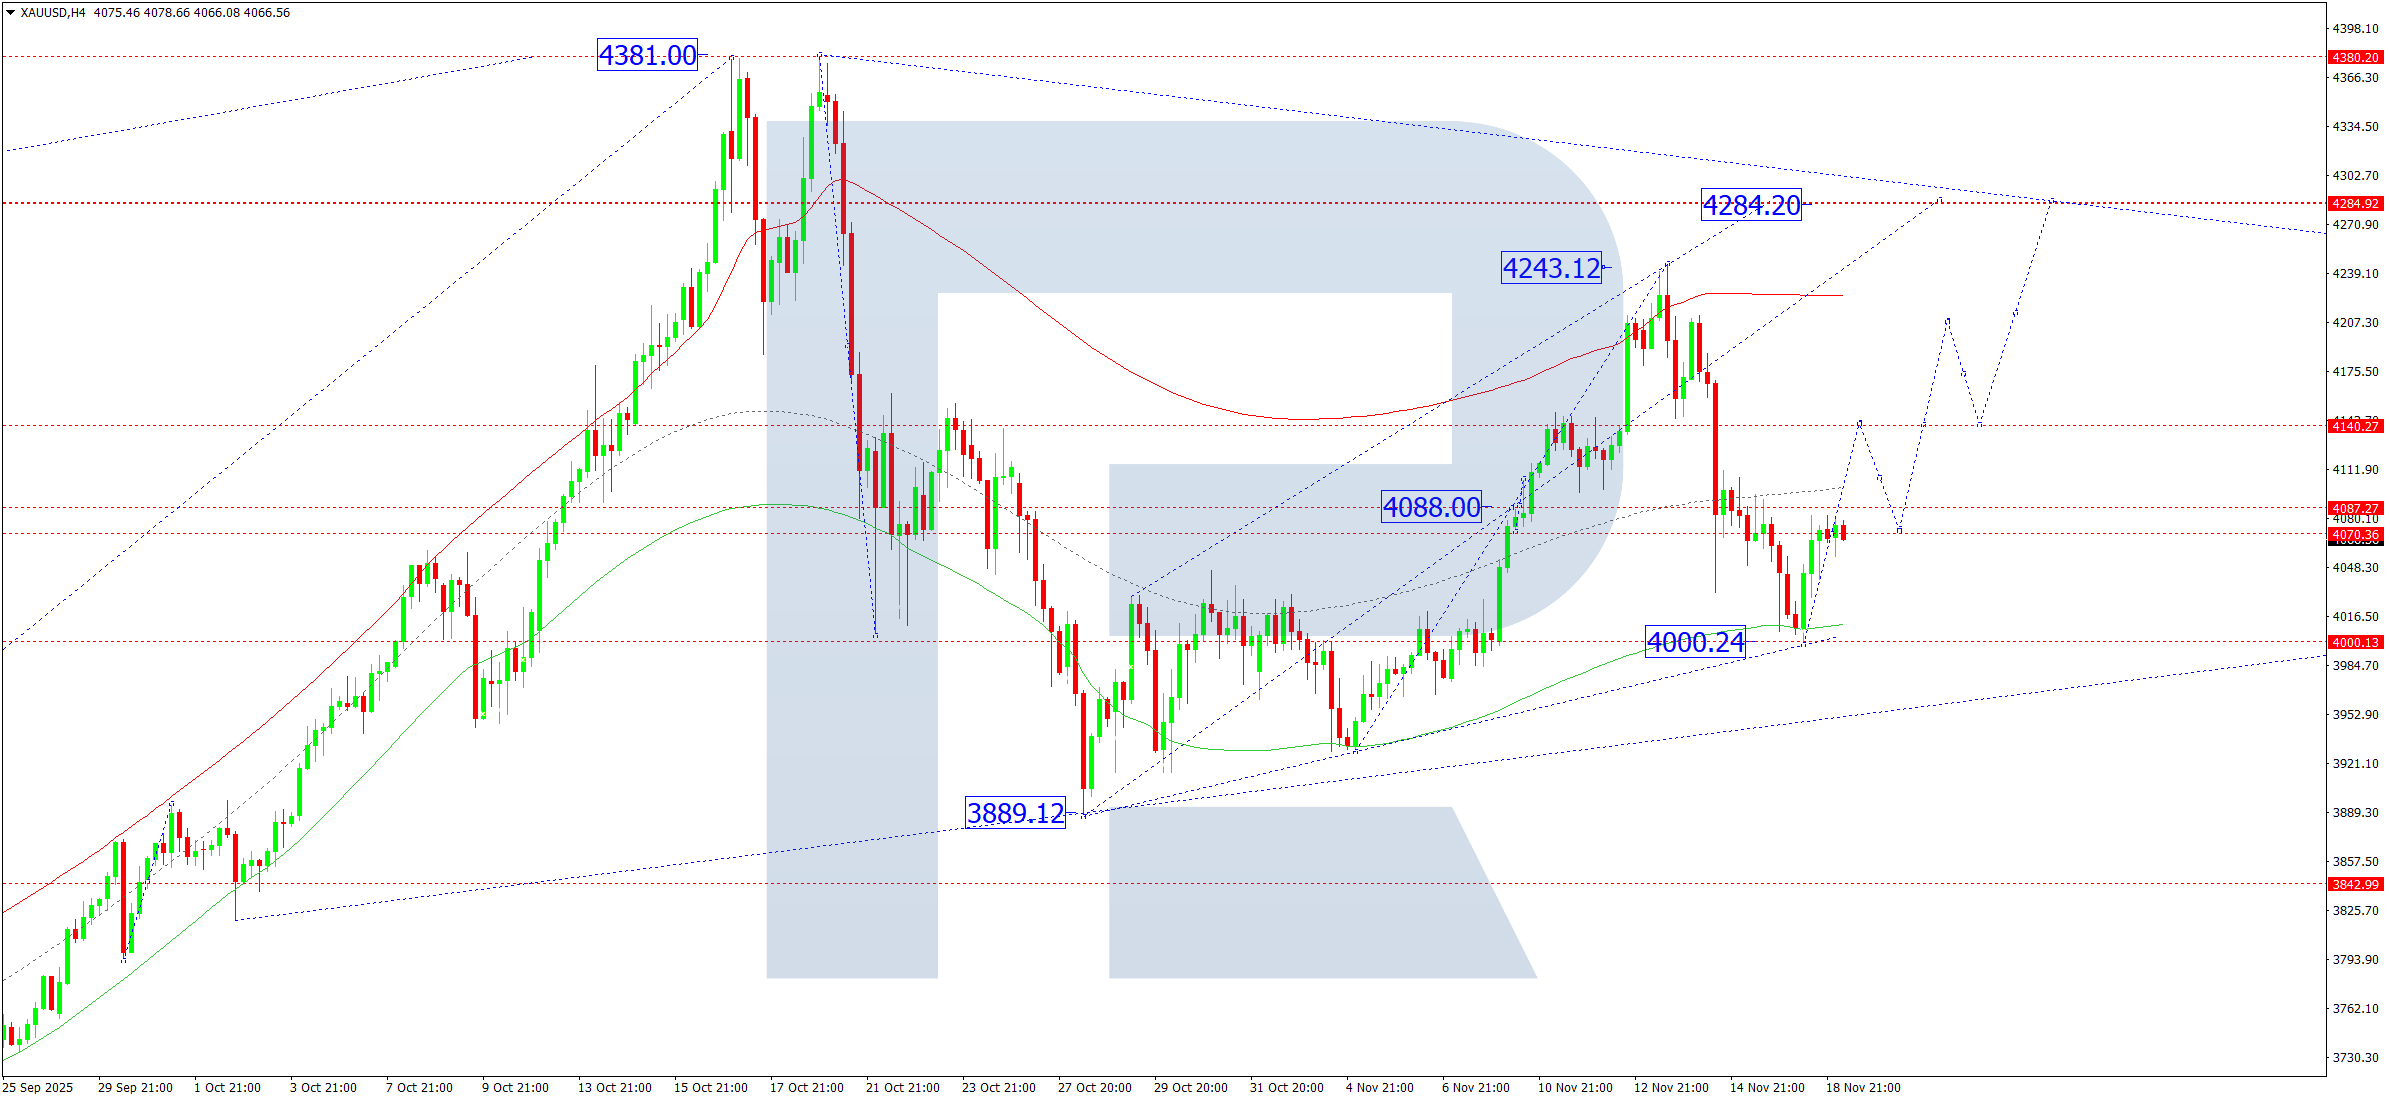
On the XAUUSD H4 chart, the market completed an upward impulse towards 4,070. On 19 November 2025, a compact consolidation range may form around this level. A breakout upwards from the range would open the potential for the continuation of the upward impulse towards 4,140 as the first target within the structure of the rising wave towards 4,284.
The Elliott wave structure and the upward wave matrix with a pivot point at 4,088 confirm this scenario and act as the key elements for XAUUSD in this wave. At the moment, the market started to develop the fifth upward wave towards the upper boundary of the Price Envelope at 4,284.
Technical indicators for today’s XAUUSD forecast suggest an upward wave towards 4,140, 4,208 and 4,284.
Brent forecast
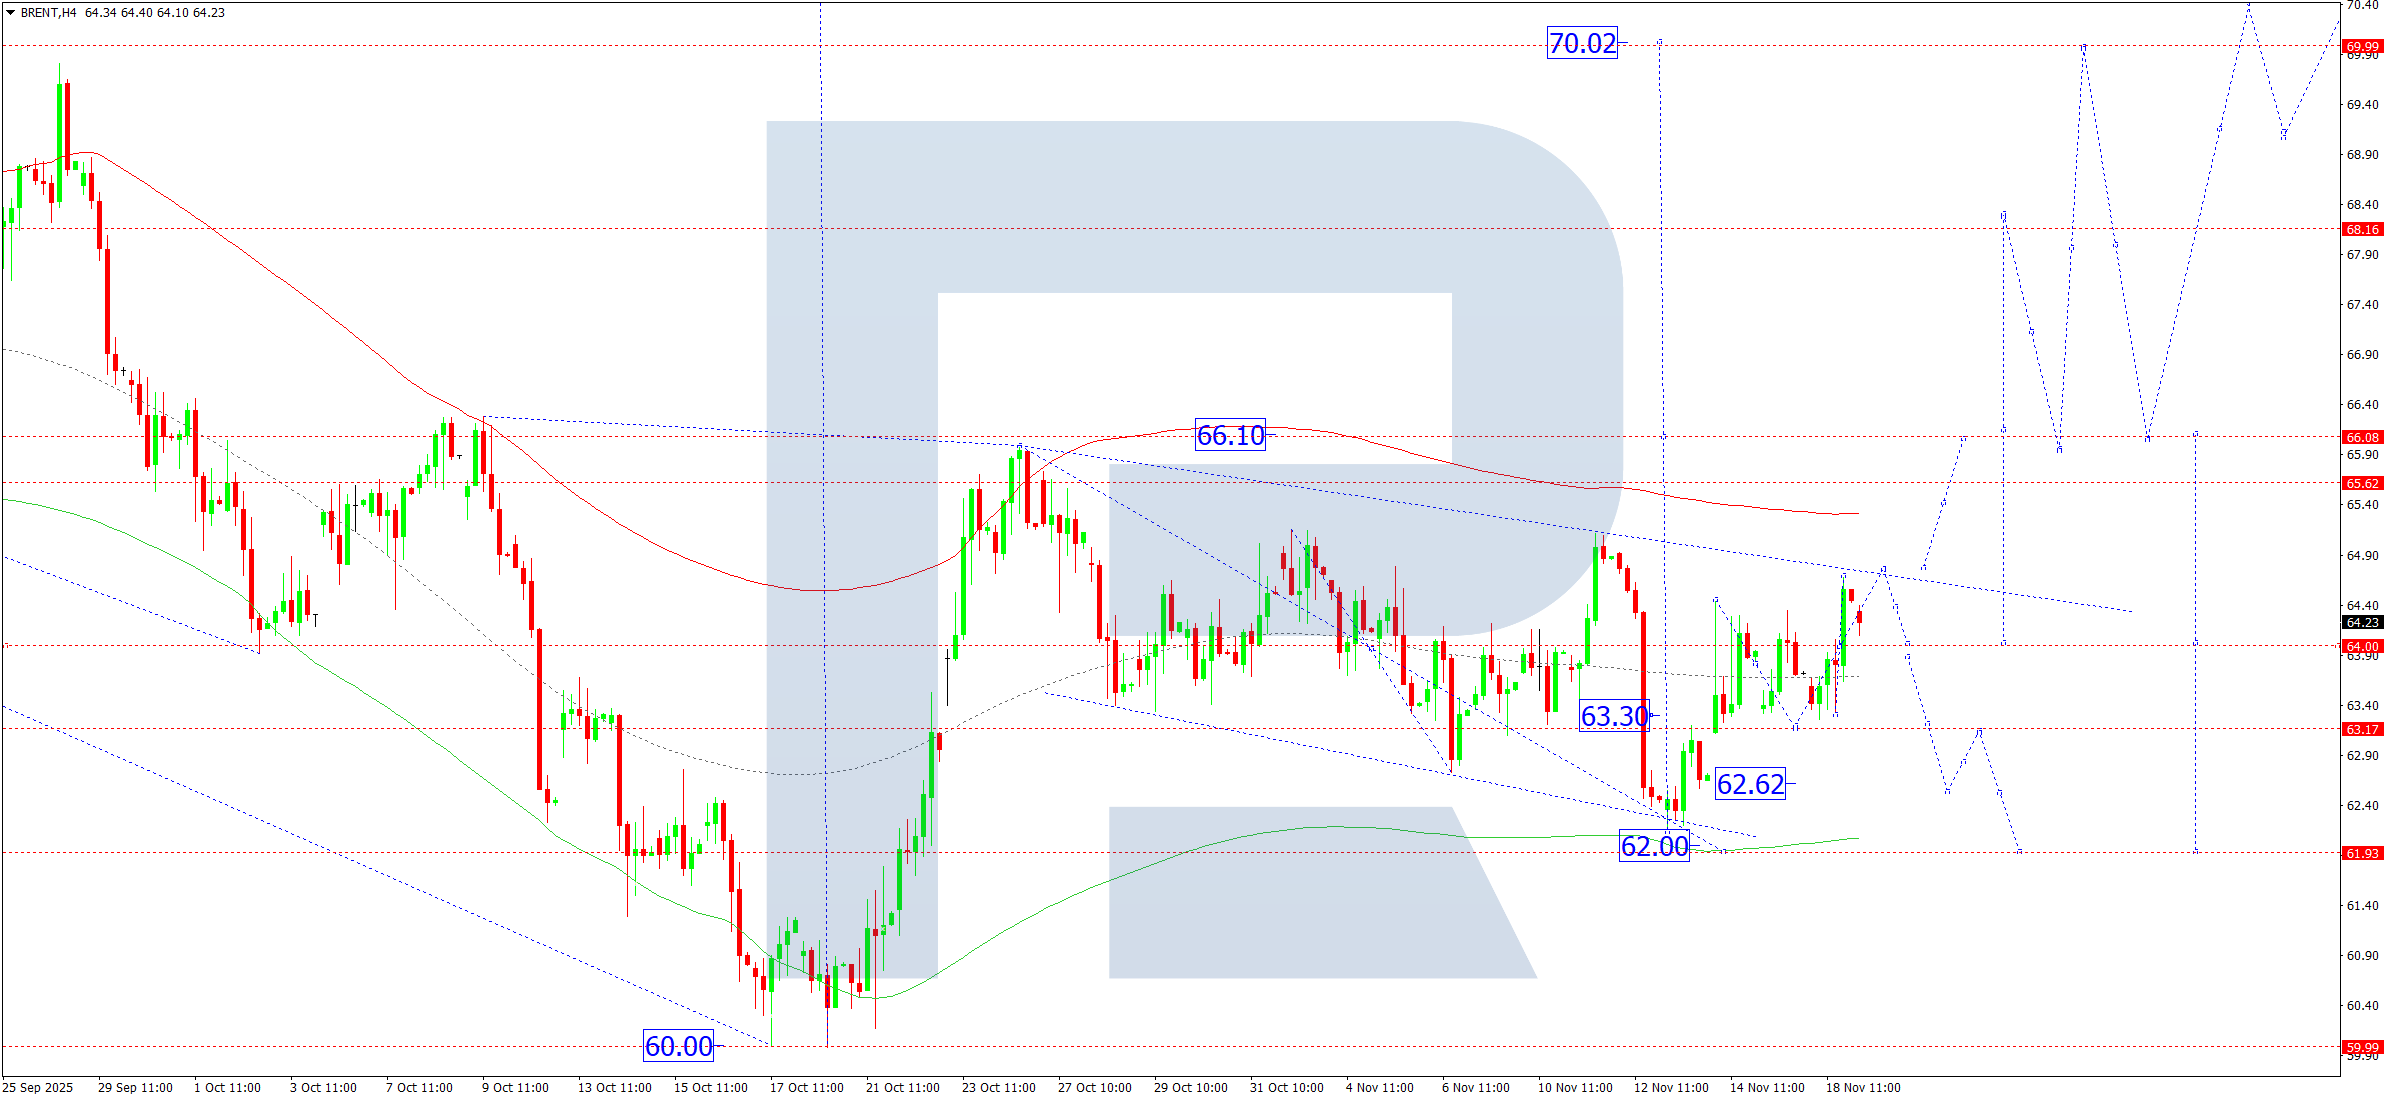
On the Brent H4 chart, the market forms a consolidation range above 64.00. On 19 November 2025, the range could expand upwards to 64.75. A breakout upwards from the range opens the potential for the continuation of the rising wave towards 66.10, with the potential to develop the wave towards 70.00. A breakout downwards from the range keeps open the possibility of another downward corrective move towards 62.00. After this correction completes, a rise towards 70.00 remains possible.
The Elliott wave structure and the upward wave matrix with a pivot point at 64.00 confirm this scenario and act as the key elements for Brent in this wave. At the moment, the market continues to develop a consolidation range around the central line of the Price Envelope at 64.00. Today, a downward breakout from the range suggests a continued correction towards its lower boundary at 62.00. A breakout upwards opens the potential for an upward wave towards its upper boundary at 66.10.
Technical indicators in today’s Brent forecast suggest a rise towards 66.10.
Forecasts presented in this section only reflect the author’s private opinion and should not be considered as guidance for trading. RoboForex bears no responsibility for trading results based on trading recommendations described in these analytical reviews.