Daily technical analysis and forecast for 18 November 2025
Here is a detailed daily technical analysis and forecast for EURUSD, USDJPY, GBPUSD, AUDUSD, USDCAD, XAUUSD and Brent for 18 November 2025.
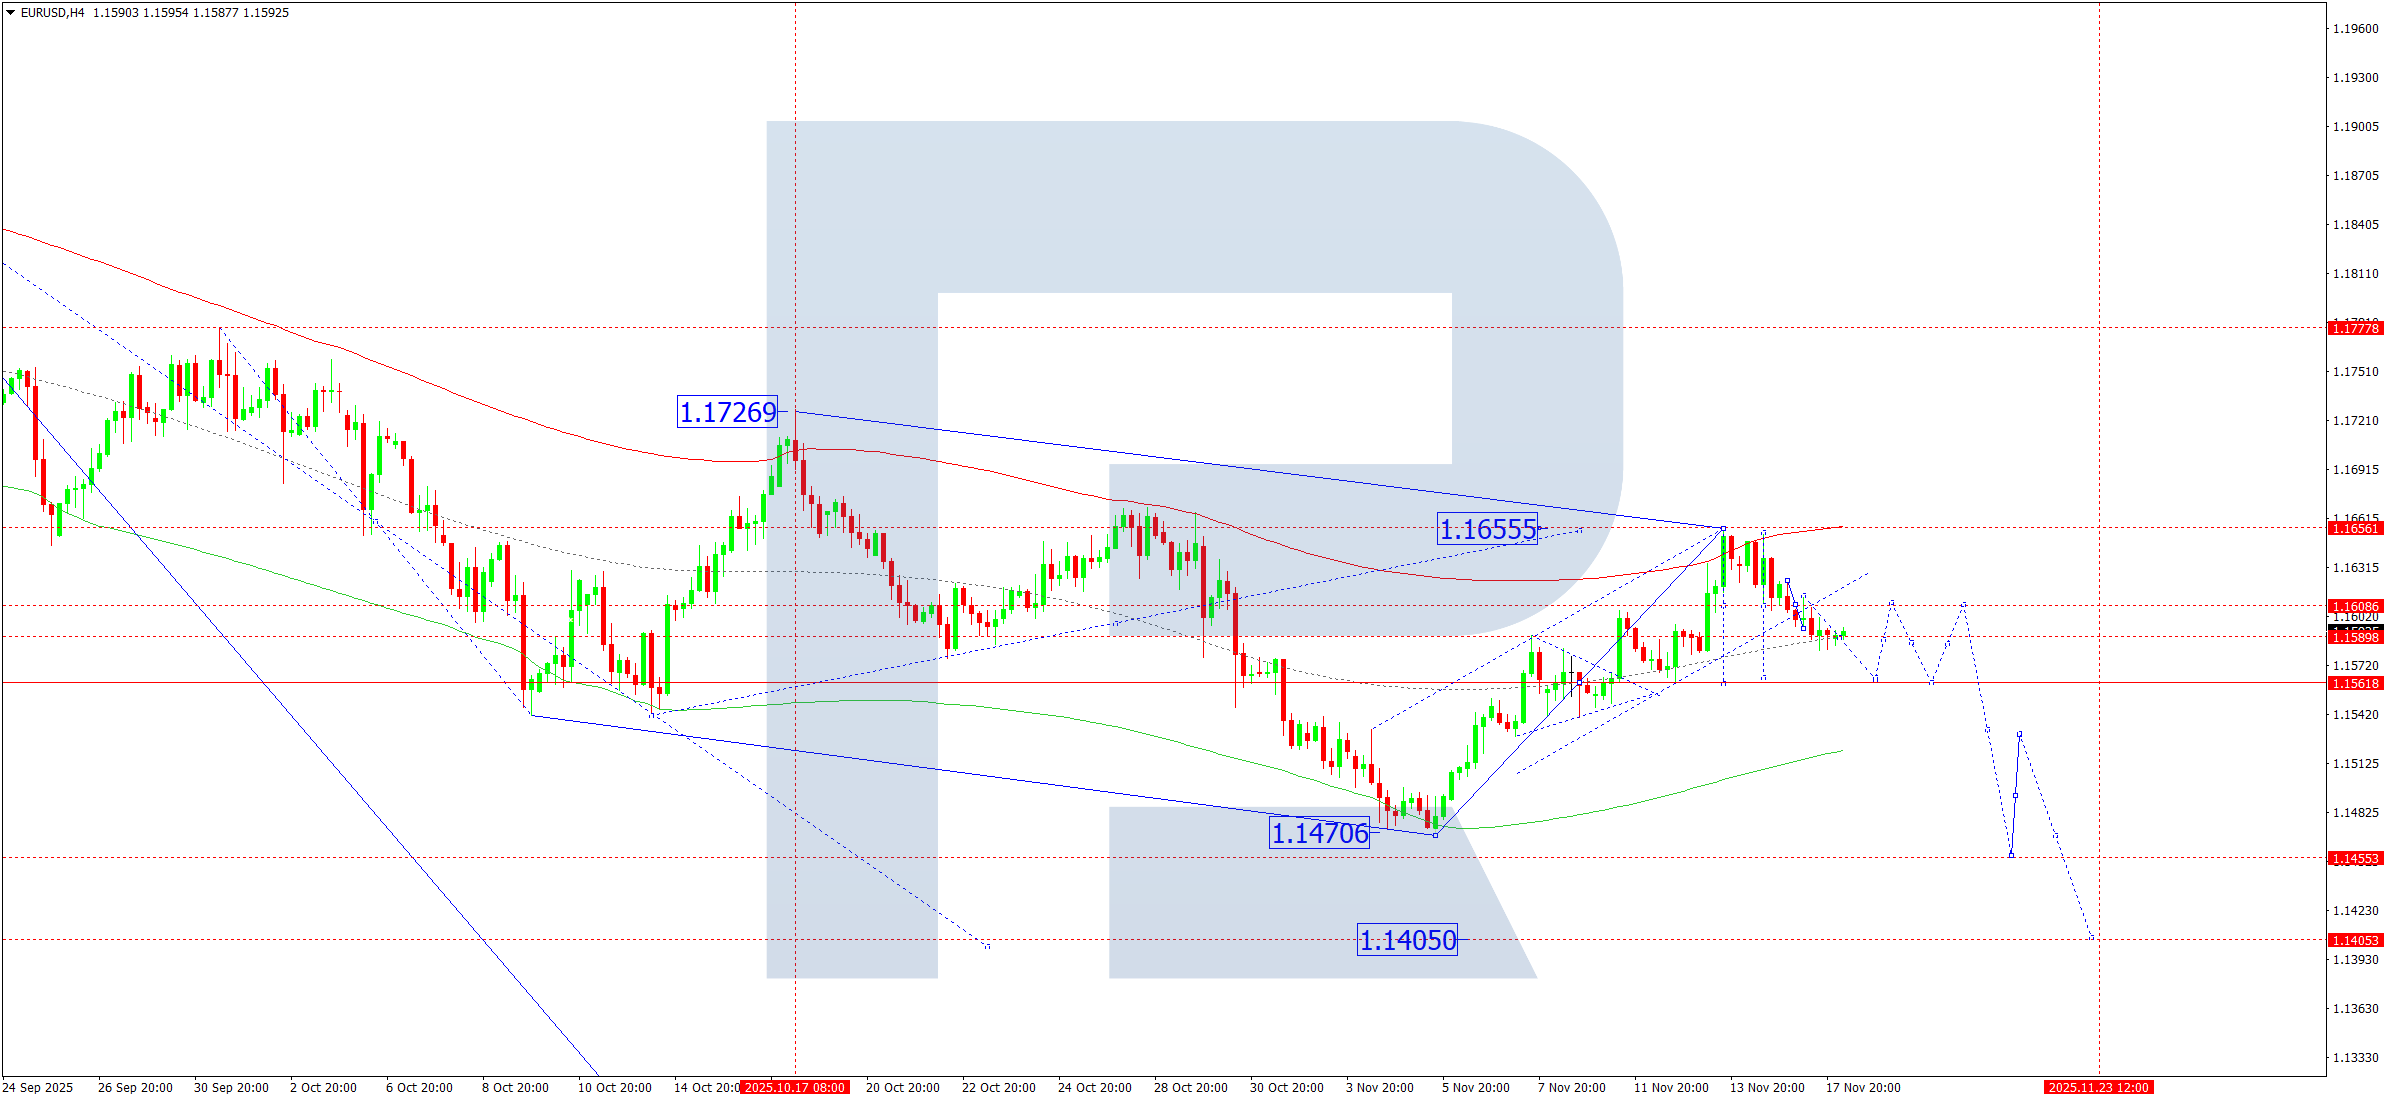
EURUSD forecast
On the H4 chart of EURUSD, the market formed a narrow consolidation range around 1.1608 and broke downwards out of the range. This move effectively broke the rising wave channel. On 18 November 2025, the market forms the second part of the downward impulse towards 1.1562 as the first target. Afterwards, consider a corrective leg of this wave towards 1.1606. Then a continuation of the downward wave towards 1.1515 remains possible, with scope to extend the trend to 1.1405.
The Elliott wave structure and the Matrix of the downward wave with a rotation centre at 1.1660 confirm this scenario as the key wave pattern for EURUSD. At the moment, the market forms a downward wave towards the central line of the Price Envelope at 1.1562. Today’s expectation includes reaching this level, followed by a corrective move to 1.1606. Afterwards, the scenario includes a decline towards the lower boundary of the Price Envelope at 1.1515, with a potential continuation of the trend to 1.1405.
Technical indicators for today’s EURUSD forecast suggest a decline towards 1.1562.
USDJPY forecast
On the H4 chart of USDJPY, the market completed a rising wave towards 155.36. On 18 November 2025, consider the possibility of forming a compact consolidation range below this level. A breakout downwards suggests the beginning of a correction towards 154.00. Afterwards, a rising wave towards 154.70 remains possible. A continuation of the downward wave towards 152.22 is not excluded. If the price breaks upwards out of the range, another rising structure towards 155.70 becomes likely. The target is local.
The Elliott wave structure and the Matrix of the upward wave with a rotation centre at 152.22 confirm this scenario as the key structural element in the current wave. At the moment, the market completed a rising wave towards 155.36 and forms a consolidation range around the central line of the Price Envelope at 154.44. An upward leg towards its upper boundary at 155.70 is not excluded. Afterwards, a correction towards the lower boundary at 153.00 becomes possible.
Technical indicators for today’s USDJPY forecast suggest a decline towards 154.00.

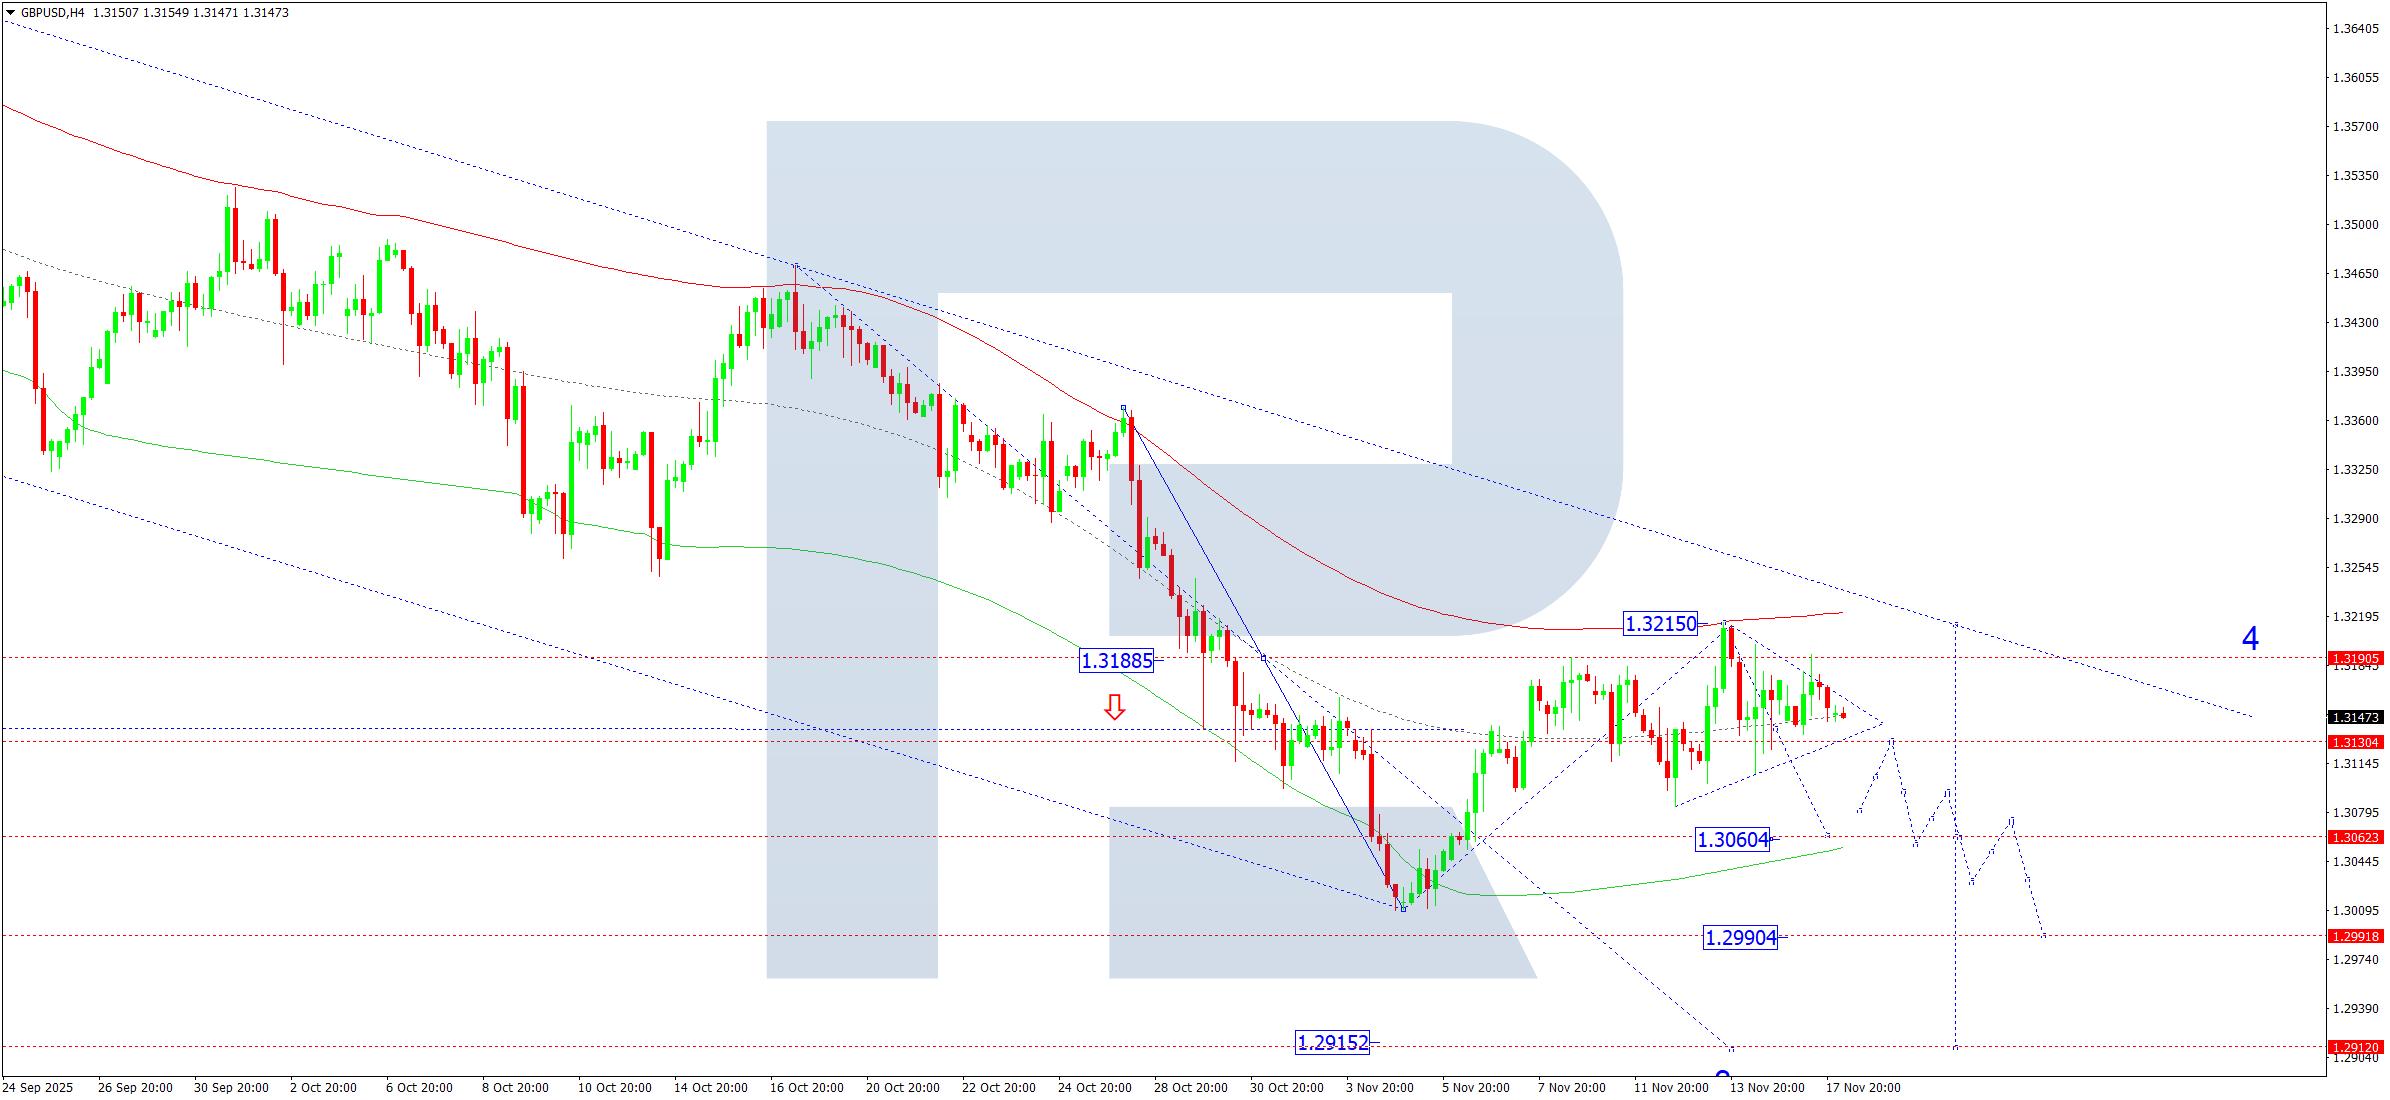
GBPUSD forecast
On the H4 chart of GBPUSD, the market continues building a consolidation range around 1.3155. On 18 November 2025, expect a breakout downwards from this range and a new downward impulse towards 1.3060. A breakout below 1.3060 opens the potential for the continuation of the wave towards 1.2990, with scope to extend the trend to 1.2915. The target is local.
The Elliott wave structure and the Matrix of the downward wave with a rotation centre at 1.3188 confirm this scenario as the key structural element. At the moment, the market completed a correction wave towards the upper boundary of the Price Envelope at 1.3215 (test from below). Today, consider a continuation of the downward wave towards its lower boundary at 1.3060.
Technical indicators for today’s GBPUSD forecast suggest the beginning of a downward wave towards 1.3060.
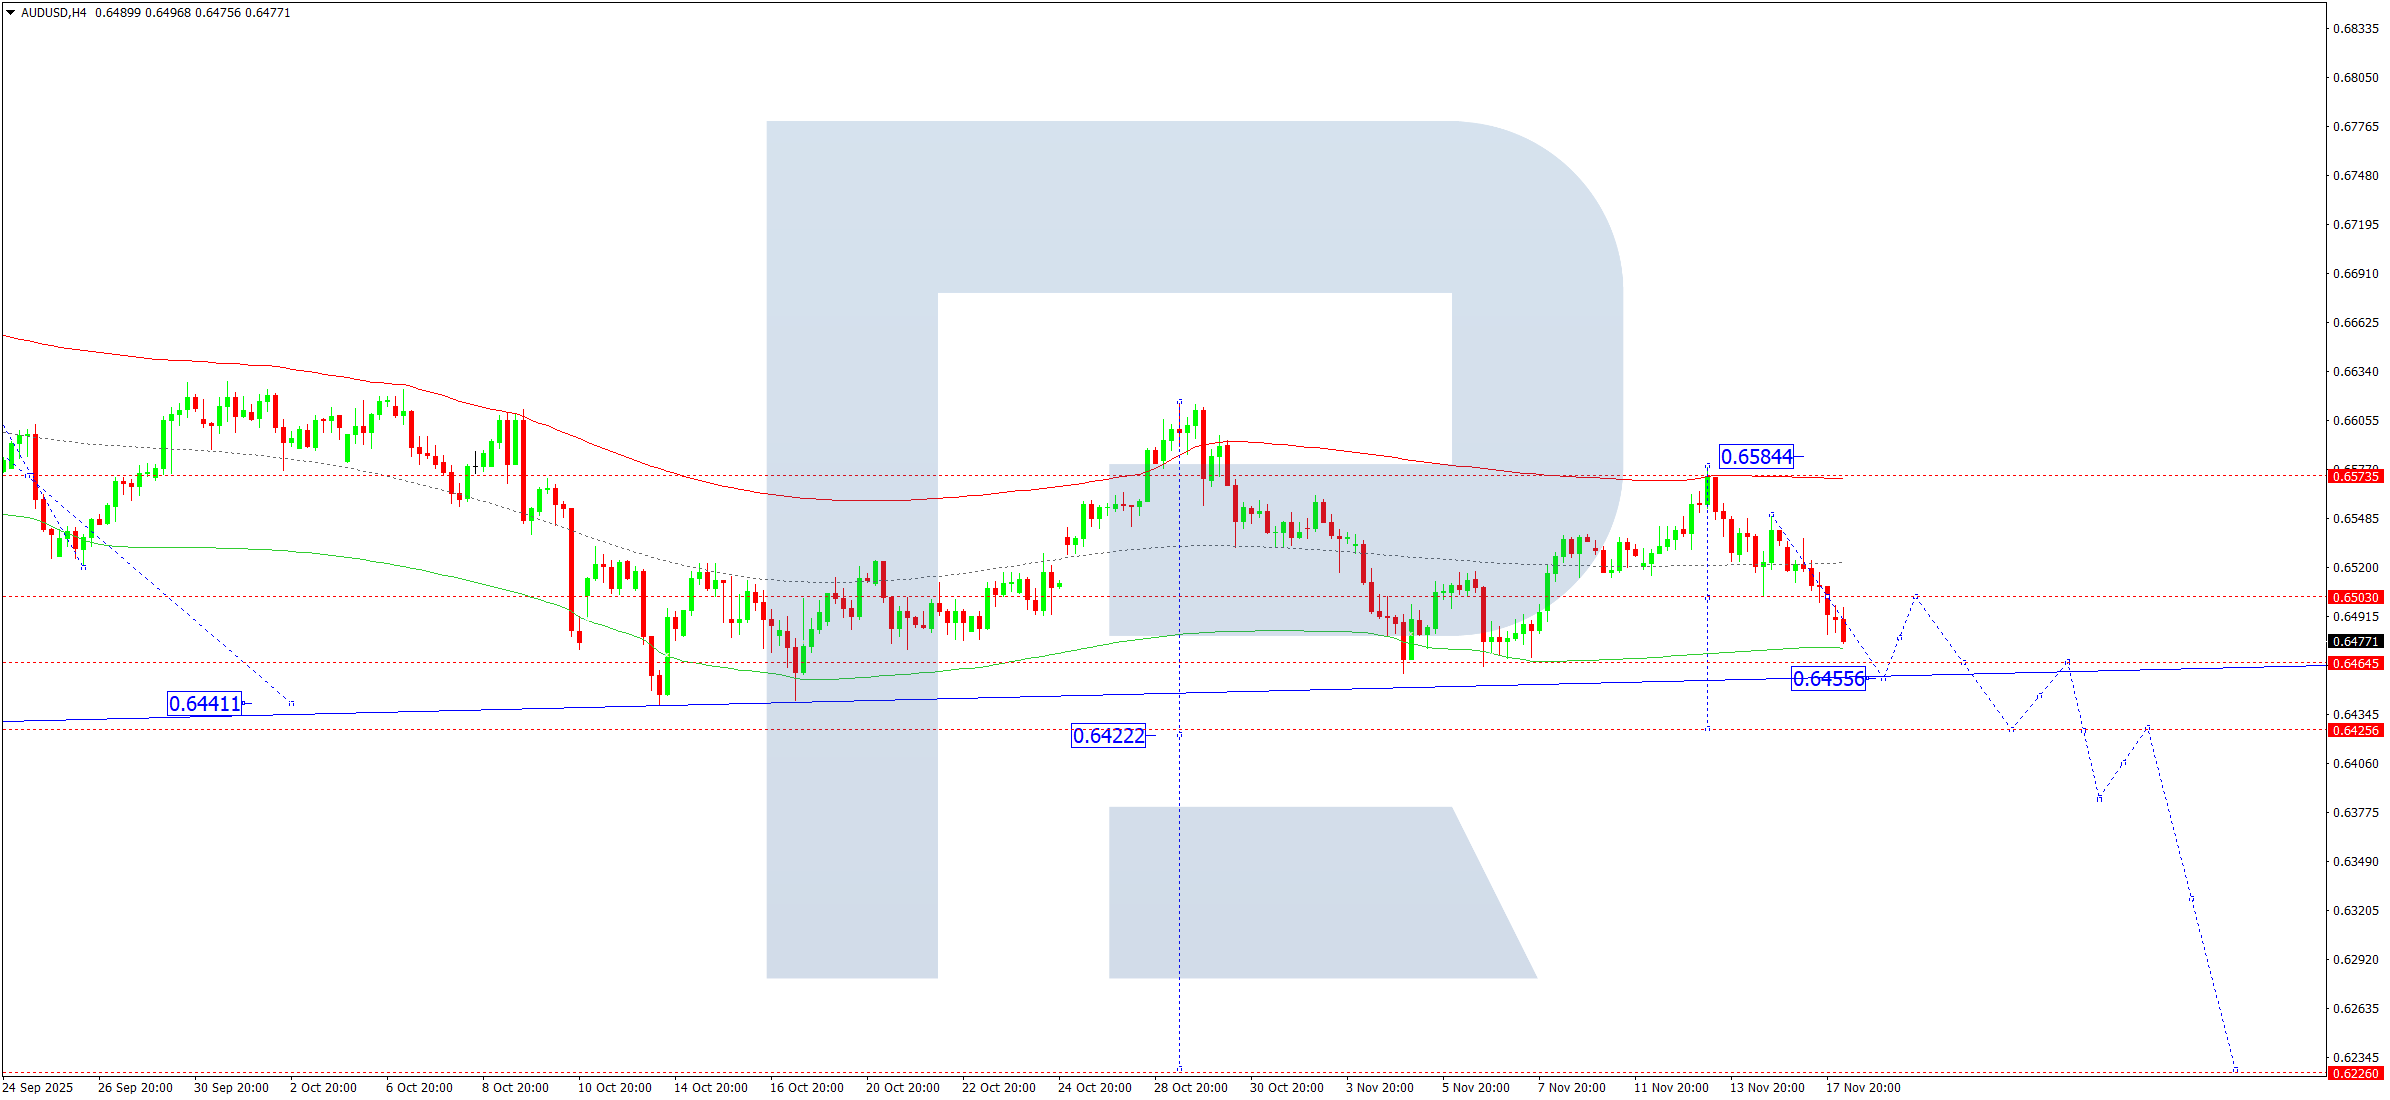
AUDUSD forecast
On the H4 chart of AUDUSD, the market broke below 0.6500 and continues developing the wave towards 0.6455. On 18 November 2025, expect this target level to be reached, followed by a correction towards 0.6500. After this correction ends, expect a decline towards 0.6422. The target is local and calculated.
The Elliott wave structure and the Matrix of the downward wave in AUDUSD with a rotation centre at 0.6570 confirm this scenario as the key wave structure. At the moment, the market completed a correction wave towards the upper boundary of the Price Envelope at 0.6584. Today’s expectation includes a continuation of the downward wave towards its lower boundary at 0.6455.
Technical indicators for today’s AUDUSD forecast suggest the beginning of a downward wave towards 0.6455.
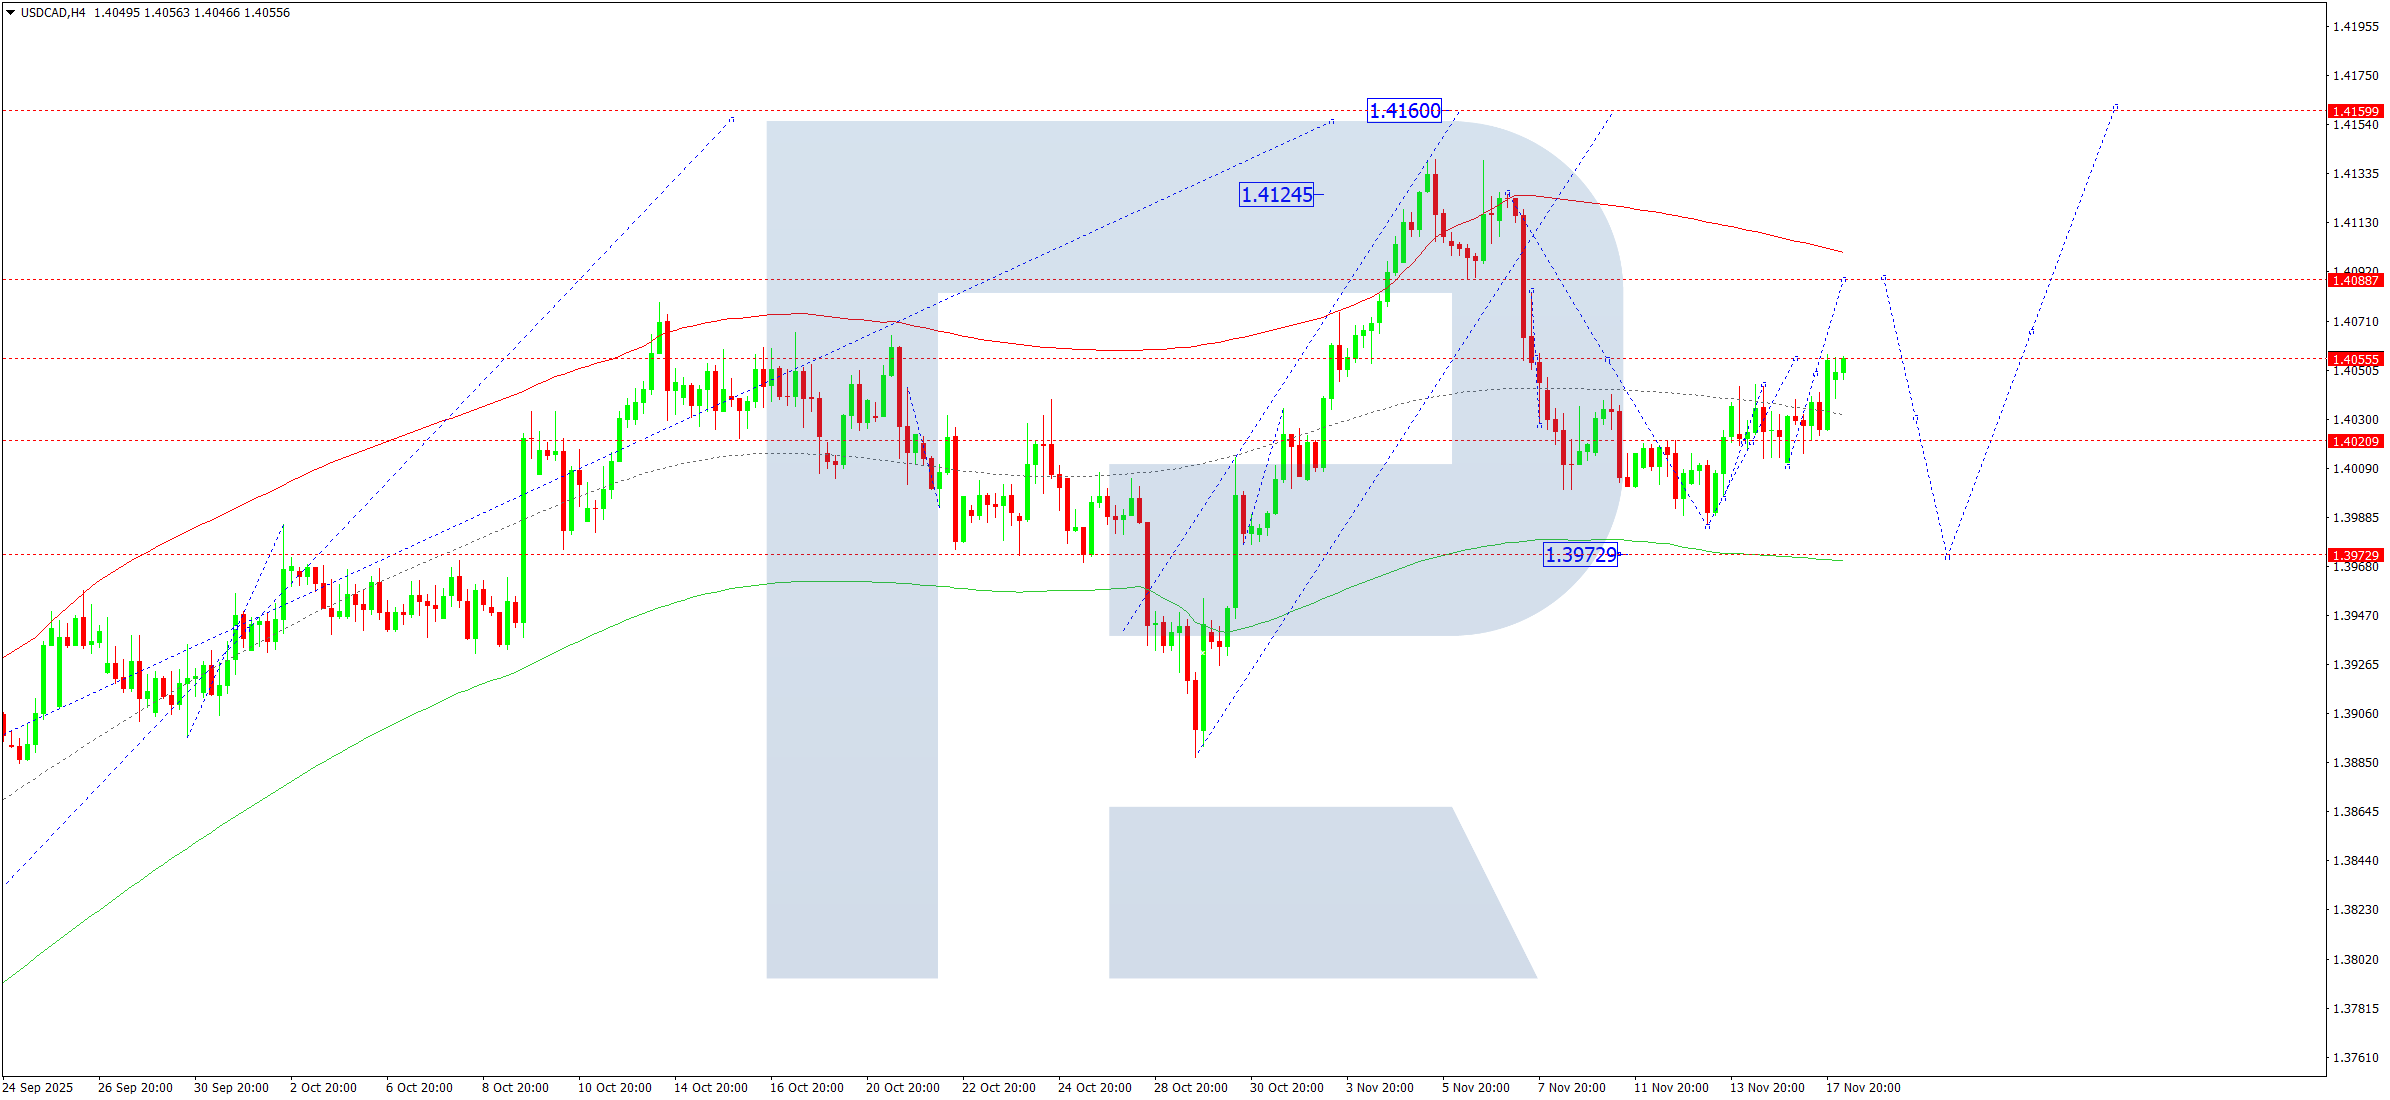
USDCAD forecast
On the H4 chart of USDCAD, the market forms a consolidation range around 1.4055 without a clear directional tendency. On 18 November 2025, consider an expansion of this range upwards towards 1.4088 and downwards towards 1.3973. A breakout upwards opens the potential for a rising wave towards 1.4160. A downward breakout leaves open the possibility of a continued correction towards 1.3939, followed by growth towards 1.4160. The target is local.
The Elliott wave structure and the Matrix of the upward wave with a rotation centre at 1.3939 confirm this scenario as the key structural element in this wave. At the moment, the market continues its correction towards the lower boundary of the Price Envelope at 1.3973. Today’s relevant scenario includes the completion of the correction and the beginning of a rising wave towards its upper boundary at 1.4160.
Technical indicators for today’s USDCAD forecast suggest a continuation of the rising wave towards 1.4160.
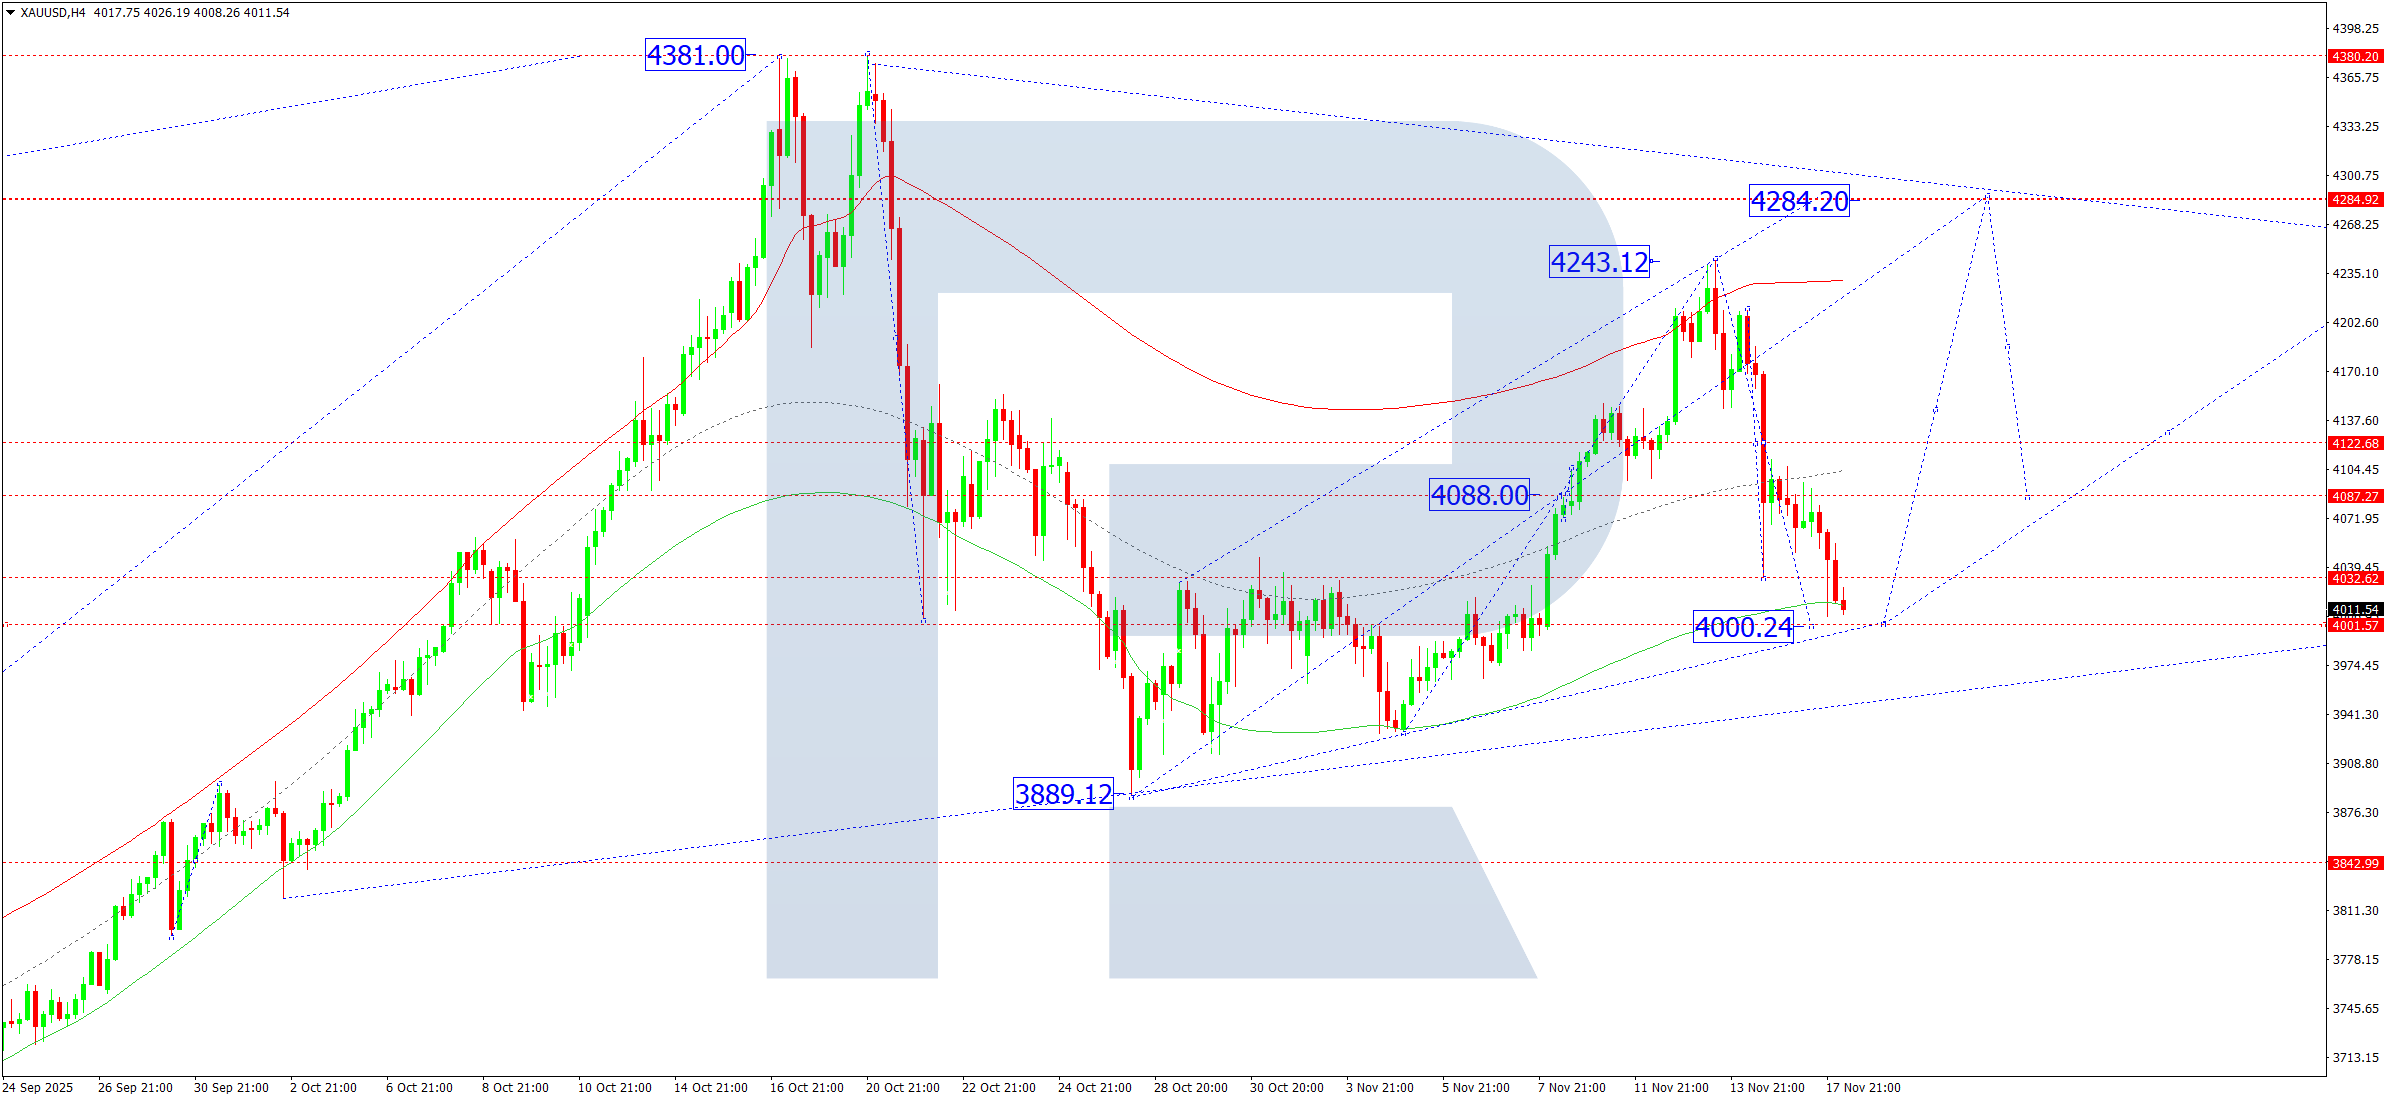
XAUUSD forecast
On the H4 chart of XAUUSD, the market continues developing a correction towards 4,000. On 18 November 2025, expect this target level to be reached. Afterwards, consider a rising wave towards 4,133. The market will effectively outline a consolidation range. A breakout upwards opens the potential for the continuation of the wave towards 4,400. A downward breakout opens the potential for the continuation of the correction towards 3,844.
The Elliott wave structure and the Matrix of the upward wave with a rotation centre at 4,088 confirm this scenario as the key structural element in this wave. At the moment, the market forms a downward wave towards the lower boundary of the Price Envelope at 4,000. Today’s relevant scenario includes achieving this target level, followed by a rise towards its central line at 4,133.
Technical indicators for today’s XAUUSD forecast point to a correction towards 4,000 and the beginning of a rising wave towards 4,133 and 4,284.
Brent forecast
On the H4 chart of Brent crude, the market forms a consolidation range above 63.33. On 18 November 2025, a breakout downwards opens the potential for another wave in the correction towards 62.00. A breakout upwards suggests a rising impulse towards 66.10. The target is local.
The Elliott wave structure and the Matrix of the upward wave with a rotation centre at 63.33 confirm this scenario as the key wave structure for Brent. At the moment, the market continues forming a consolidation range around the central line of the Price Envelope at 63.33. Today, a downward breakout suggests a continuation of the correction towards its lower boundary at 62.00. A breakout upwards opens the potential for a rising wave towards its upper boundary at 66.10.
Technical indicators in today’s Brent forecast suggest the end of the correction at 62.00 and the beginning of a rise towards 66.10.

Forecasts presented in this section only reflect the author’s private opinion and should not be considered as guidance for trading. RoboForex bears no responsibility for trading results based on trading recommendations described in these analytical reviews.