Daily technical analysis and forecast for 11 November 2025
Here is a detailed daily technical analysis and forecast for EURUSD, USDJPY, GBPUSD, AUDUSD, USDCAD, XAUUSD and Brent for 11 November 2025.
EURUSD forecast
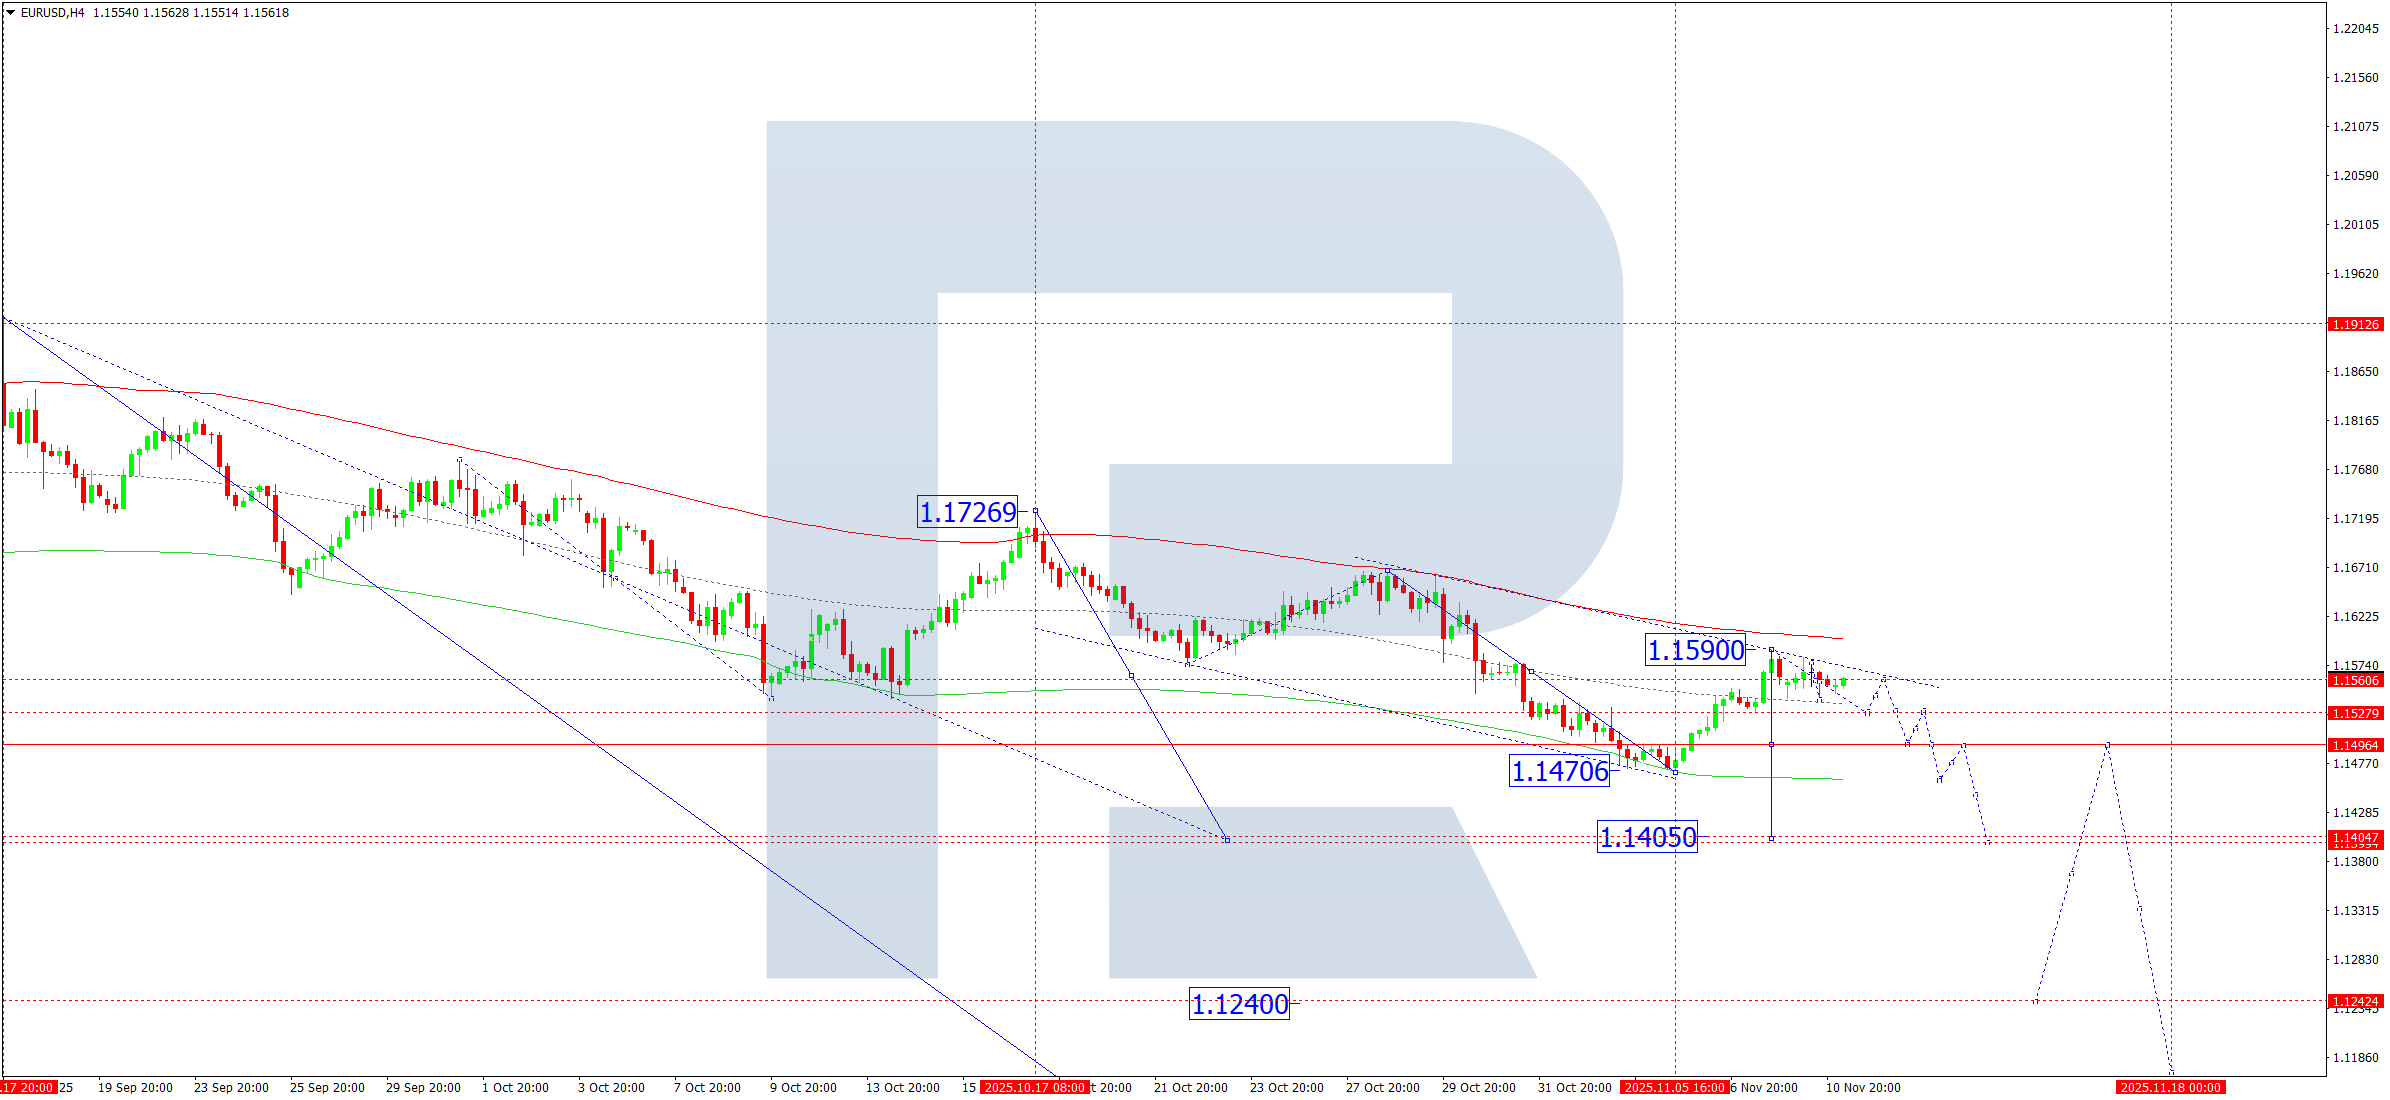
On the H4 chart of EURUSD, the market continues to develop a consolidation range around 1.1560. On 11 November 2025, the range could expand down to 1.1535 and rise back to 1.1560. If the price breaks above this range, another corrective move towards 1.1590 is possible. If the price breaks downwards, the third wave within the downtrend towards 1.1490 comes into focus. A breakout below 1.1490 opens the potential to extend the trend to at least 1.1405, a local target.
The Elliott wave structure and the matrix of the downward wave with a pivot point at 1.1650 confirm this scenario as the key wave structure for EURUSD. Today, the pair is expected to decline towards the lower boundary of the Price Envelope at 1.1450, with scope to extend the trend towards 1.1405.
Technical indicators for today’s EURUSD forecast suggest a decline towards 1.1450.
USDJPY forecast
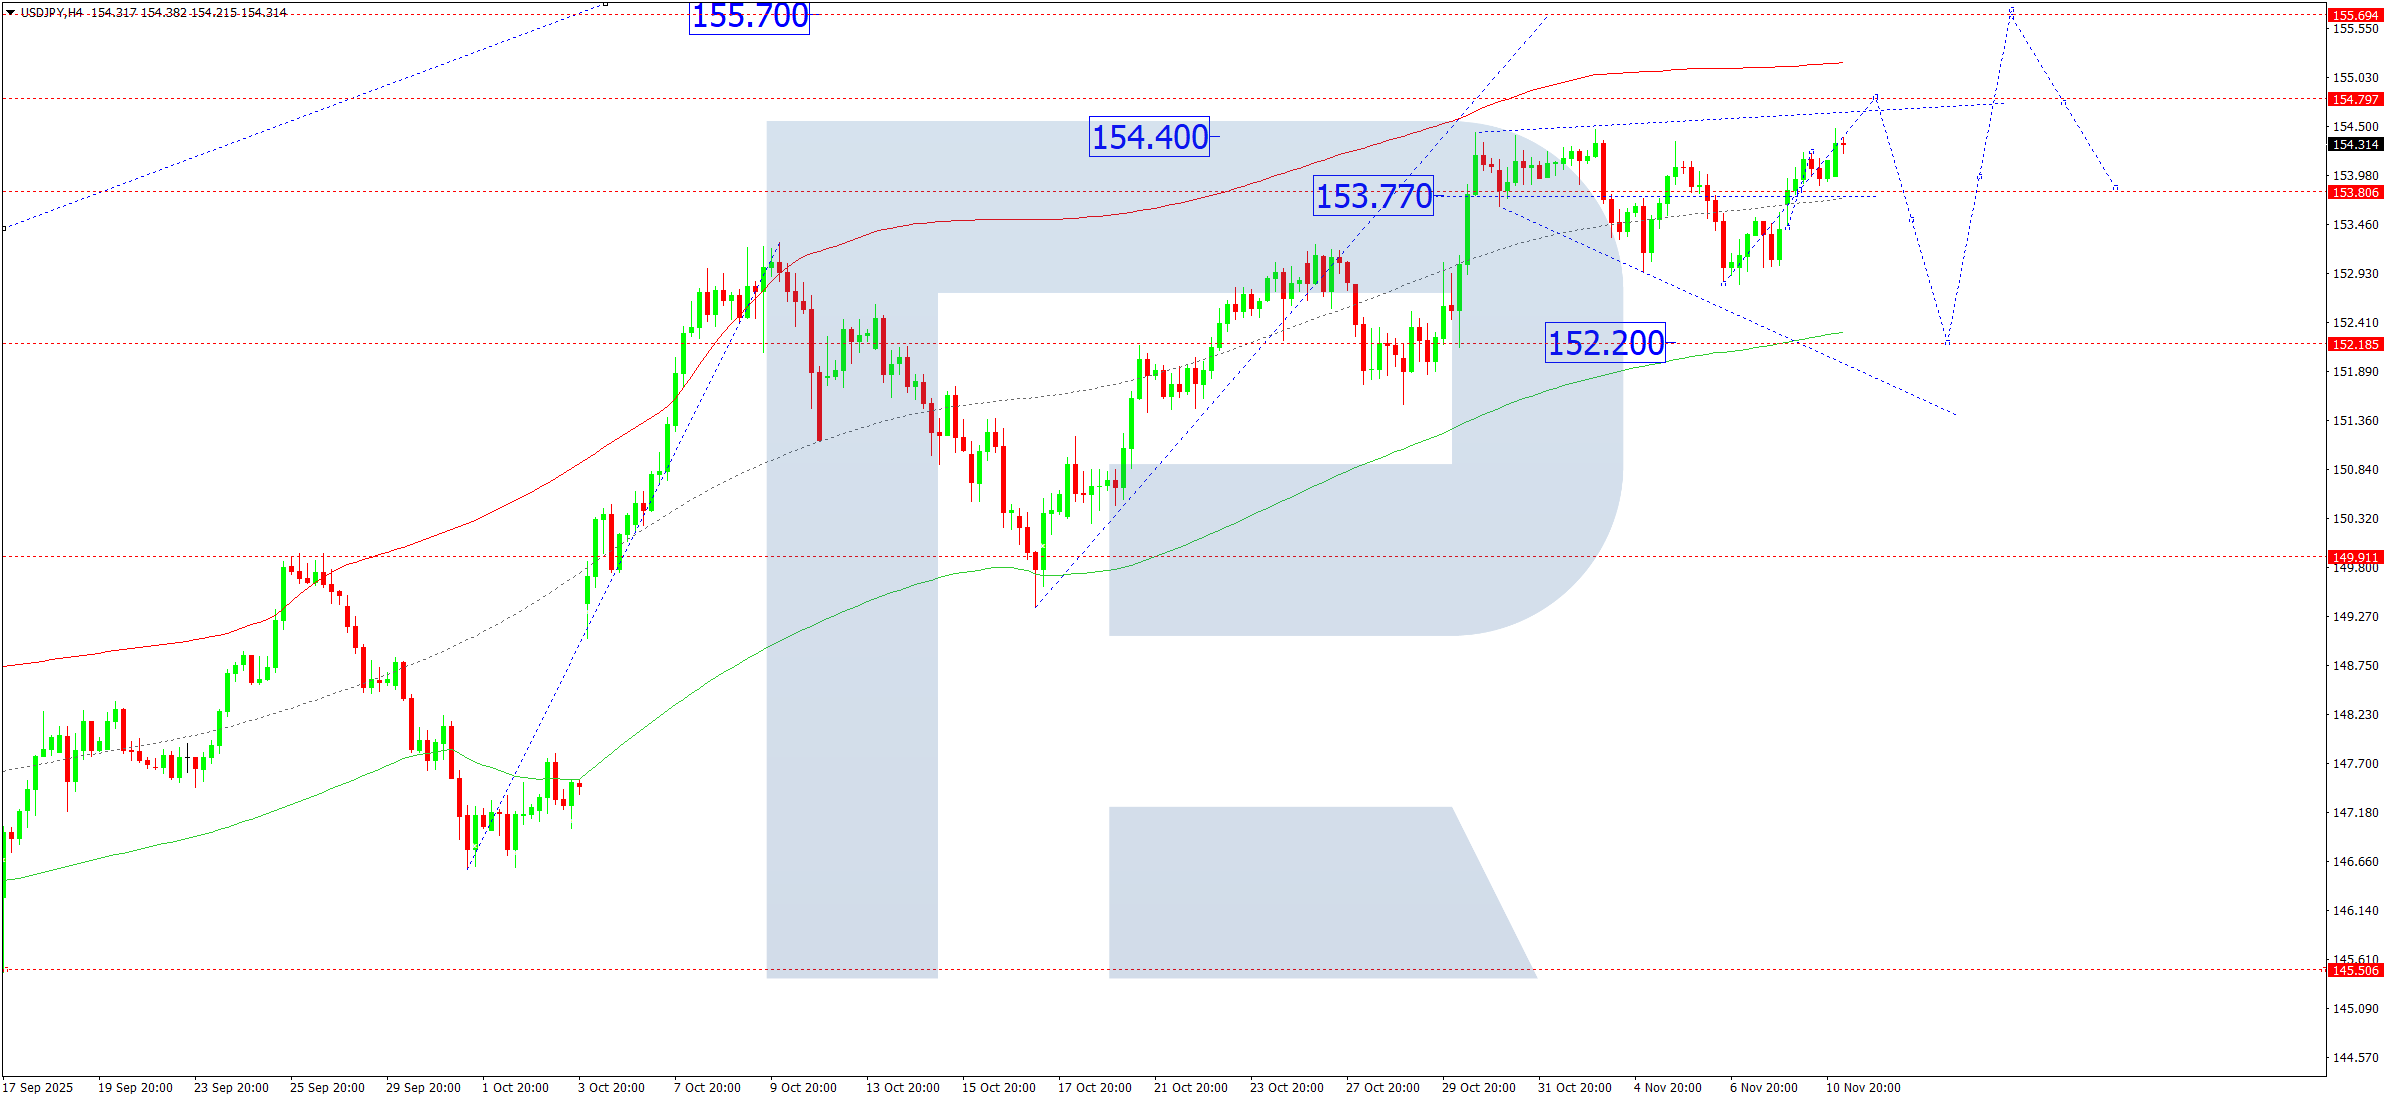
On the H4 chart of USDJPY, the market continues to form a consolidation range around 153.77. On 11 November 2025, the range could expand upwards to 154.80 and then fall back to 153.77. A breakout above this range opens potential for the upward wave to continue towards 155.70, with an extension towards 157.57 as a local estimated target. A downward breakout could trigger a corrective move to at least 152.22, followed by growth towards 155.70.
The Elliott wave structure and the matrix of the upward wave with a pivot point at 151.90 confirm this scenario as the key structure for this wave. At the moment, the market forms a consolidation range around the central line of the Price Envelope at 153.77. The pair is expected to move down to its lower boundary at 152.22 (testing from above) before rising to its upper boundary at 155.70.
Technical indicators for today’s USDJPY forecast suggest a correction towards 152.22.
GBPUSD forecast
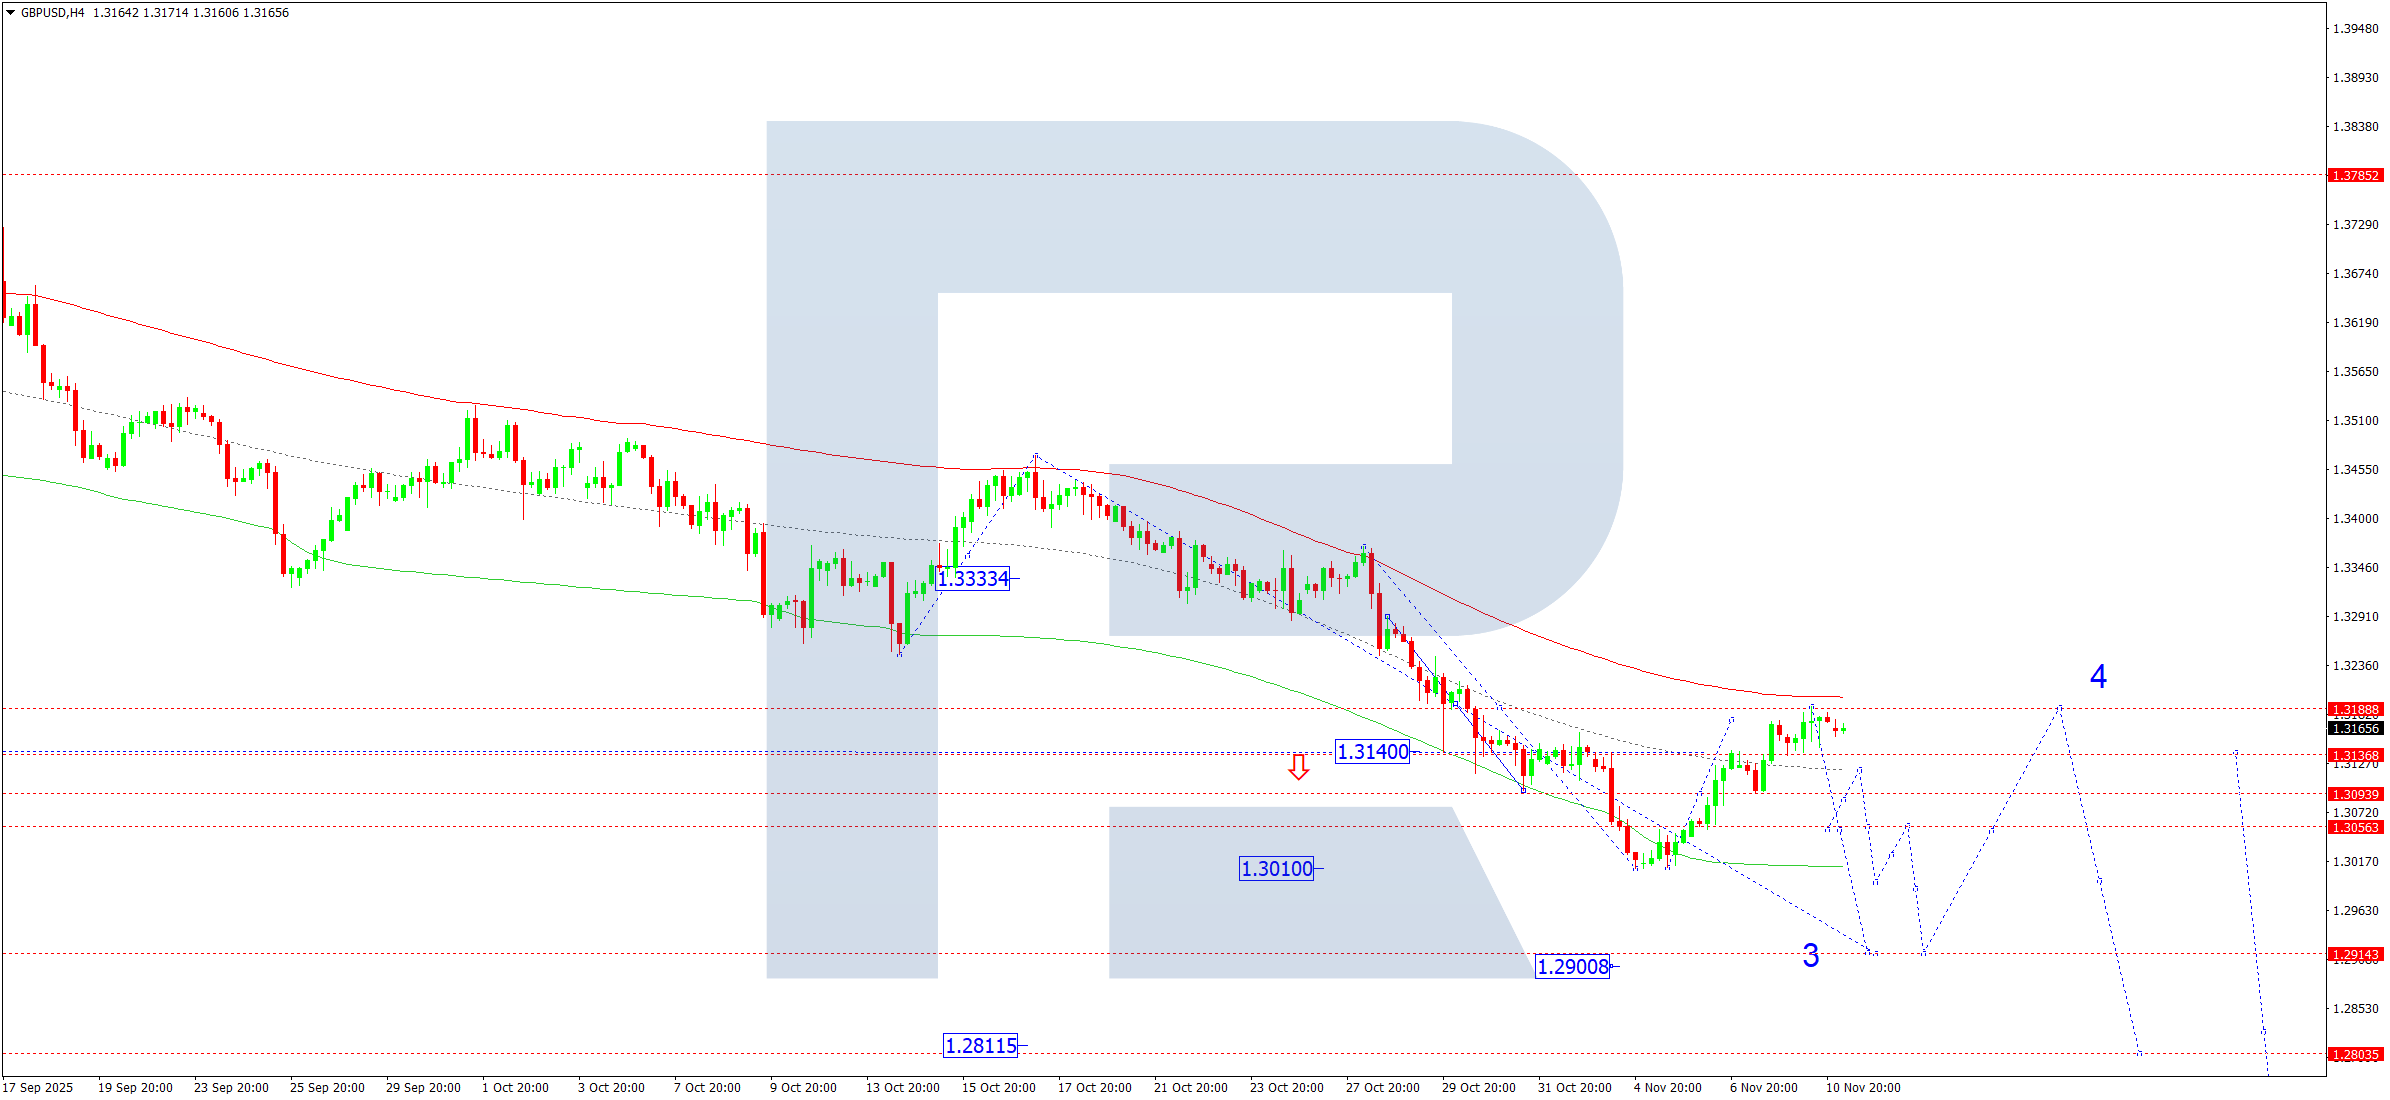
On the H4 chart of GBPUSD, the market completed a correction to 1.3188. On 11 November 2025, a downward wave could start, aiming for 1.3055. A breakout below this level could push the price further lower towards 1.2900. The target is local, within the third wave along the downtrend.
The Elliott wave structure and the matrix of the downward wave with a pivot point at 1.3188 confirm this scenario as the key structure of this wave. At the moment, the correction wave reached the upper boundary of the Price Envelope at 1.3188 (testing from below). Today, a downward wave could start, aiming for its lower boundary at 1.2900.
Technical indicators for today’s GBPUSD forecast suggest the start of a downward wave towards 1.2900.
AUDUSD forecast
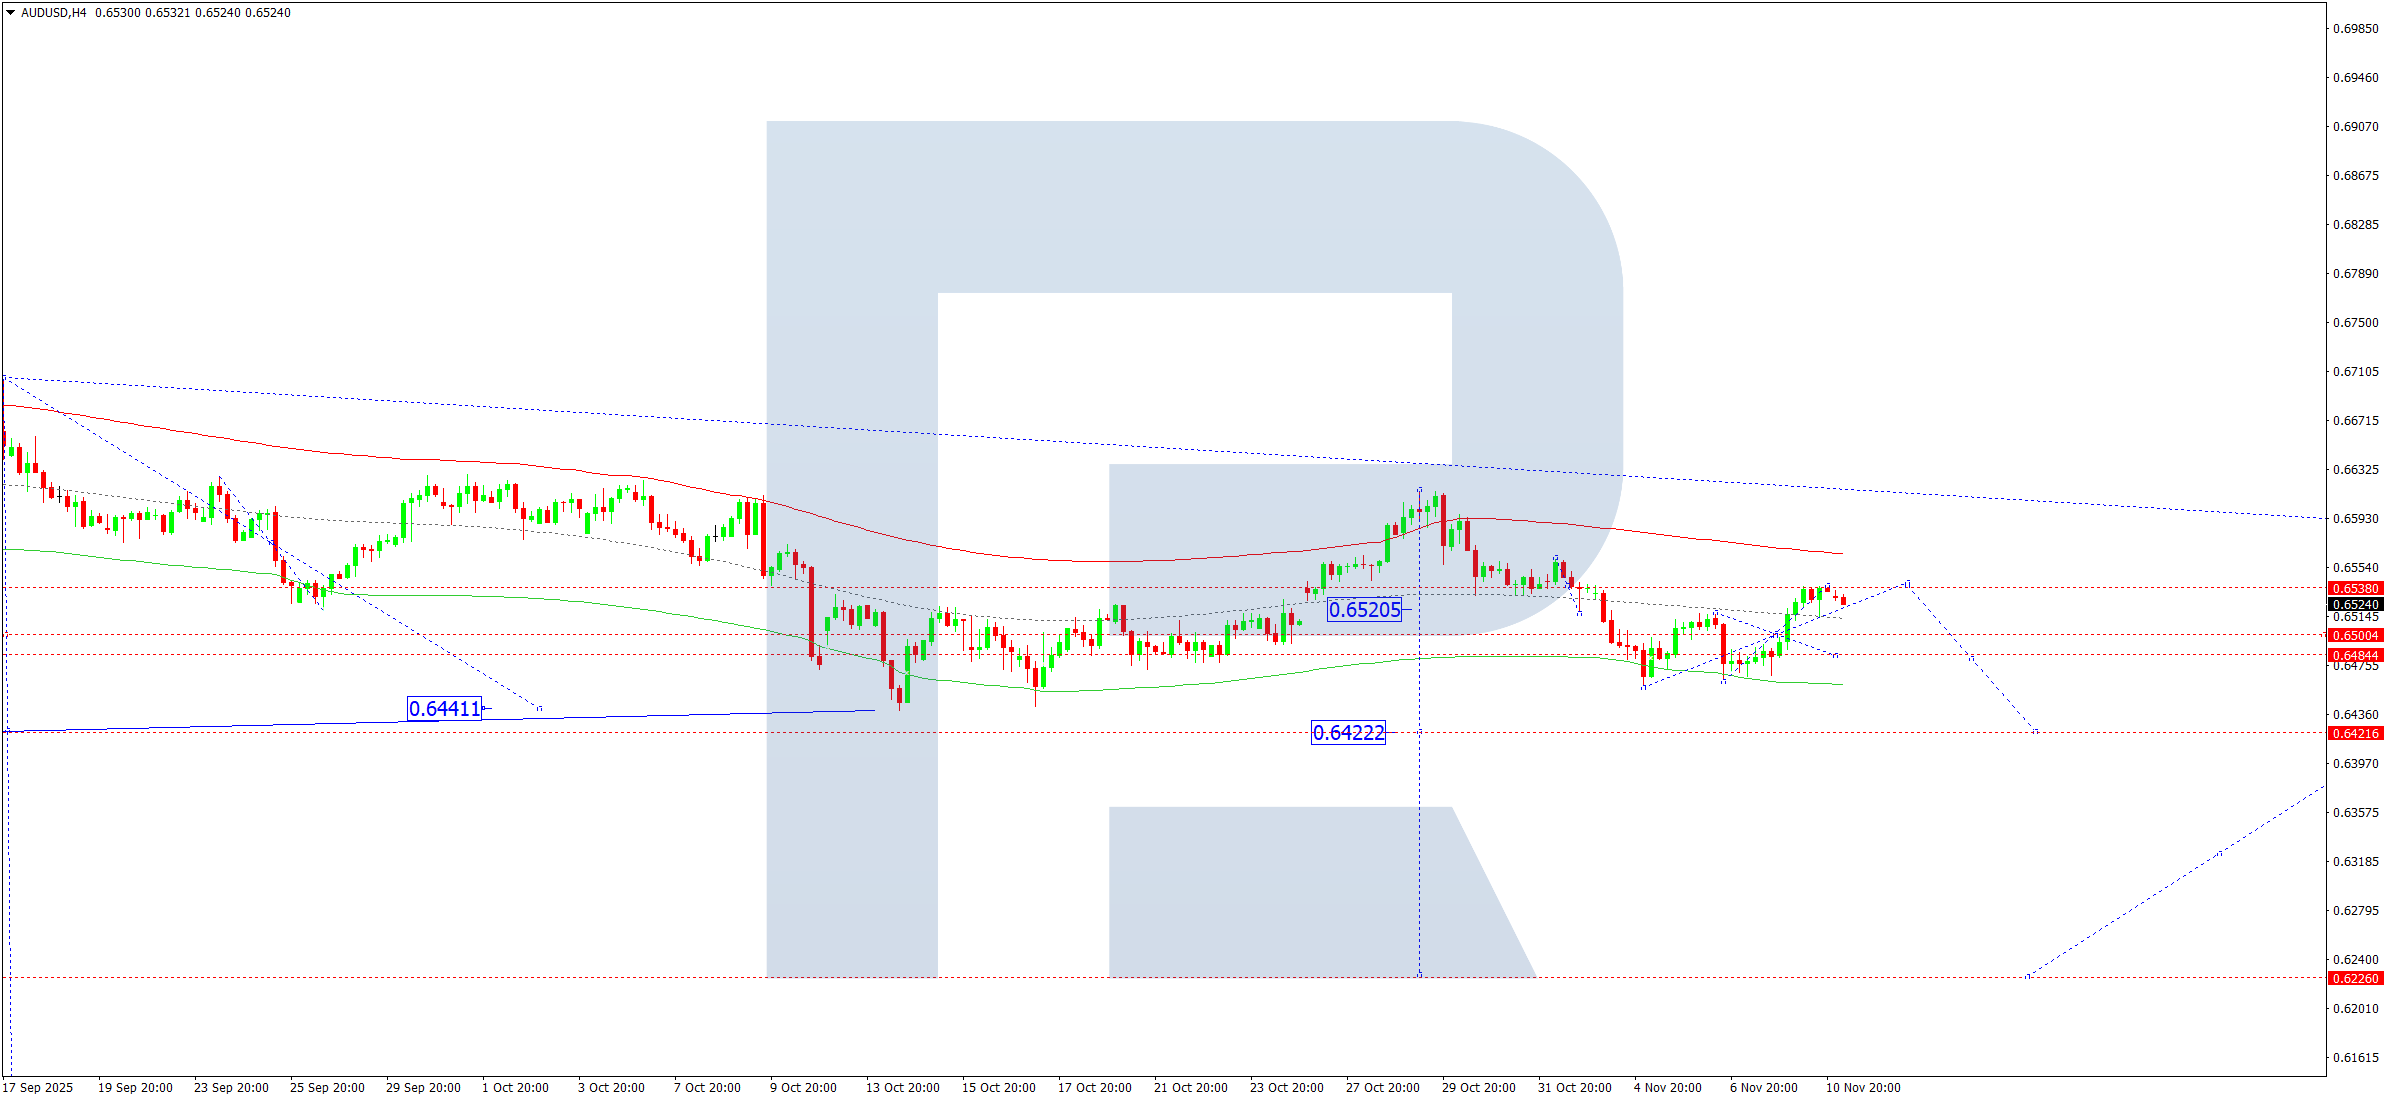
On the H4 chart of AUDUSD, the market completed a correction to 0.6538. On 11 November 2025, a downward move towards 0.6480 is expected to start, with the potential to extend the trend to 0.6422. This forms only half of the third downward wave towards 0.6226, a local estimated target.
The Elliott wave structure and the matrix of the downward wave in AUDUSD with a pivot point at 0.6538 confirm this scenario as the key structure of this wave. At the moment, the market has completed a correction, reaching the upper boundary of the Price Envelope at 0.6538. Today, the pair could start to decline to its lower boundary at 0.6484, with potential continuation of the third wave towards 0.6222.
Technical indicators for today’s AUDUSD forecast suggest the start of a downward wave towards 0.6484.
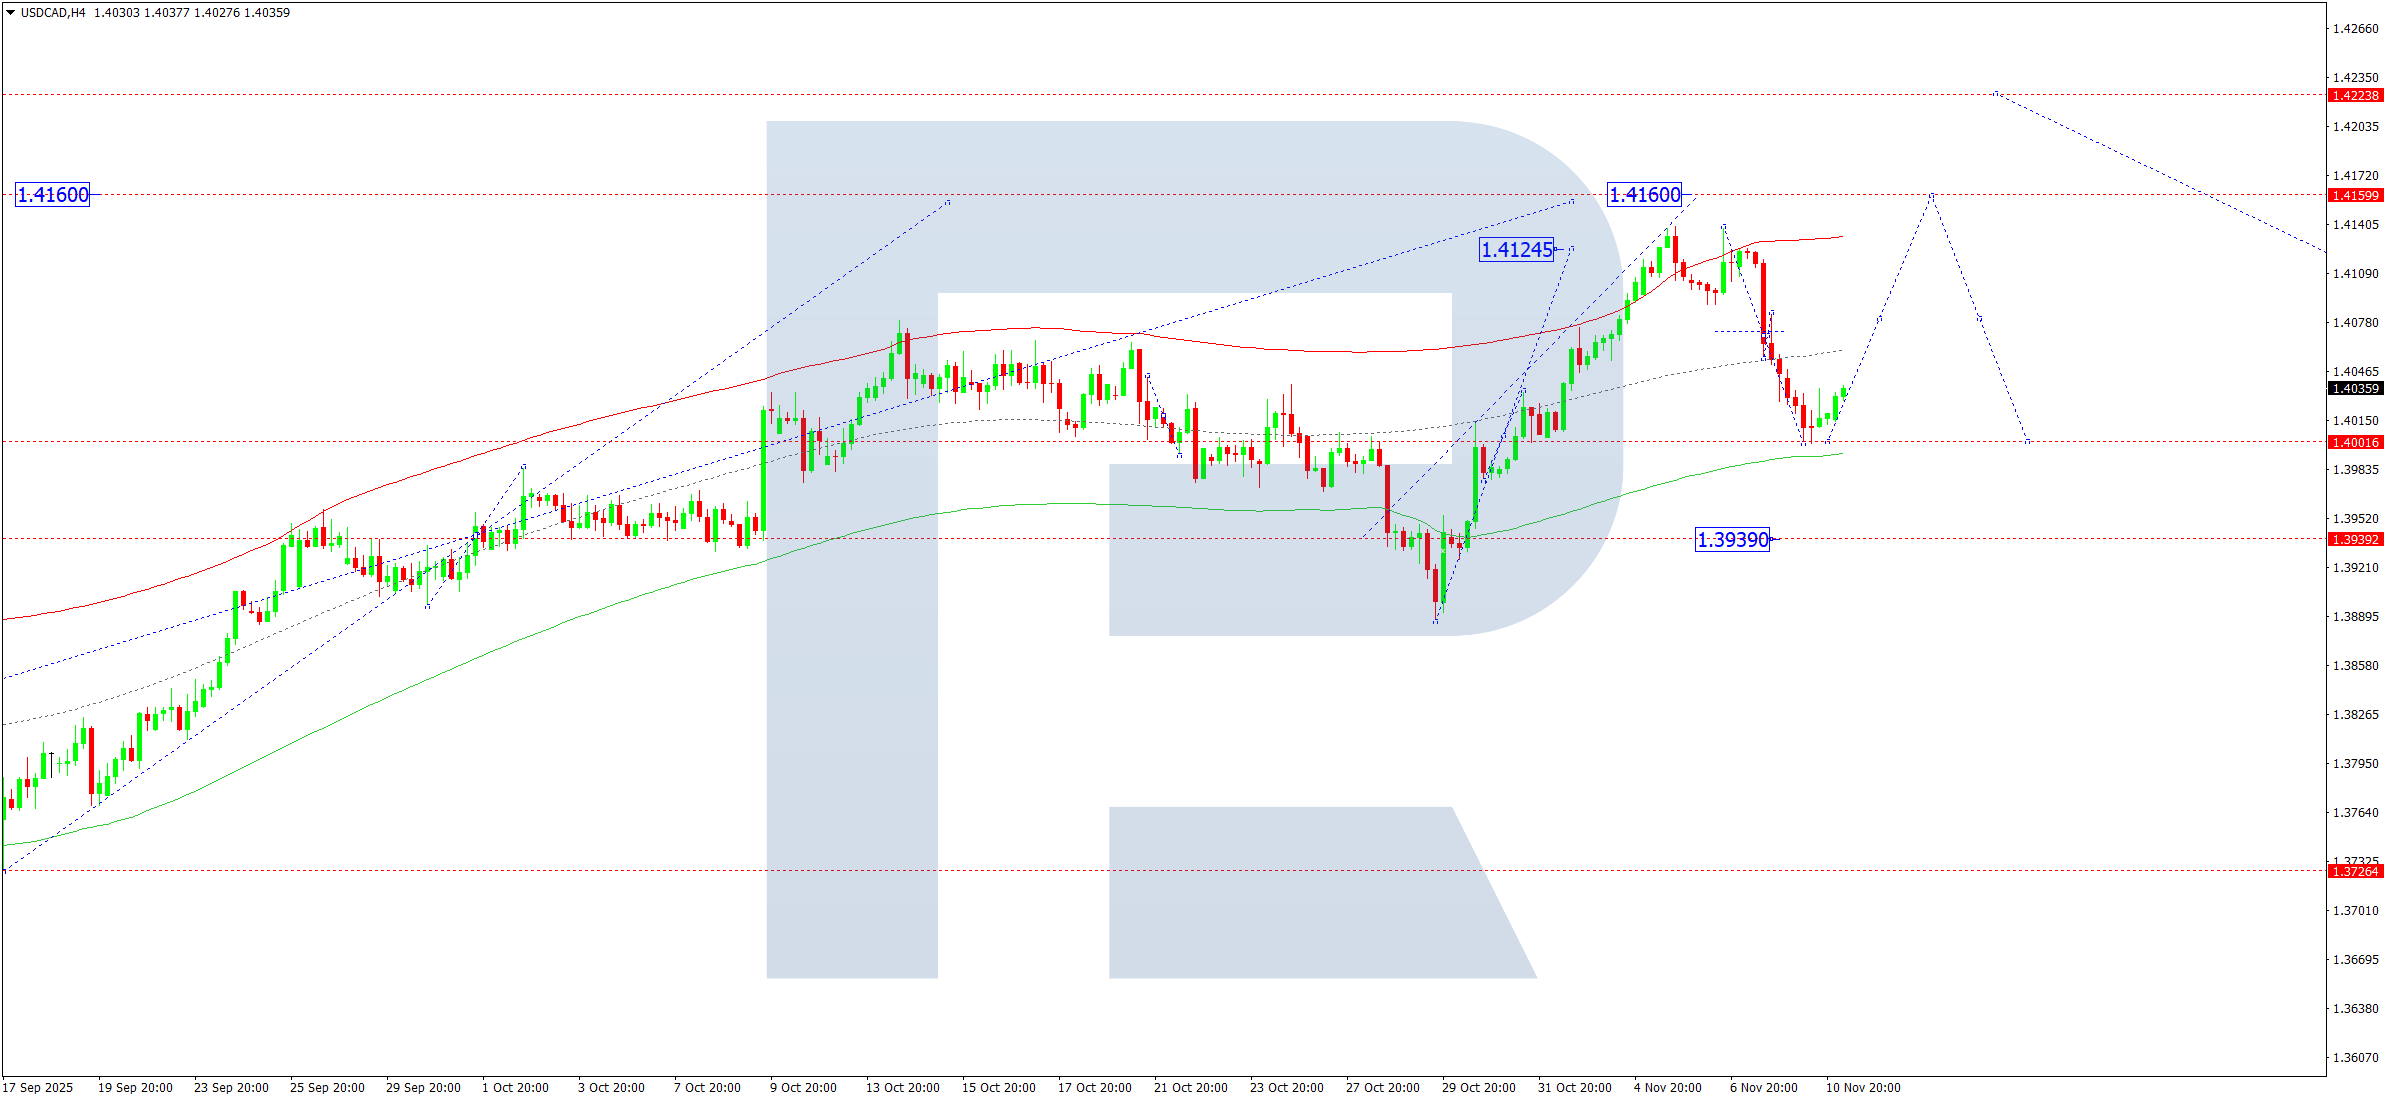
USDCAD forecast
On the H4 chart of USDCAD, the market completed a correction to 1.4000. On 11 November 2025, an upward wave could start, targeting 1.4080. A breakout above this level would open potential for the wave to continue towards 1.4160.
The Elliott wave structure and the matrix of the upward wave with a pivot point at 1.3939 confirm this scenario as the key structure for USDCAD. At the moment, the market forms an advance towards the upper boundary of the Price Envelope at 1.4160. Today, consider a rise towards its upper boundary at 1.4160.
Technical indicators for today’s USDCAD forecast suggest upward movement could continue towards 1.4160.
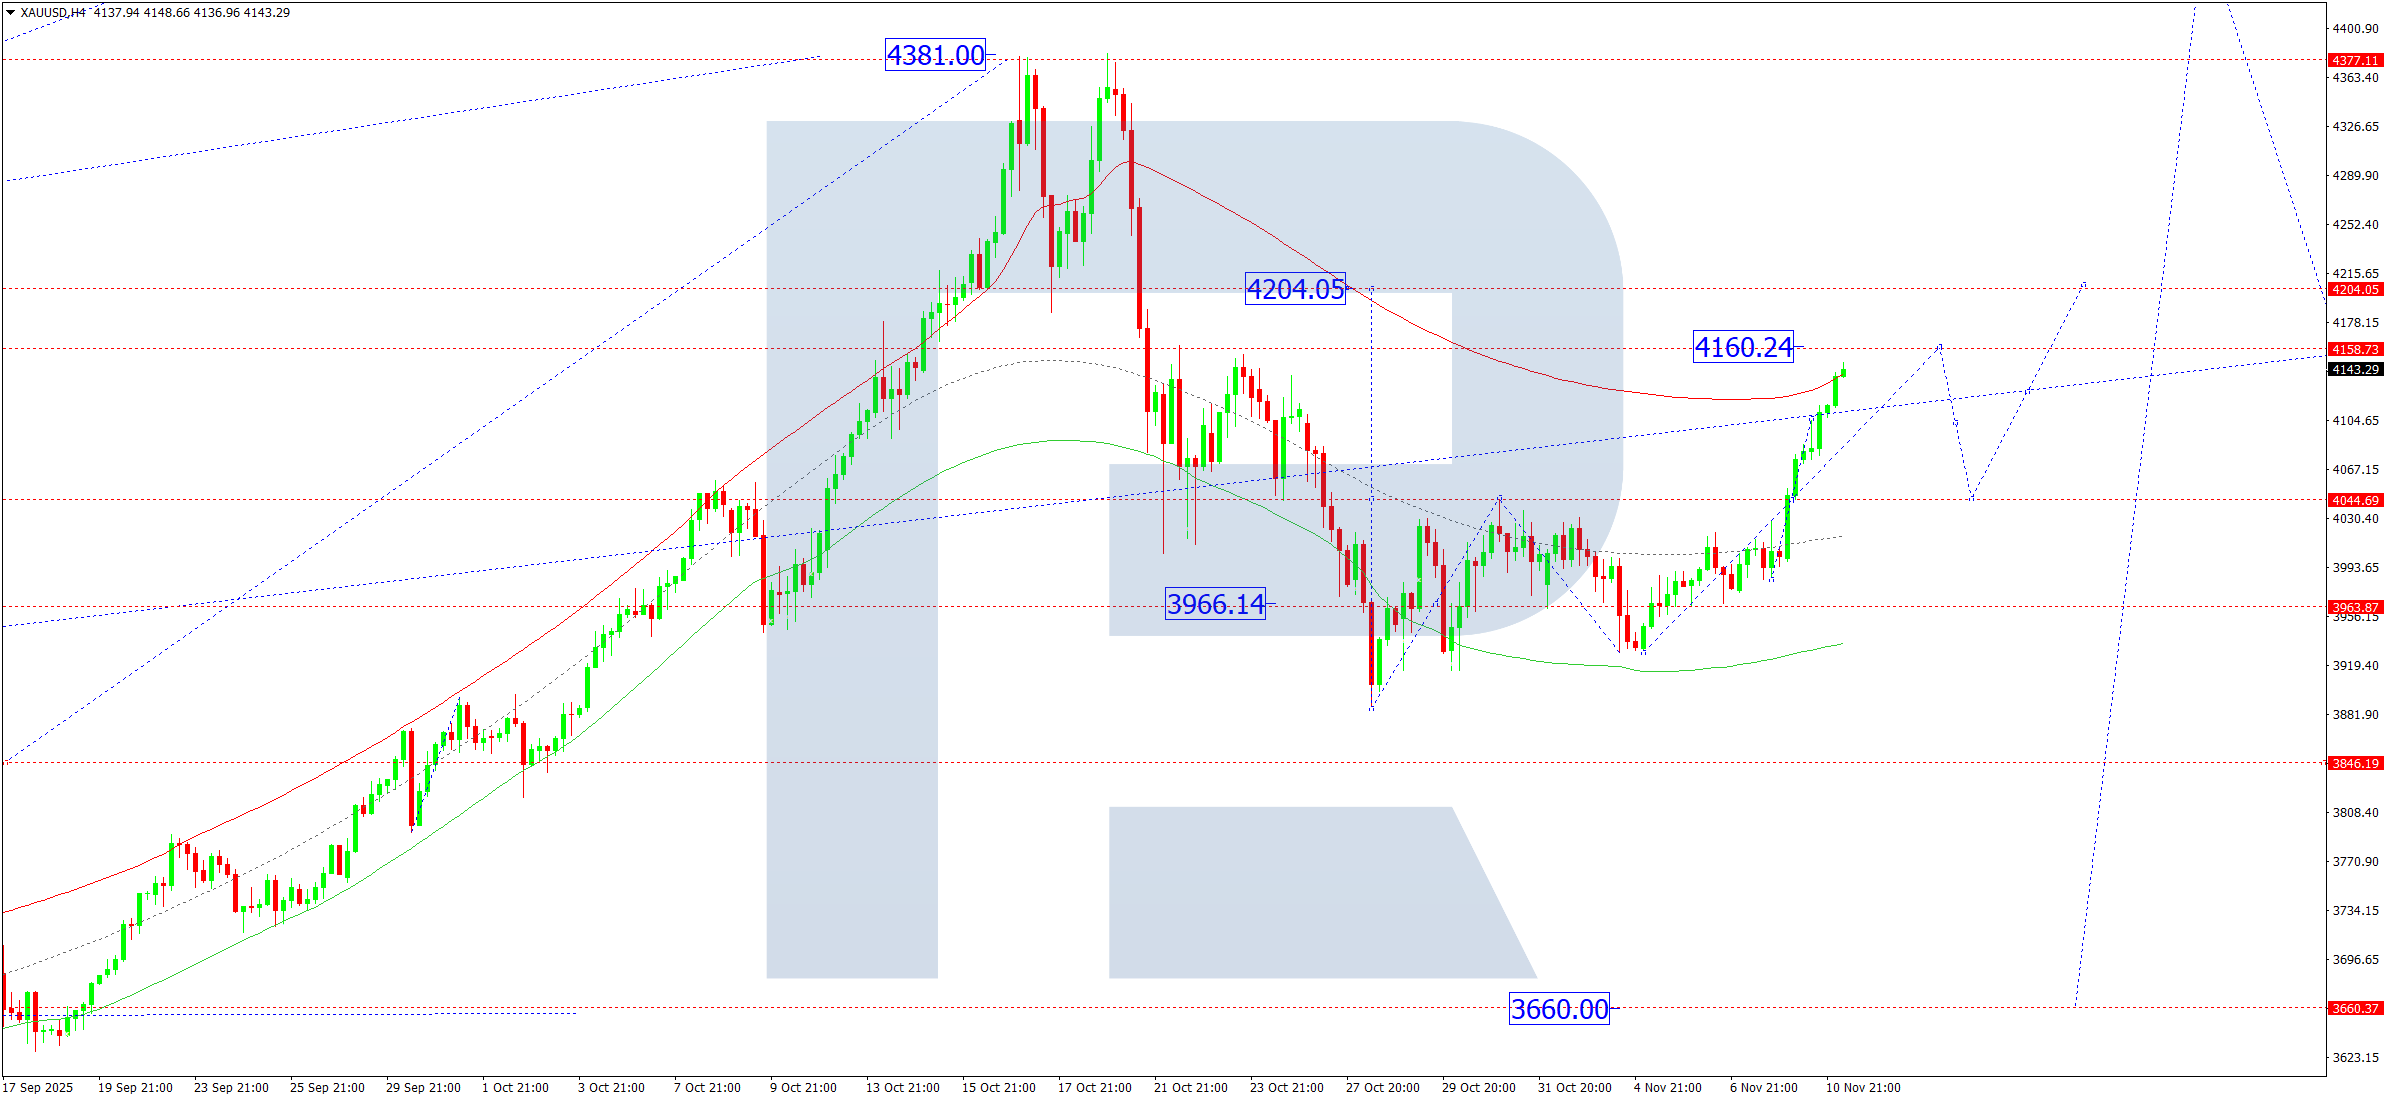
XAUUSD forecast
On the H4 chart of XAUUSD, the market formed a consolidation range around 3,966 and broke out upwards. On 11 November 2025, the range could expand towards 4,160, followed by a decline to 4,044. The market continues to develop a broader consolidation range around 4,044. A downward breakout would lead to a continued correction towards 3,850, while an upward breakout would open the potential to continue the trend towards 4,204.
The Elliott wave structure and the matrix of the upward wave with a pivot point at 3,660 confirm this scenario as the key structure for XAUUSD in this wave. At the moment, the market forms a consolidation range around the central line of the Price Envelope at 4,044. Today, prices could rise to its upper boundary at 4,160 before retreating to the central line at 4,044.
Technical indicators for today’s XAUUSD forecast suggest an upward move towards 4,160.
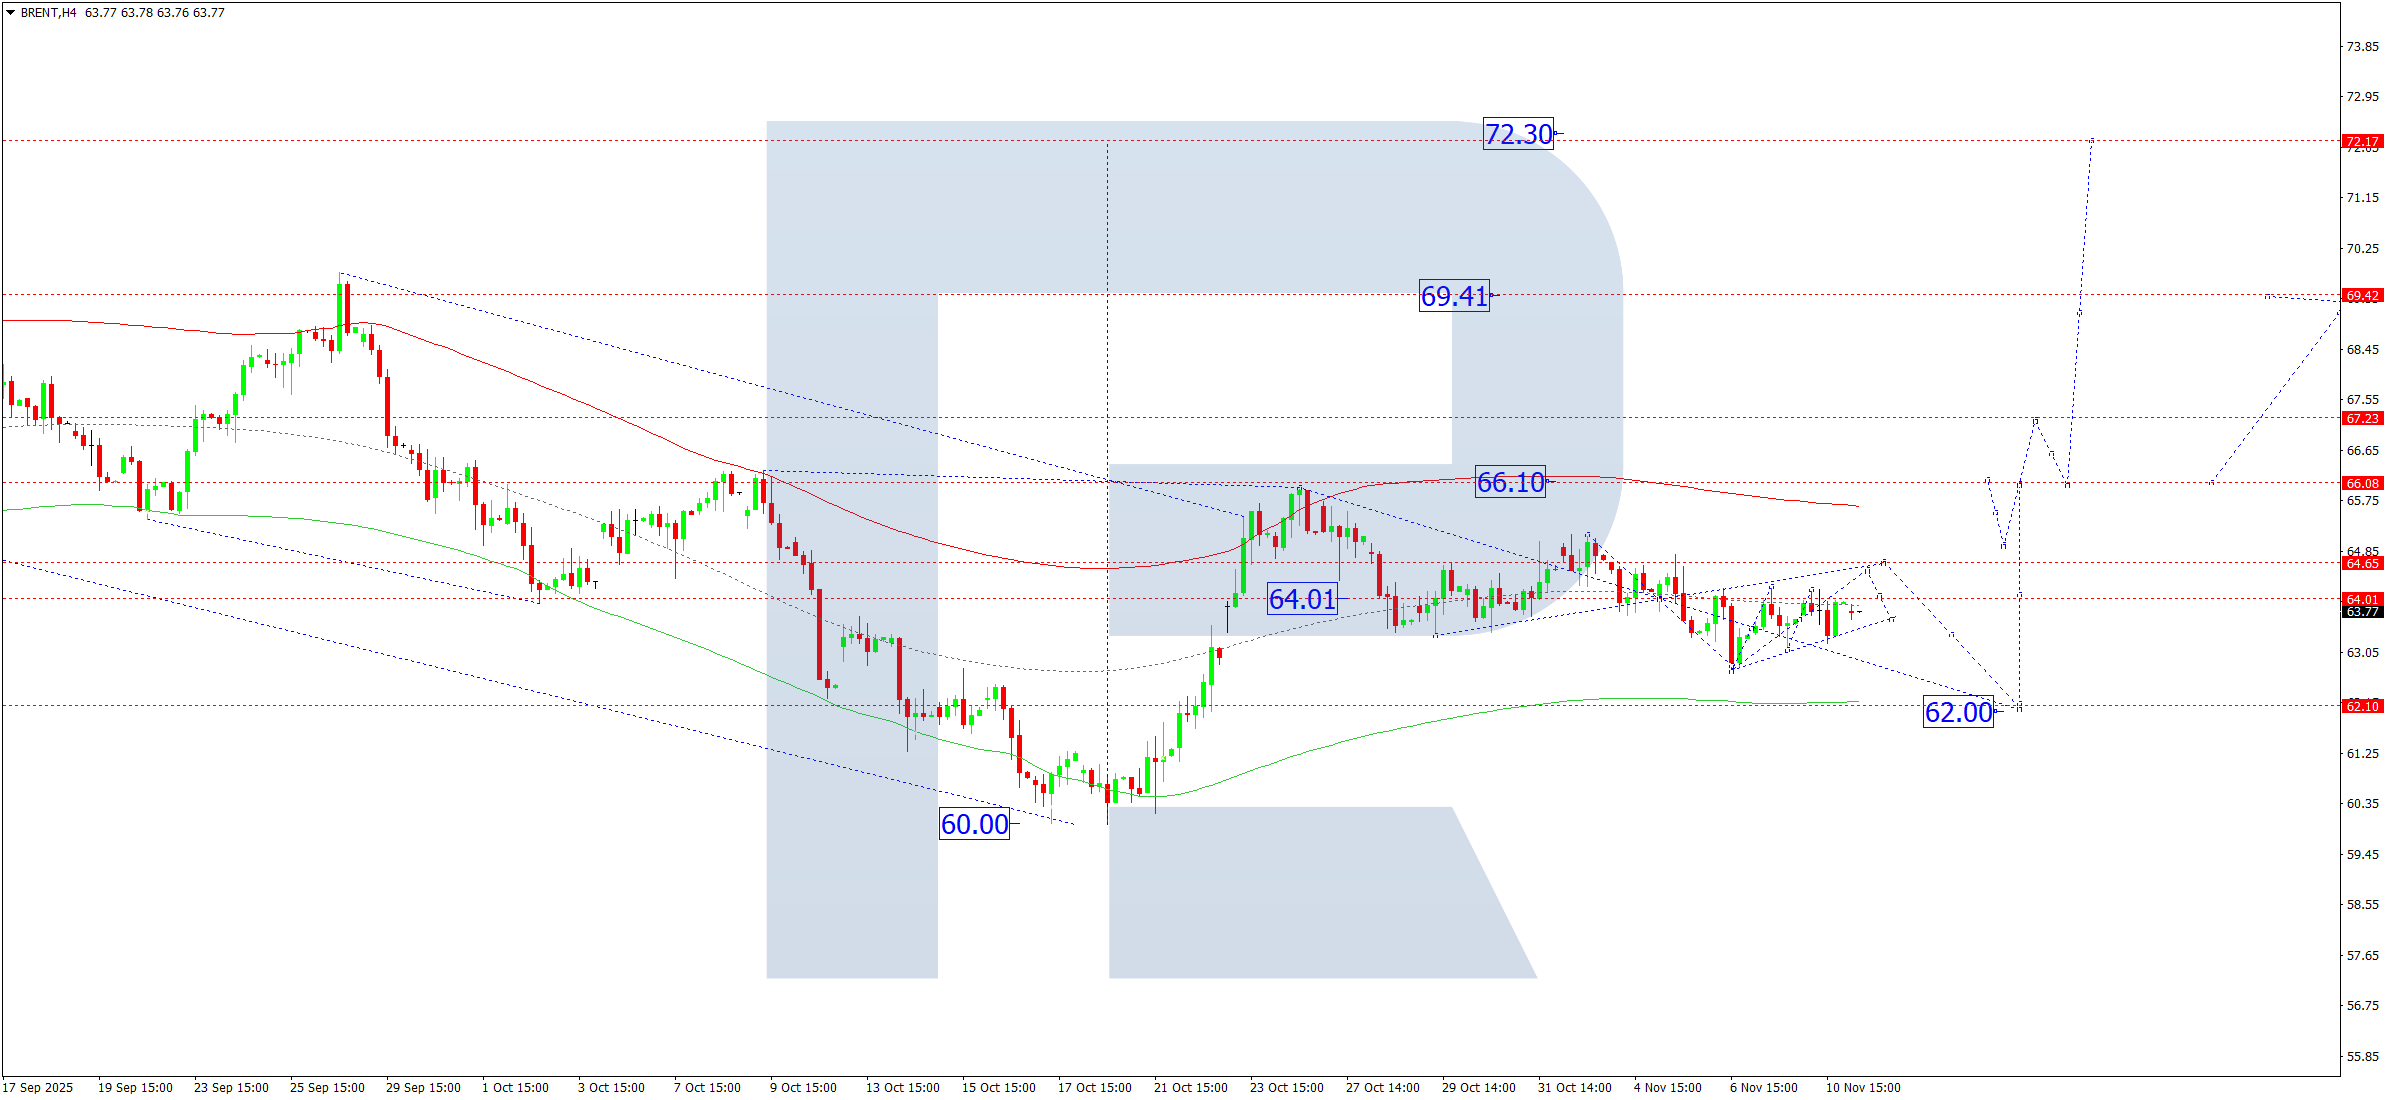
Brent forecast
On the H4 chart of Brent crude, the market continues to develop a consolidation range around 64.00. On 11 November 2025, an upward move towards 64.64 is possible. Later, a decline towards 62.00 could follow. This move will complete the correction potential. Then expect growth towards 66.10. A breakout above 66.10 would open potential for an upward wave towards 69.40, a local target.
The Elliott wave structure and the matrix of the upward wave with a pivot point at 66.10 confirm this scenario as the key structure for Brent in this wave. At the moment, the market forms a correction towards the lower boundary of the Price Envelope at 62.00. Today, consider the end of the correction and the start of an upward impulse towards its upper boundary at 66.10.
Technical indicators in today’s Brent forecast suggest the correction could end at 62.00 and a rise could start towards 66.10.
Forecasts presented in this section only reflect the author’s private opinion and should not be considered as guidance for trading. RoboForex bears no responsibility for trading results based on trading recommendations described in these analytical reviews.