Daily technical analysis and forecast for 10 November 2025
Here is a detailed daily technical analysis and forecast for EURUSD, USDJPY, GBPUSD, AUDUSD, USDCAD, XAUUSD and Brent for 10 November 2025.
EURUSD forecast
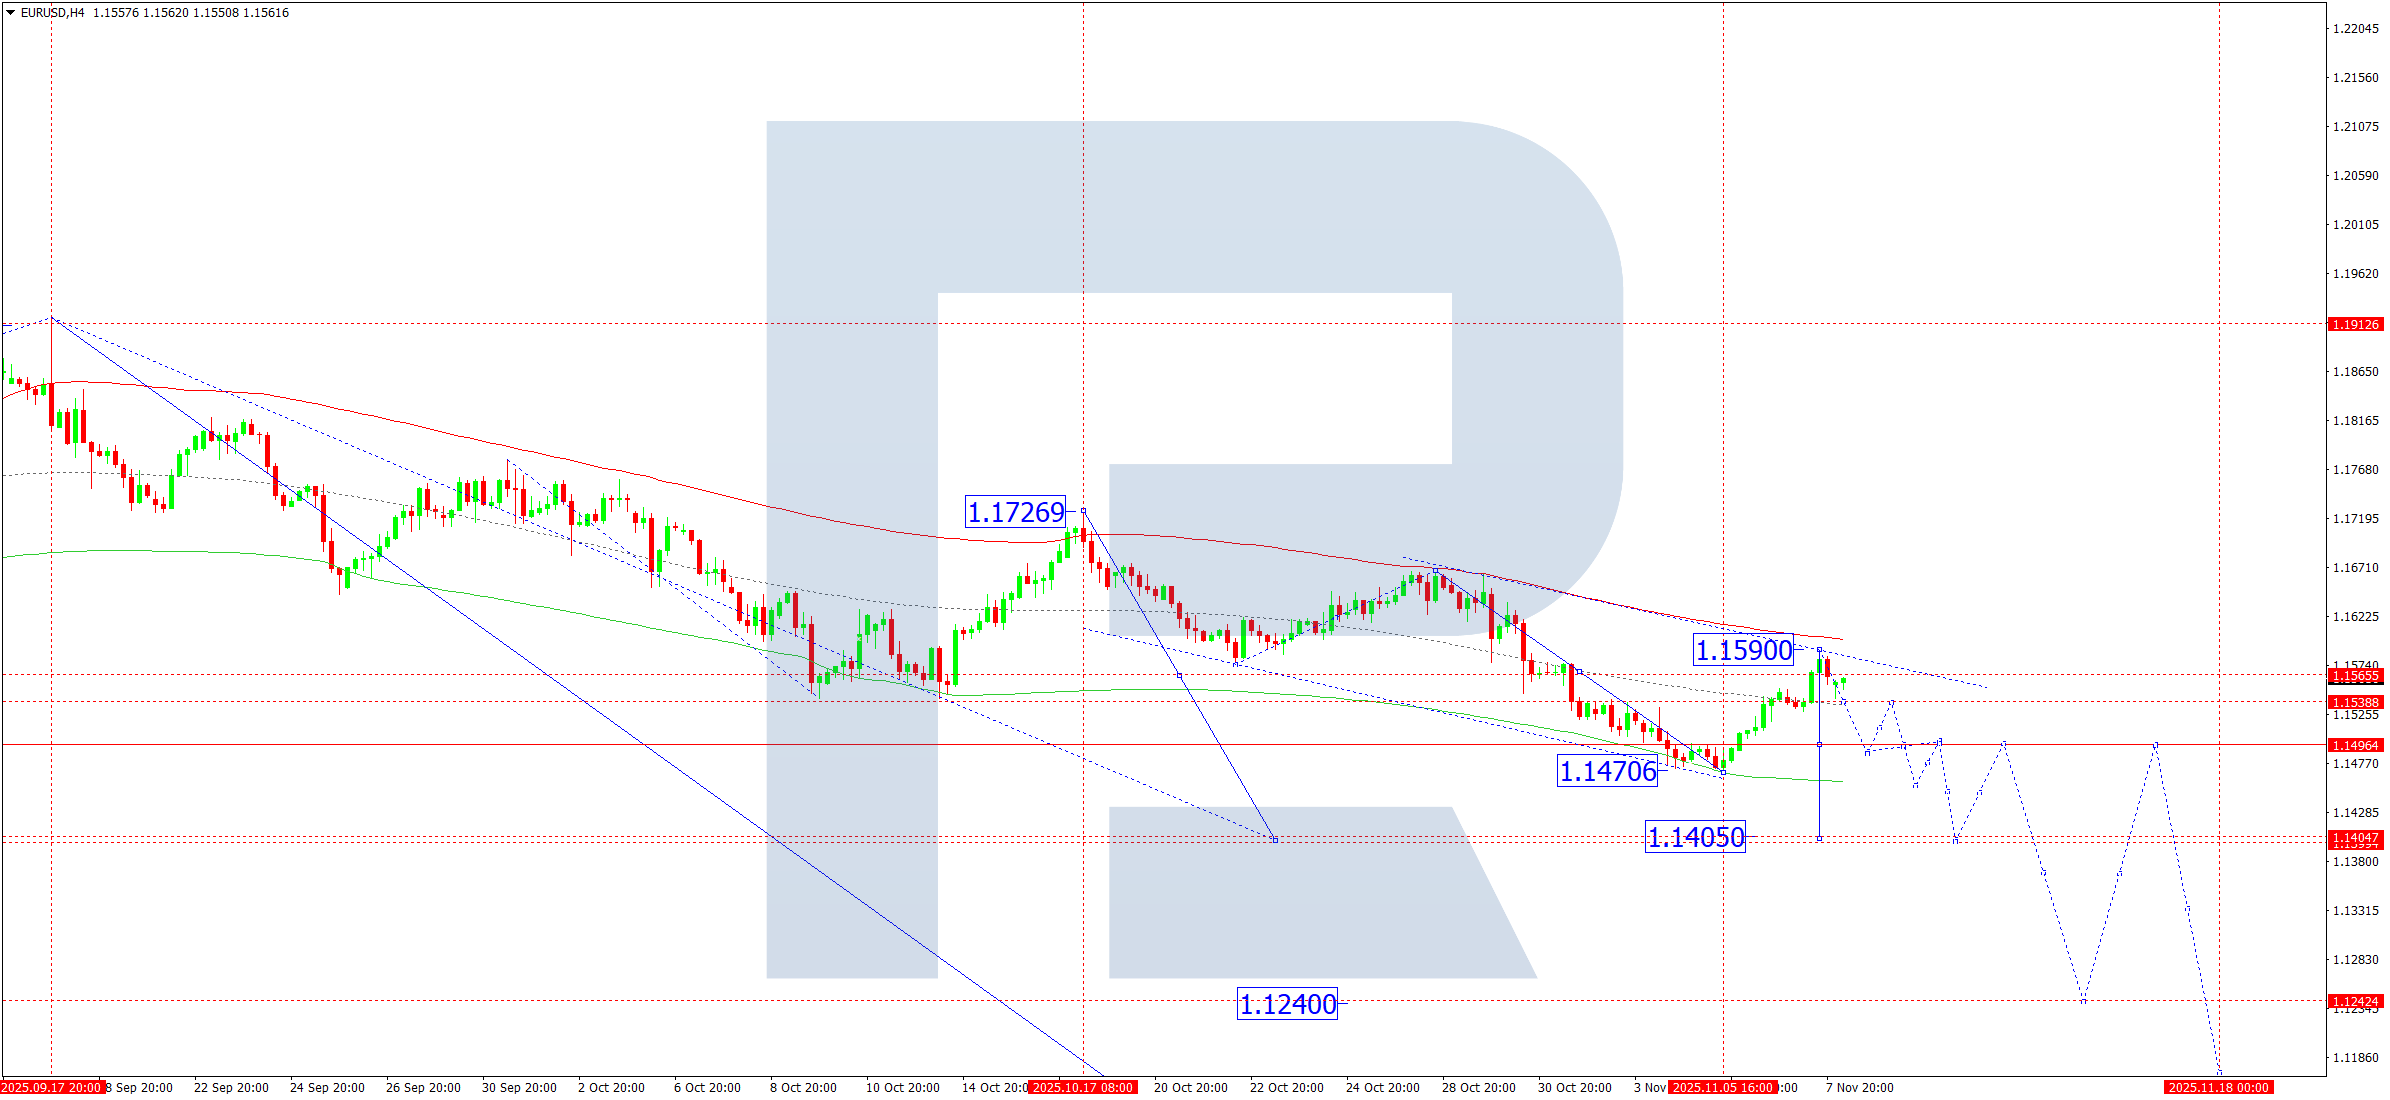
On the H4 chart of EURUSD, the market completed a downward move towards 1.1538. On 10 November 2025, a corrective move towards 1.1565 is possible. The market may define the limits of the consolidation range. A breakout above this range could trigger another corrective leg towards 1.1590. A breakout downwards may extend the third wave along the trend to 1.1490, and once below this level, the trend could continue towards at least 1.1405 as a local target.
This scenario is supported by the given Elliott wave structure and the matrix of the downward wave with a pivot point at 1.1650, which acts as a key element in the EURUSD wave structure. The correction may end today, followed by a decline towards the lower boundary of the Price Envelope at 1.1450, with the potential continuation of the trend towards 1.1405.
Technical indicators for today’s EURUSD forecast suggest a possible decline towards 1.1450.
USDJPY forecast
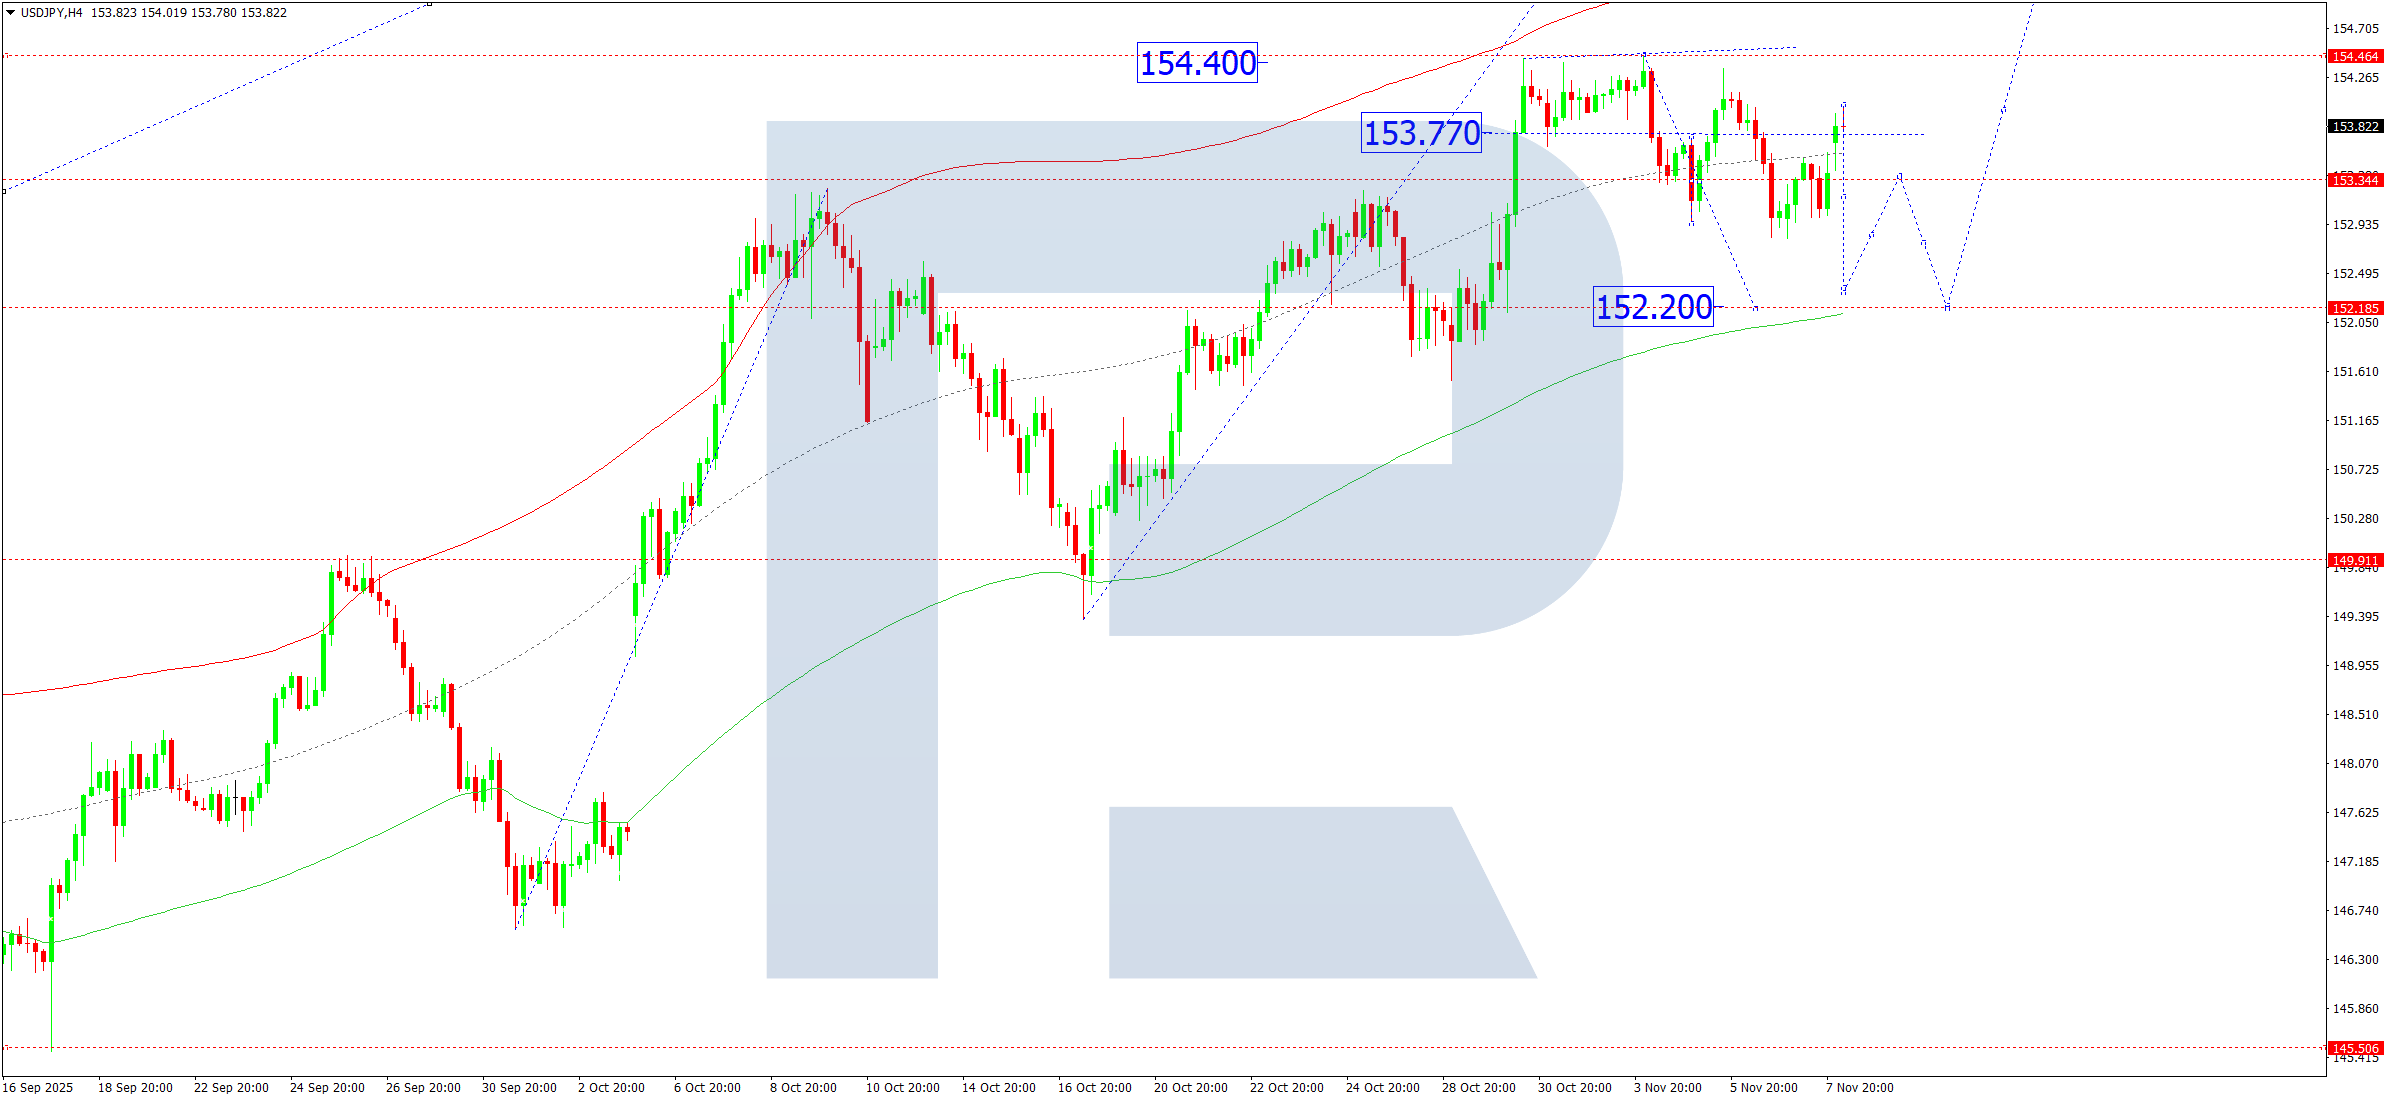
On the H4 chart of USDJPY, the market completed a downward wave towards 152.80 and is forming a correction towards 154.15. The market continues to develop a consolidation range around 153.33. On 10 November 2025, the range may expand downwards towards 152.20. A breakout upwards could open the potential for a continued upward movement towards 155.70, with an extension possibility to 157.57 as a local estimated target. A breakout downwards may lead to a corrective move towards 151.22 at least, followed by another rise towards 155.70.
This scenario for USDJPY is confirmed by the given Elliott wave structure and the matrix of the upward wave with a pivot point at 151.90, which serves as a key element in the structure of this wave. Currently, the market is forming a consolidation range around the central line of the Price Envelope at 153.33. A downward movement towards its lower boundary at 152.20 (testing from above) is possible, followed by growth towards its upper boundary at 155.70.
Technical indicators for today’s USDJPY forecast indicate the likelihood of a correction towards 152.20.
GBPUSD forecast
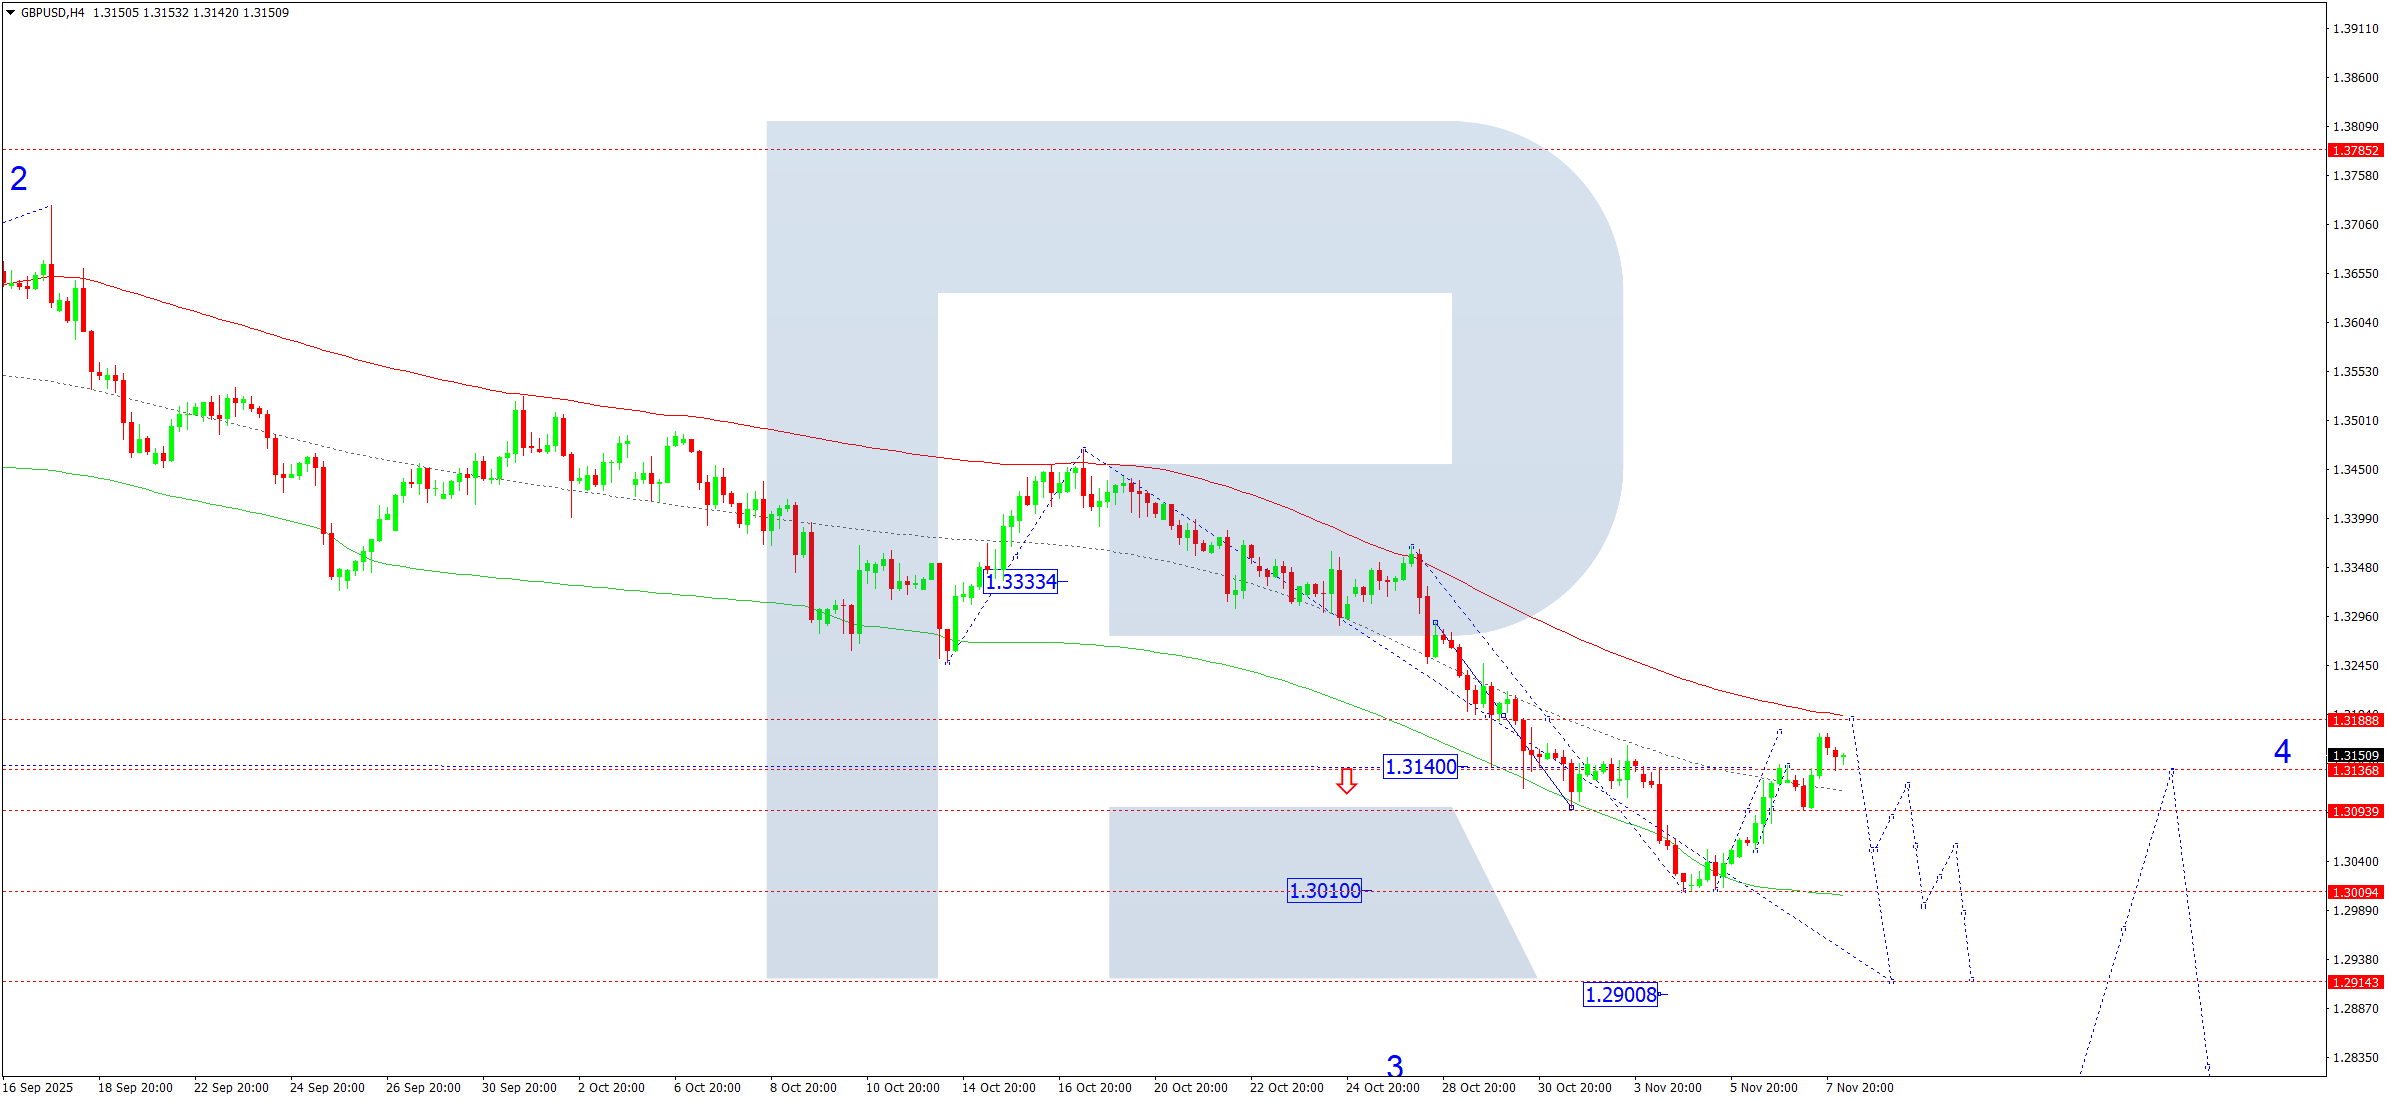
On the H4 chart of GBPUSD, the market continues to develop a correction towards 1.3188. On 10 November 2025, the correction may be complete, and a new downward wave towards 1.3055 may begin. A breakout below this level could extend the decline towards 1.2900, a local third-wave target within the downtrend.
This scenario for GBPUSD is confirmed by the given Elliott wave structure and the matrix of the downward wave with a pivot point at 1.3188, which acts as a key element in this wave structure. Currently, the correction wave is forming towards the upper boundary of the Price Envelope at 1.3188. The scenario for today includes the completion of the correction and the beginning of a downward wave towards its lower boundary at 1.2900.
Technical indicators for today’s GBPUSD forecast suggest a downward wave could start, aiming for 1.2900.
AUDUSD forecast
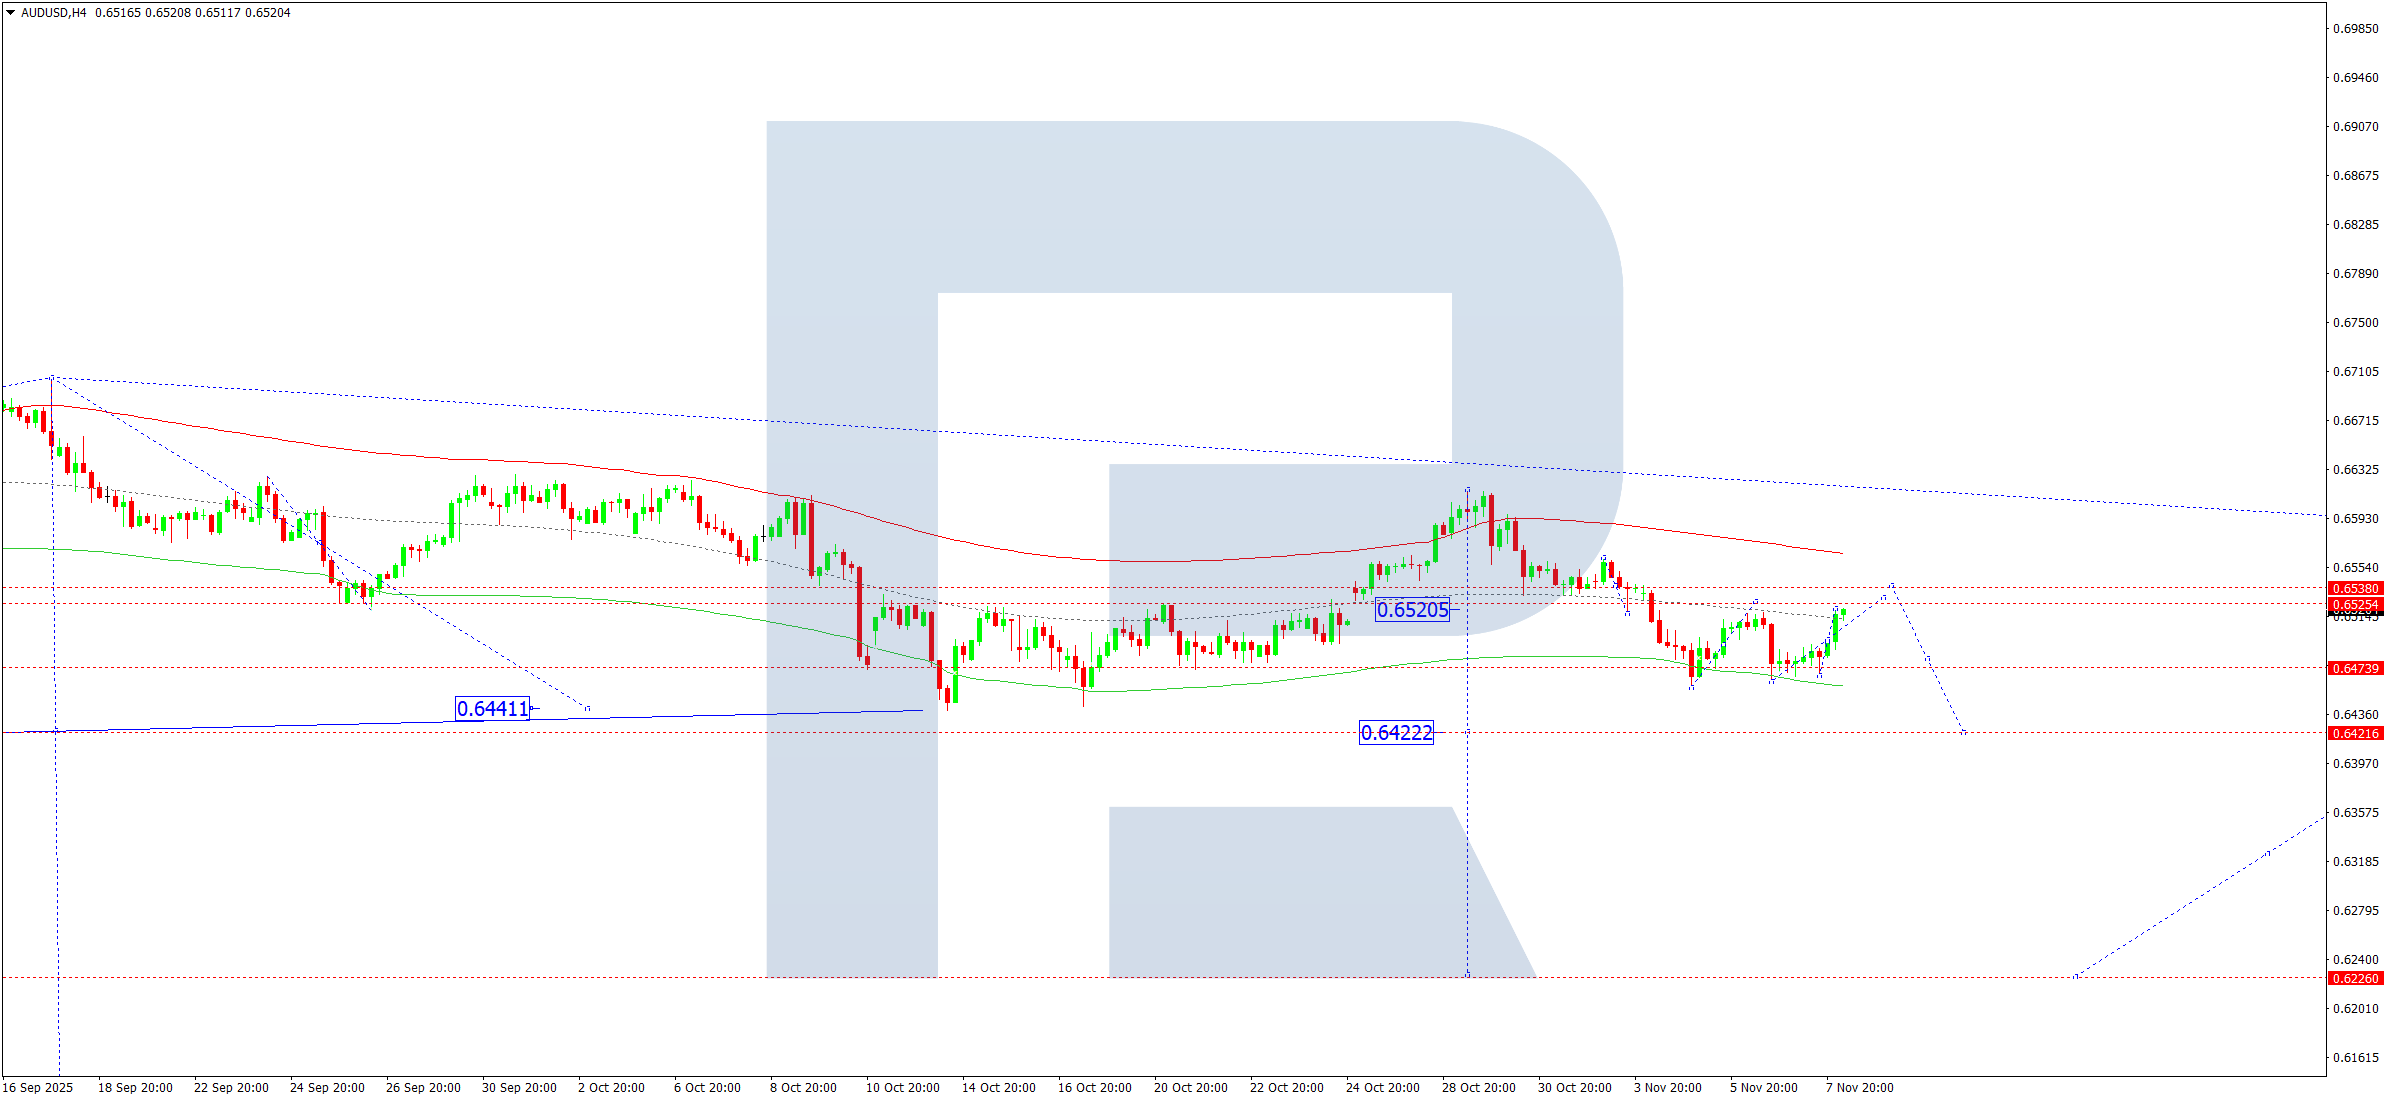
On the H4 chart of AUDUSD, the market is forming a correction towards 0.6538. On 10 November 2025, the correction may end and a downward wave towards 0.6470 may begin, with the potential continuation of the trend towards 0.6422. This represents only half of the third downward wave towards 0.6226, a local estimated target.
This scenario is confirmed by the given Elliott wave structure and the matrix of the downward wave in AUDUSD with a pivot point at 0.6470, which serves as a key element in this wave structure. Currently, the market is forming a corrective wave towards the upper boundary of the Price Envelope at 0.6538. The correction may end today, followed by a decline towards the lower boundary at 0.6422 and the continuation of the third wave towards 0.6226.
Technical indicators for today’s AUDUSD forecast suggest a possible start of a downward wave towards 0.6422.
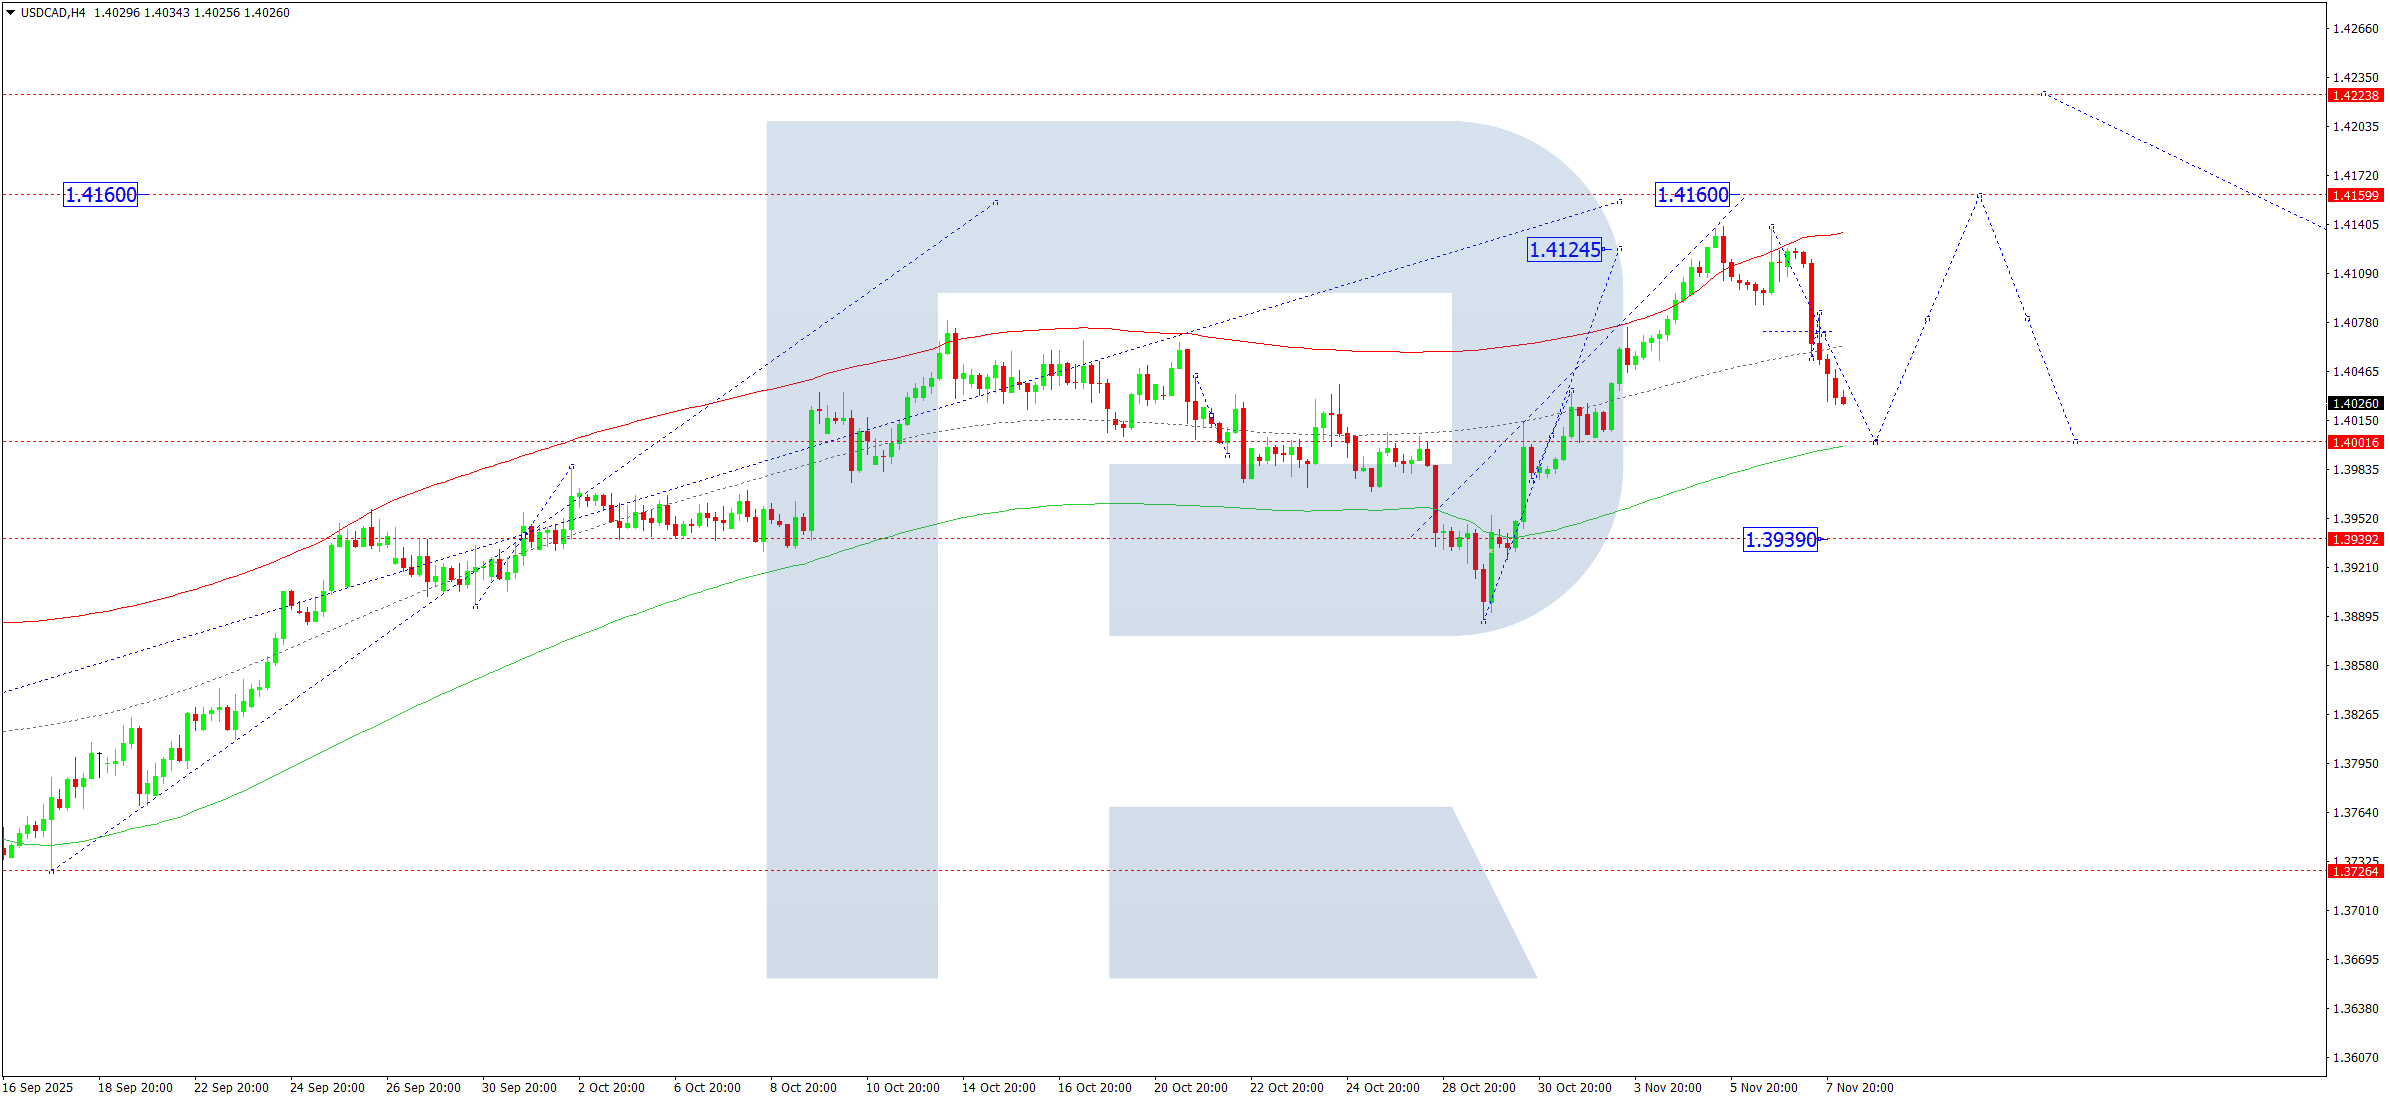
USDCAD forecast
On the H4 chart of USDCAD, the market continues to develop a correction towards 1.4000. On 10 November 2025, the correction may be complete, and a new upward wave towards 1.4160 may start, followed by a pullback towards 1.4080.
This scenario is supported by the given Elliott wave structure and the matrix of the upward wave with a pivot point at 1.3939, which acts as a key element in the USDCAD wave structure. Currently, the market is forming an upward move towards the upper boundary of the Price Envelope at 1.4160. Today’s relevant scenario involves a correction towards the lower boundary at 1.4000, followed by a possible start of a new upward wave towards 1.4160.
Technical indicators for today’s USDCAD forecast suggest the correction could be complete at 1.4000, with an upward wave continuing towards 1.4160.
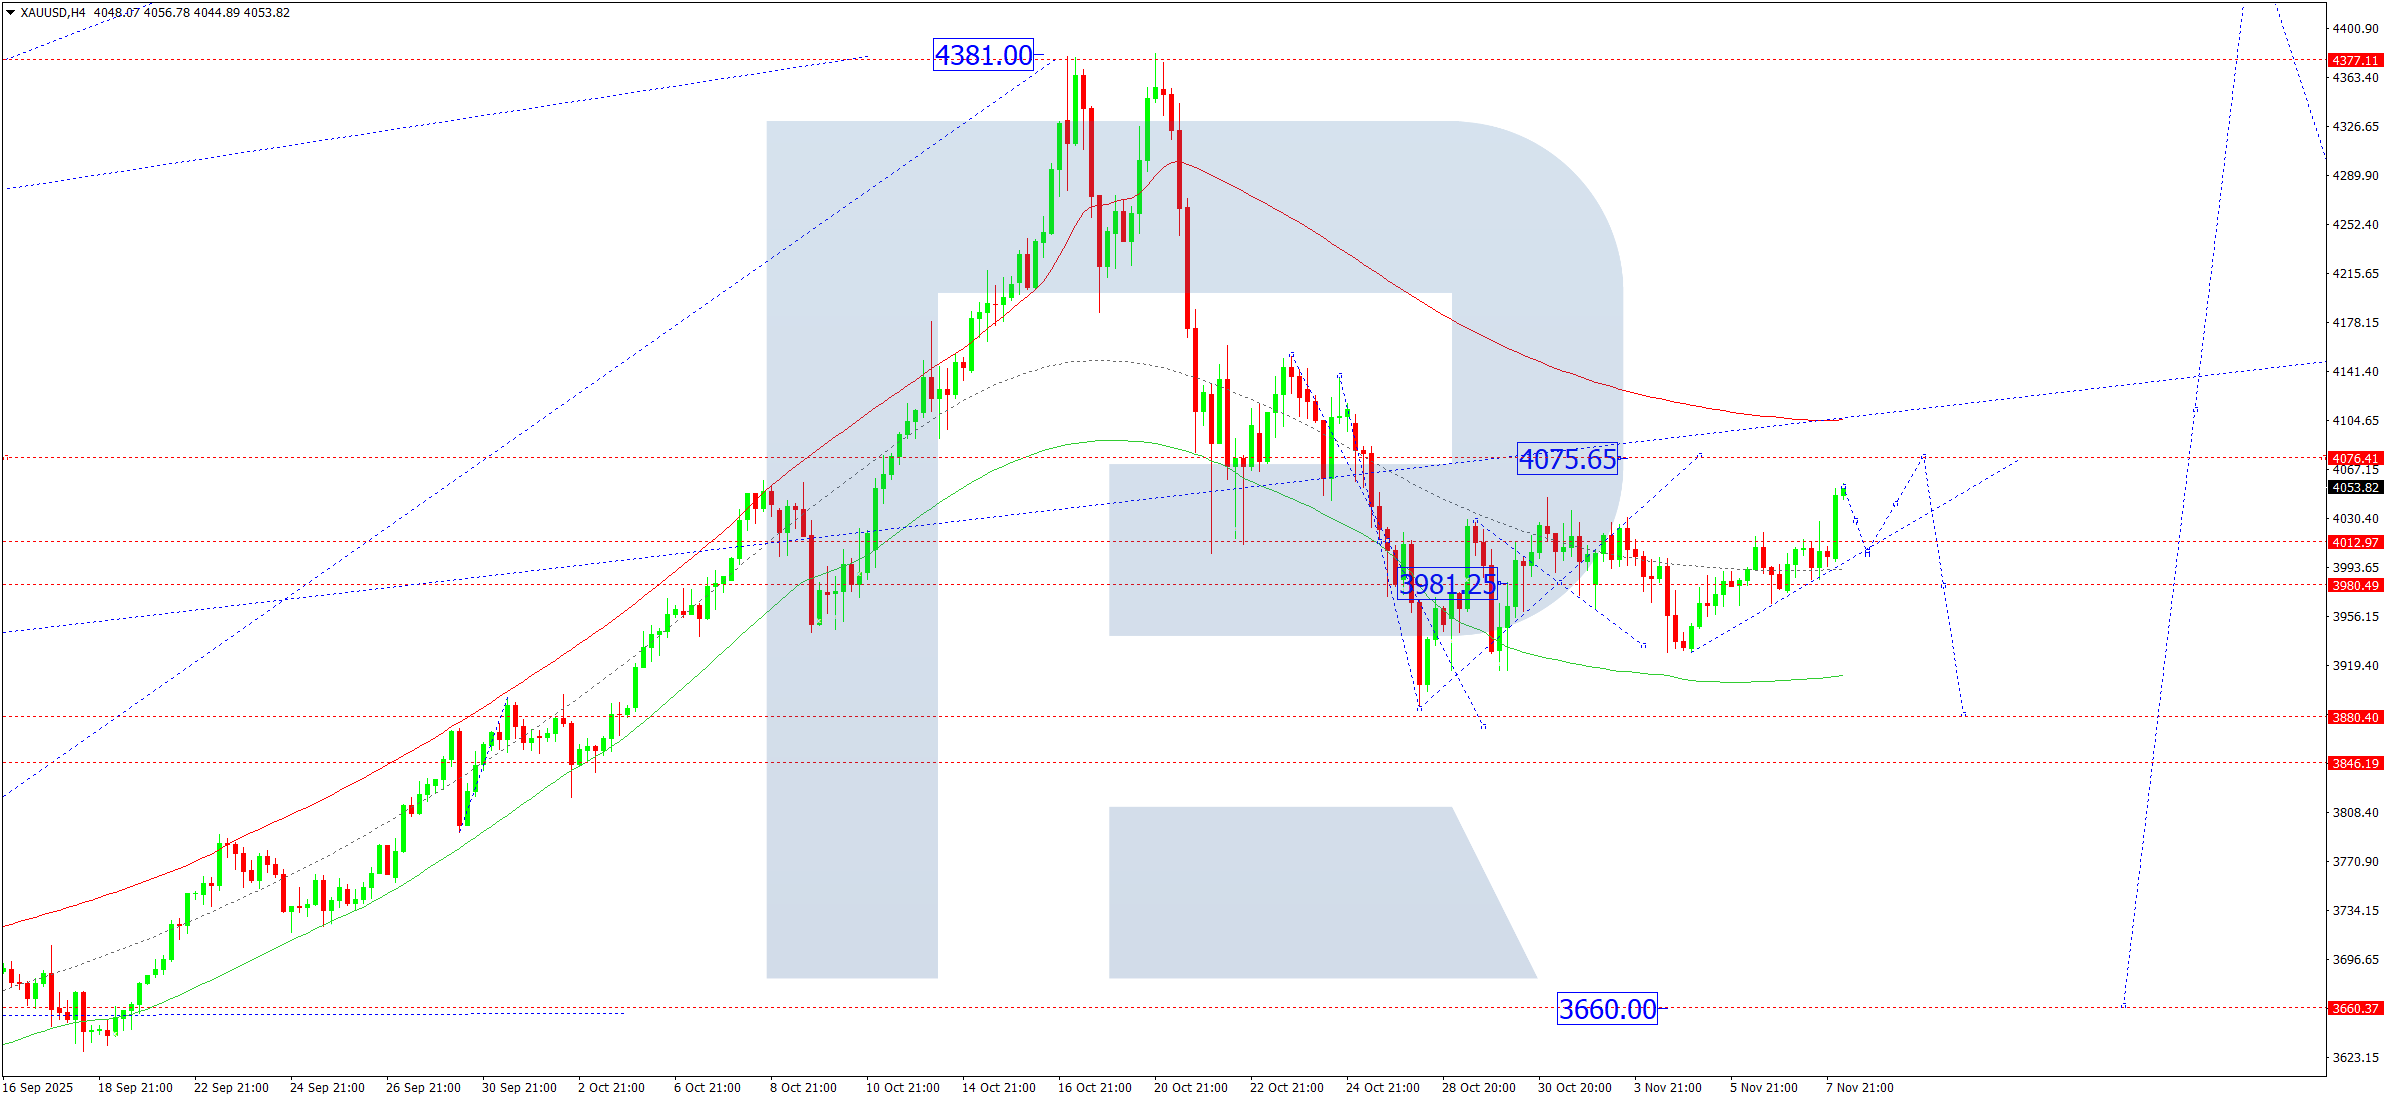
XAUUSD forecast
On the H4 chart of XAUUSD, the market continues to develop a consolidation range around 4,020 without a clear directional trend. On 10 November 2025, the range may expand upwards to 4,075, followed by a decline towards 3,880. The market effectively continues to move within a broader consolidation range around 4,020. A breakout downwards may lead to a further correction towards 3,660, while a breakout upwards could open the potential for a trend continuation towards 4,400.
This scenario is confirmed by the given Elliott wave structure and the matrix of the upward wave with a pivot point at 3,660, which acts as a key element in the XAUUSD wave structure. Currently, the market is forming a corrective move towards the lower boundary of the Price Envelope at 3,880, followed by an upward move towards its central line at 4,020.
Technical indicators for today’s XAUUSD forecast indicate a possible decline towards 3,880.
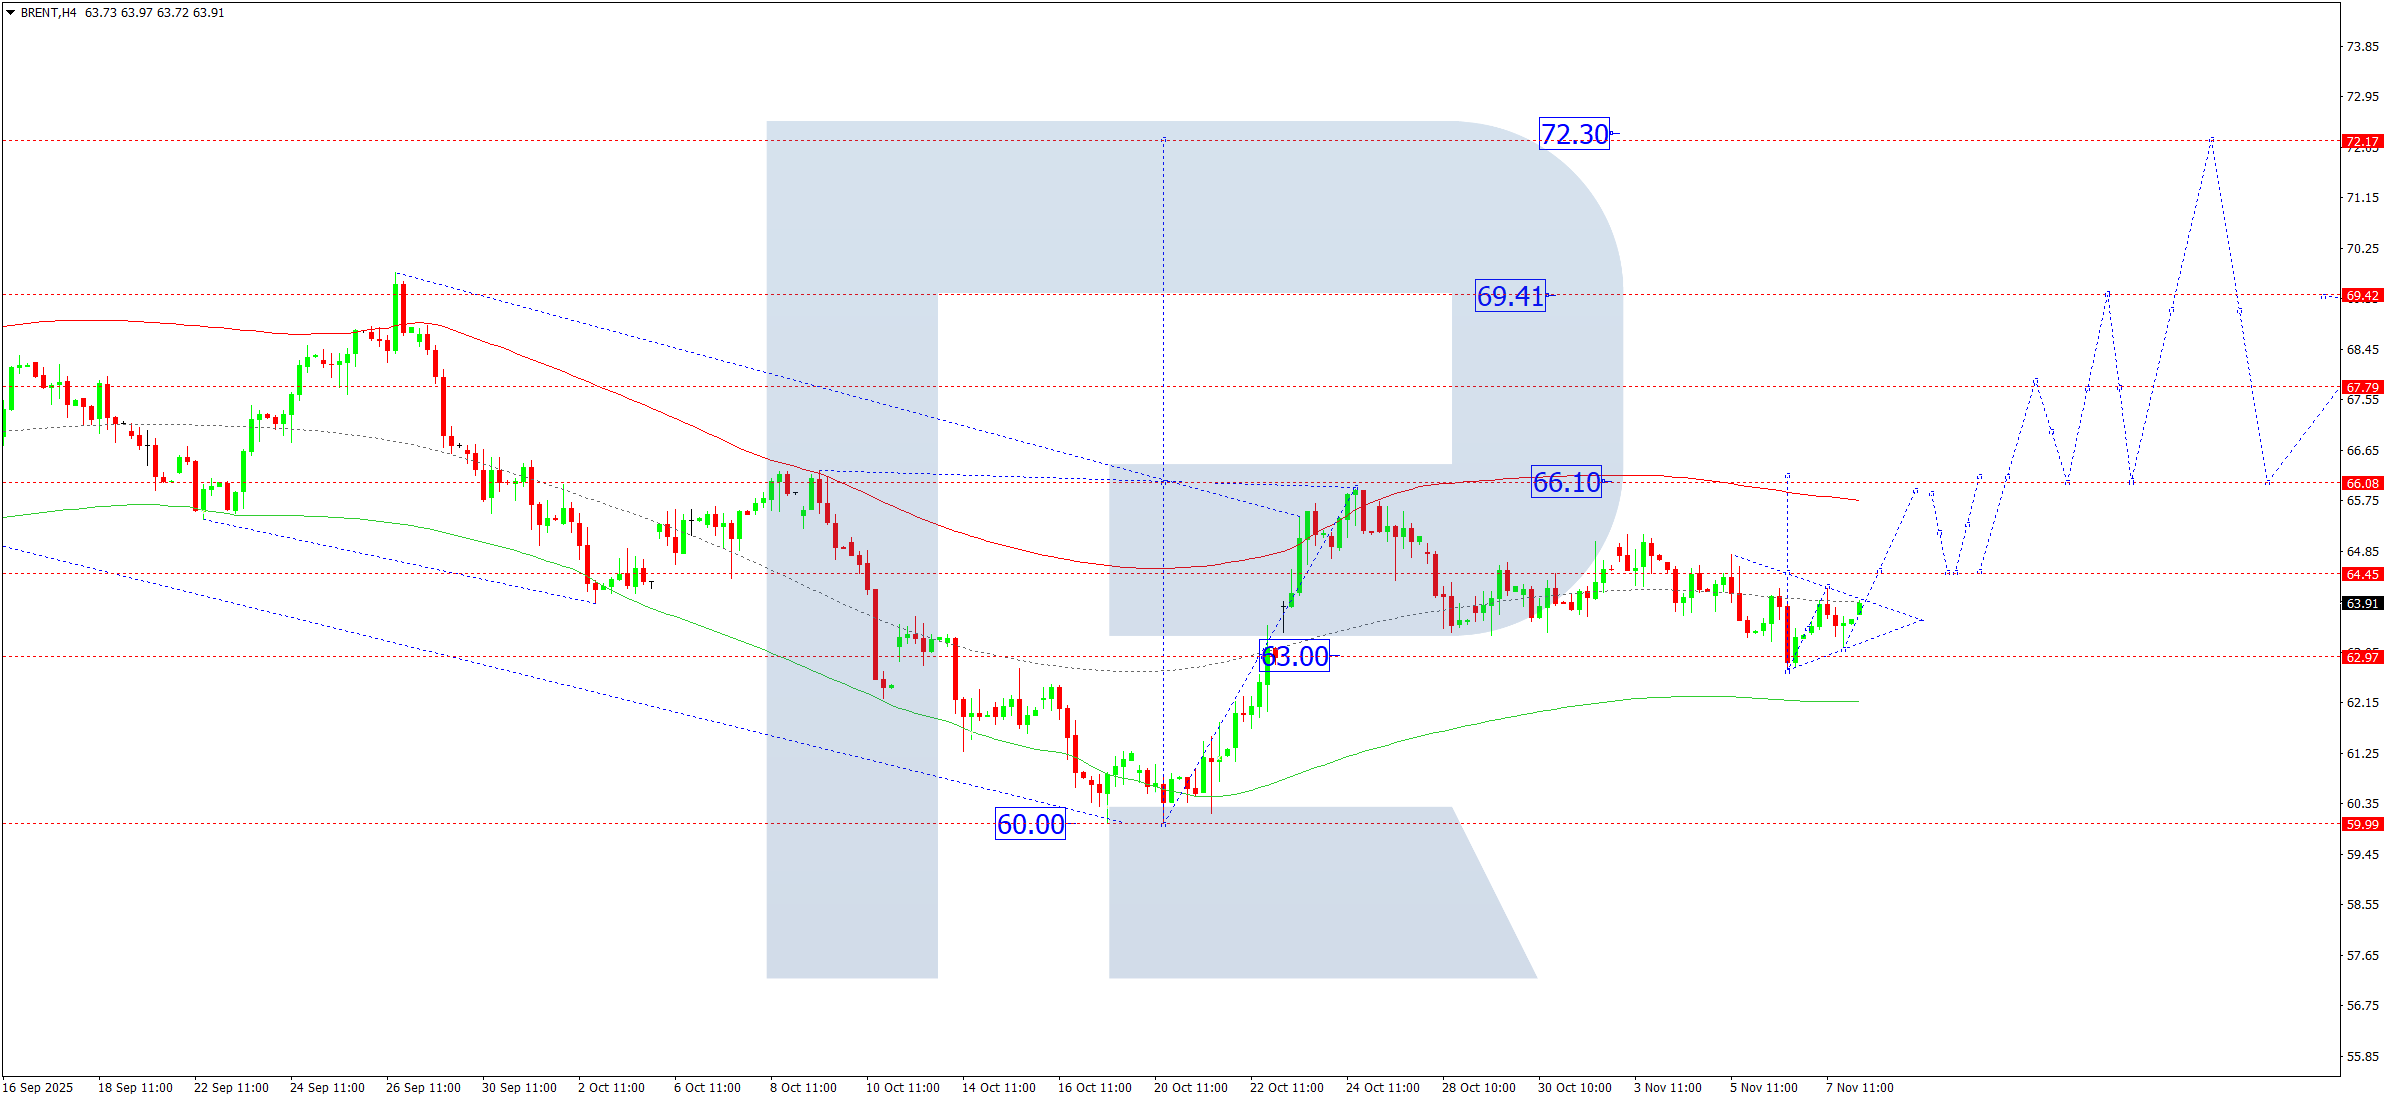
Brent forecast
On the H4 chart of Brent crude oil, the market completed an upward impulse towards 64.22, followed by a correction to 63.11. On 10 November 2025, another upward move towards 64.55 is possible. A breakout above this level could trigger a further upward wave towards 66.10 at least. Later, a compact consolidation range may form around this level. A breakout upwards could extend the wave towards 69.40, with the potential continuation of the trend towards 72.30.
This scenario is confirmed by the given Elliott wave structure and the matrix of the upward wave with a pivot point at 66.10, which serves as a key element in the Brent wave structure. Currently, the market has completed a correction towards the lower boundary of the Price Envelope at 62.75. Today’s outlook includes the possible start of an upward impulse towards the upper boundary at 66.10.
Technical indicators for today’s Brent forecast suggest the beginning of a rise towards 69.40.
Forecasts presented in this section only reflect the author’s private opinion and should not be considered as guidance for trading. RoboForex bears no responsibility for trading results based on trading recommendations described in these analytical reviews.