Daily technical analysis and forecast for 3 November 2025
Here is a detailed daily technical analysis and forecast for EURUSD, USDJPY, GBPUSD, AUDUSD, USDCAD, XAUUSD and Brent for 3 November 2025.
EURUSD forecast
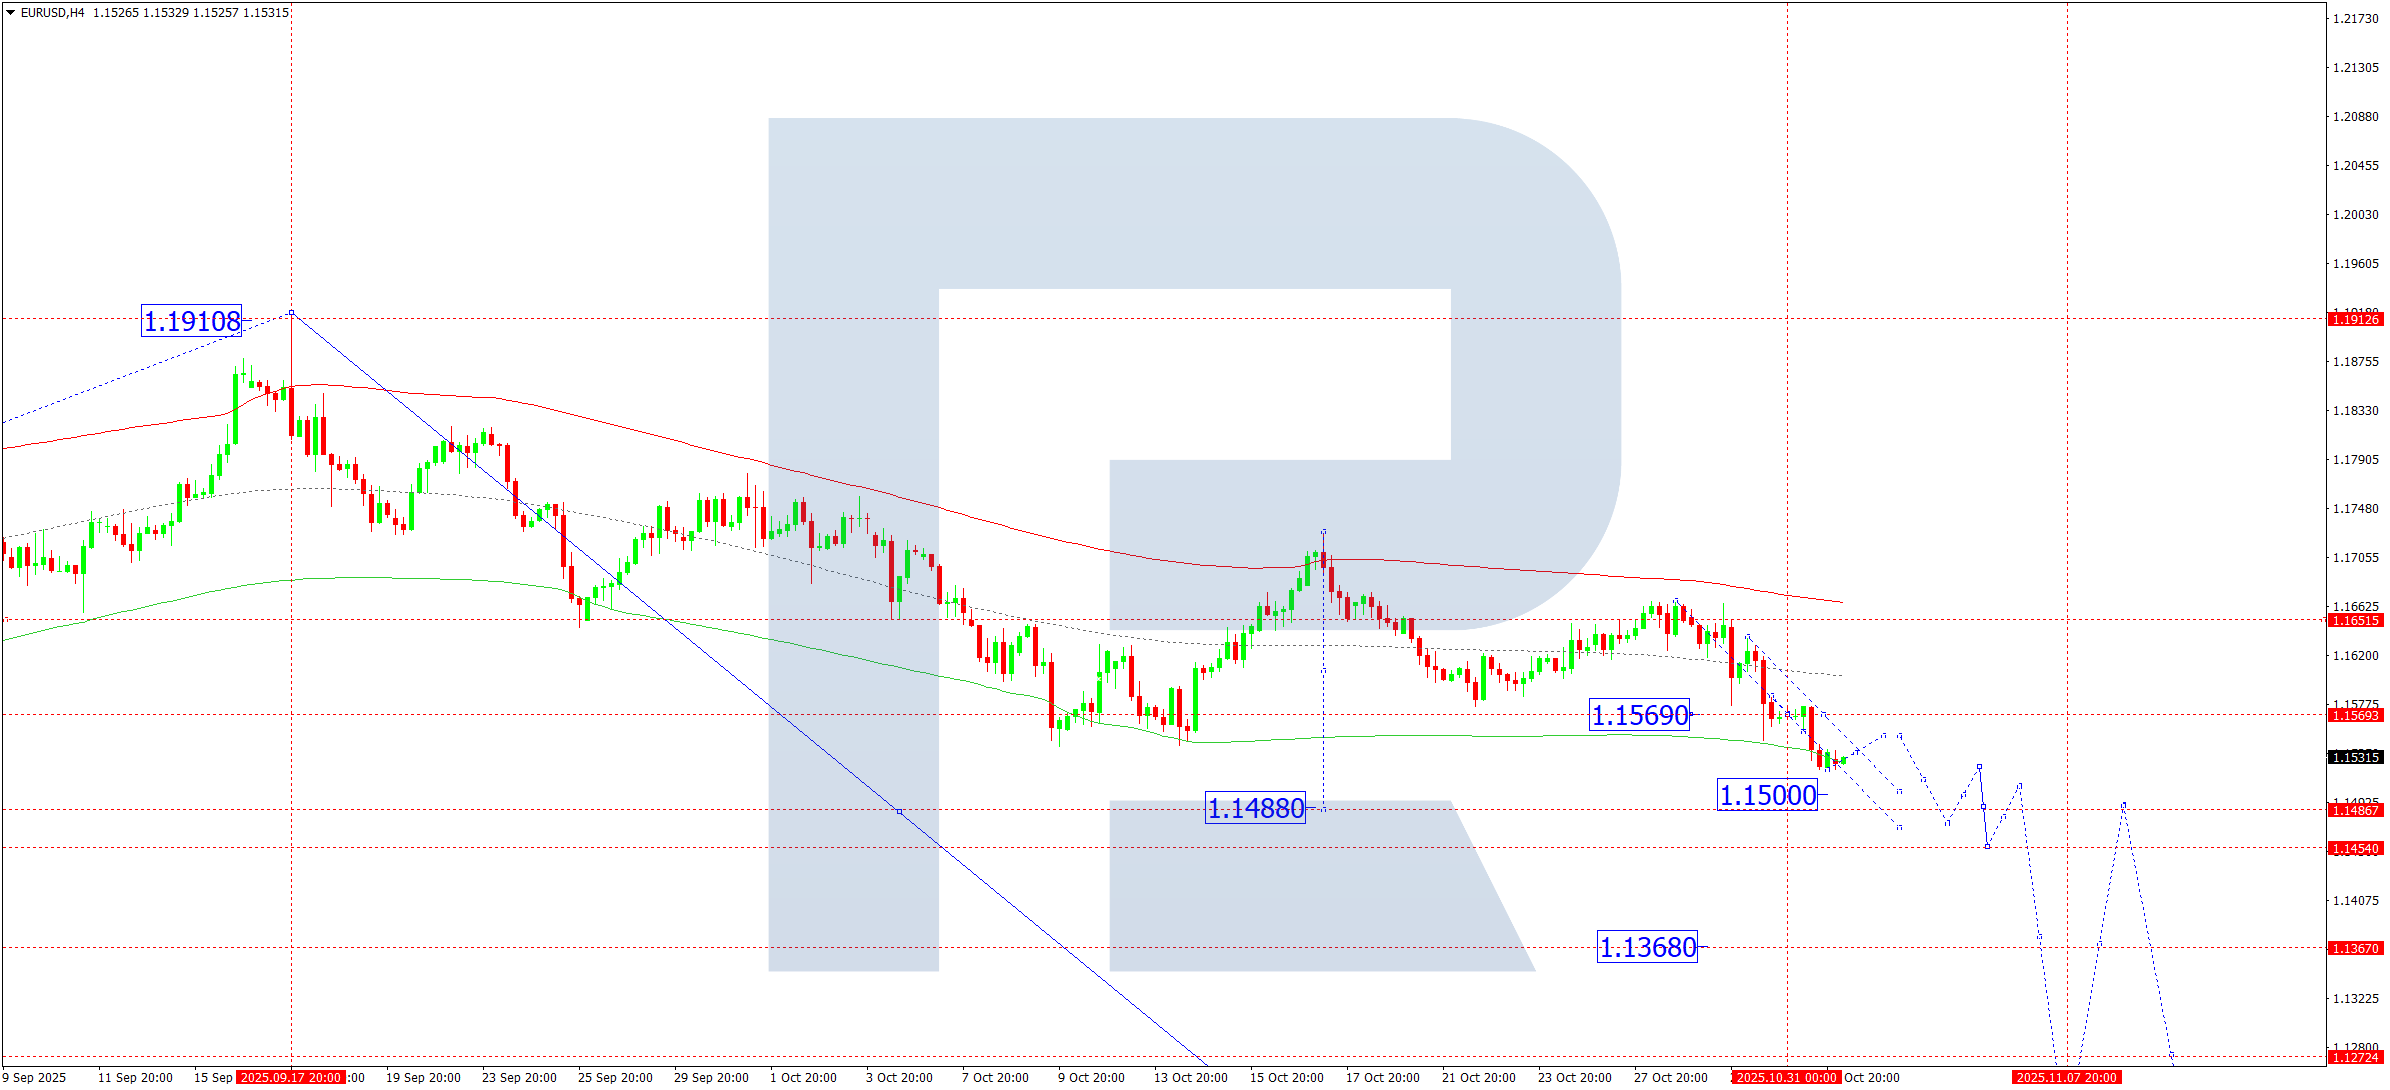
On the H4 chart, the EURUSD pair completed a downward wave to 1.1521. On 3 November 2025, the market may continue to decline towards 1.1500, with potential to extend the structure to 1.1488. Afterwards, consolidation around this level is possible. A downside breakout would open potential for continuation of the wave to 1.1420. The main target remains at 1.1240.
Technically, this scenario is confirmed by the Elliott Wave structure and the bearish wave matrix with a pivot point at 1.1570, which is key in EURUSD’s wave structure. A move towards the lower boundary of the Price Envelope at 1.1488 is expected today, followed by a corrective rise towards its central line at 1.1550.
Technical indicators for today’s EURUSD forecast suggest a decline towards 1.1500 and 1.1488.
USDJPY forecast
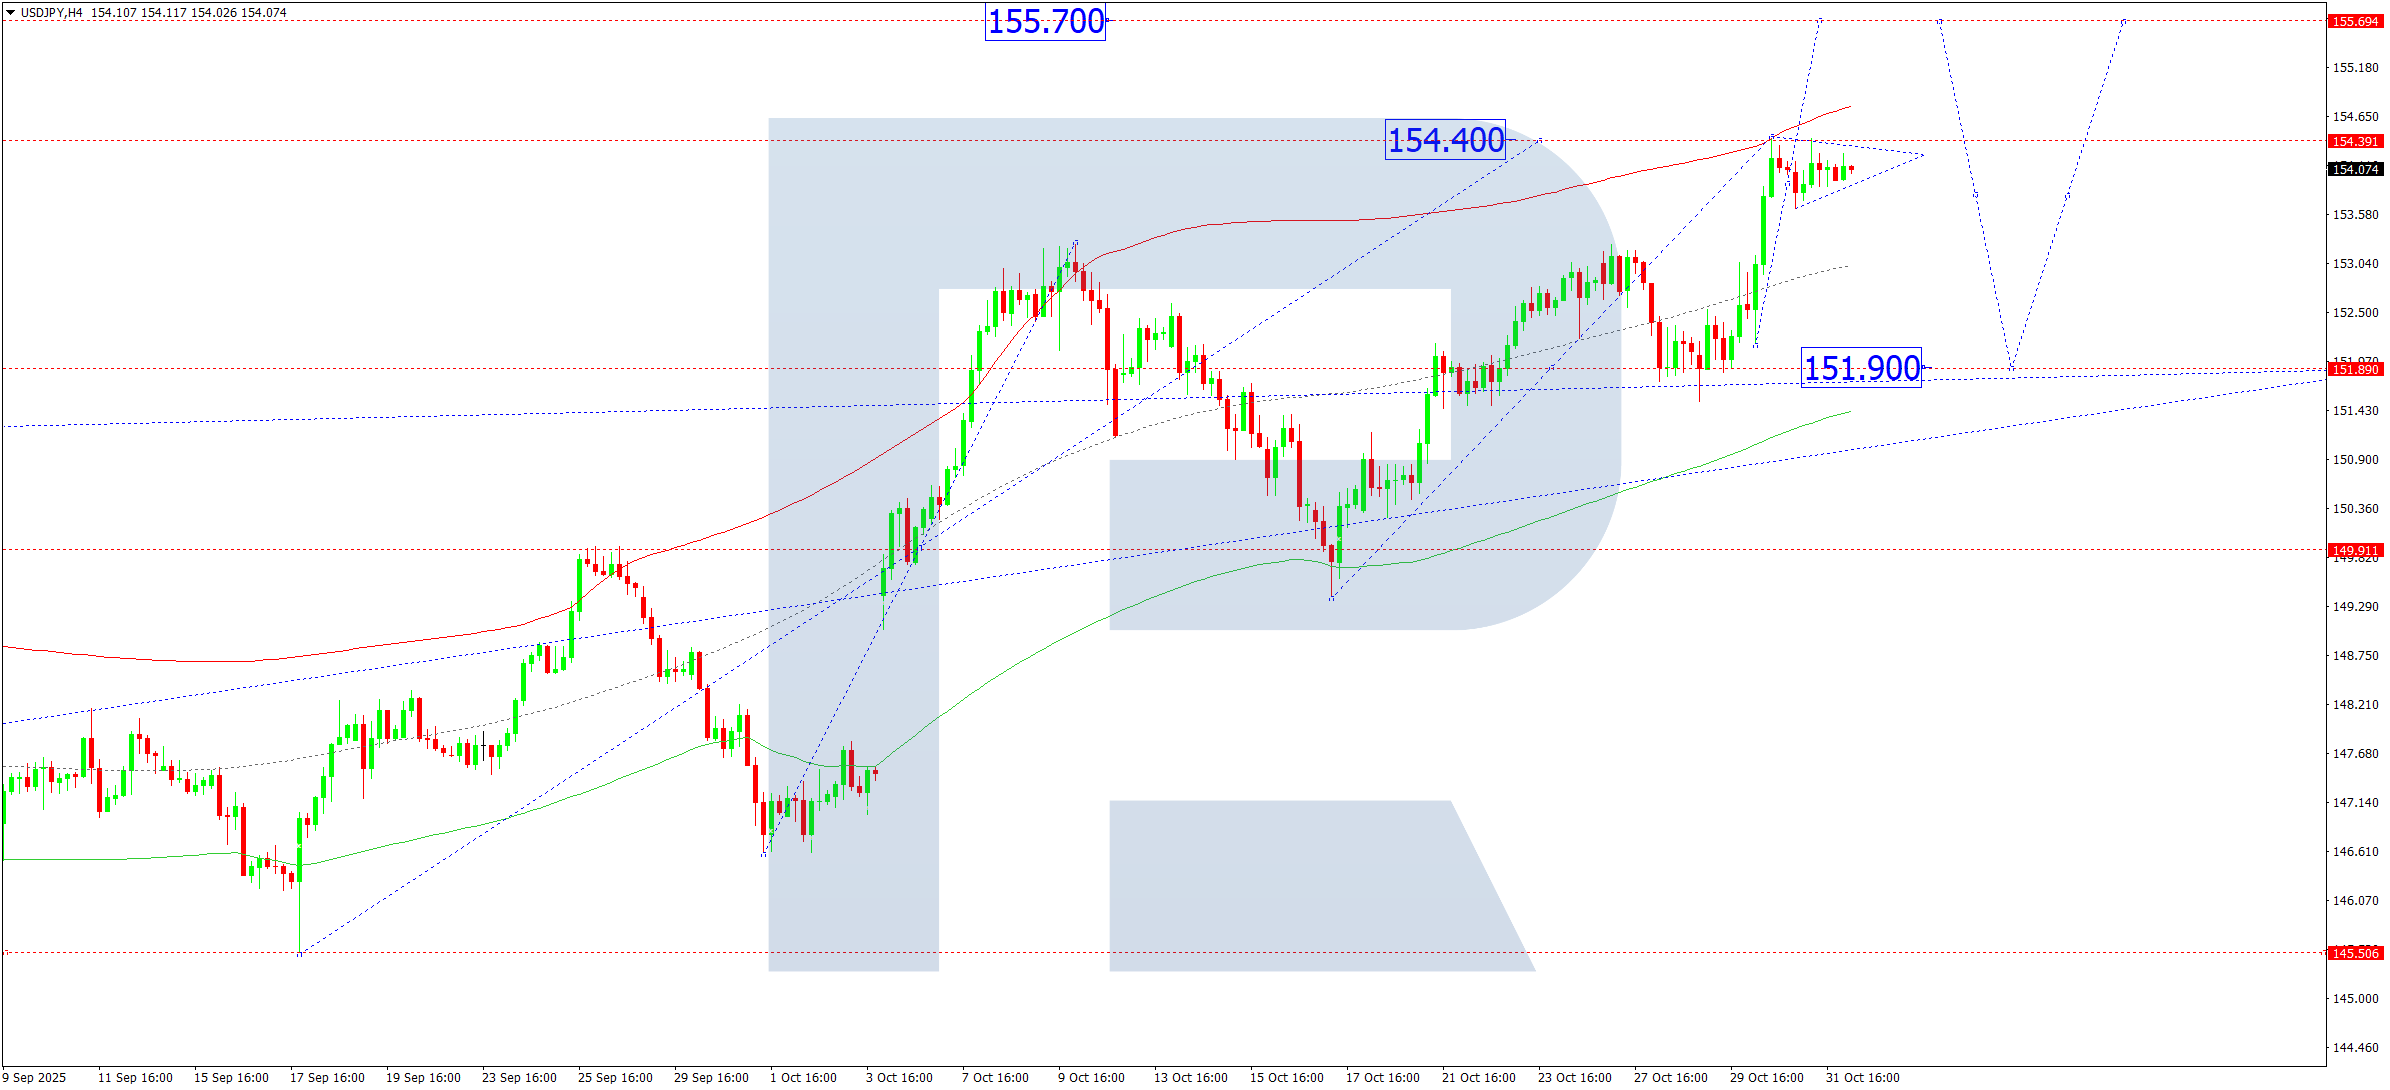
On the H4 chart, the USDJPY pair completed a growth wave towards 154.40. On 3 November 2025, the pair is expected to develop a consolidation range below this level. An upside breakout would open potential for continuation towards 155.70, with prospects of stretching the wave to 157.57 as a local estimated target. A downside breakout could trigger a correction towards at least 151.90.
Technically, this scenario is supported by the Elliott Wave structure and the bullish wave matrix with a pivot point at 151.90, which is key in this wave. The market reached the upper boundary of the Price Envelope at 154.40. A correction towards its central line at 153.15 is possible, followed by a continuation to its lower boundary at 151.90 (testing from above).
Technical indicators for today’s USDJPY forecast suggest a correction towards 153.15 and 151.88.
GBPUSD forecast
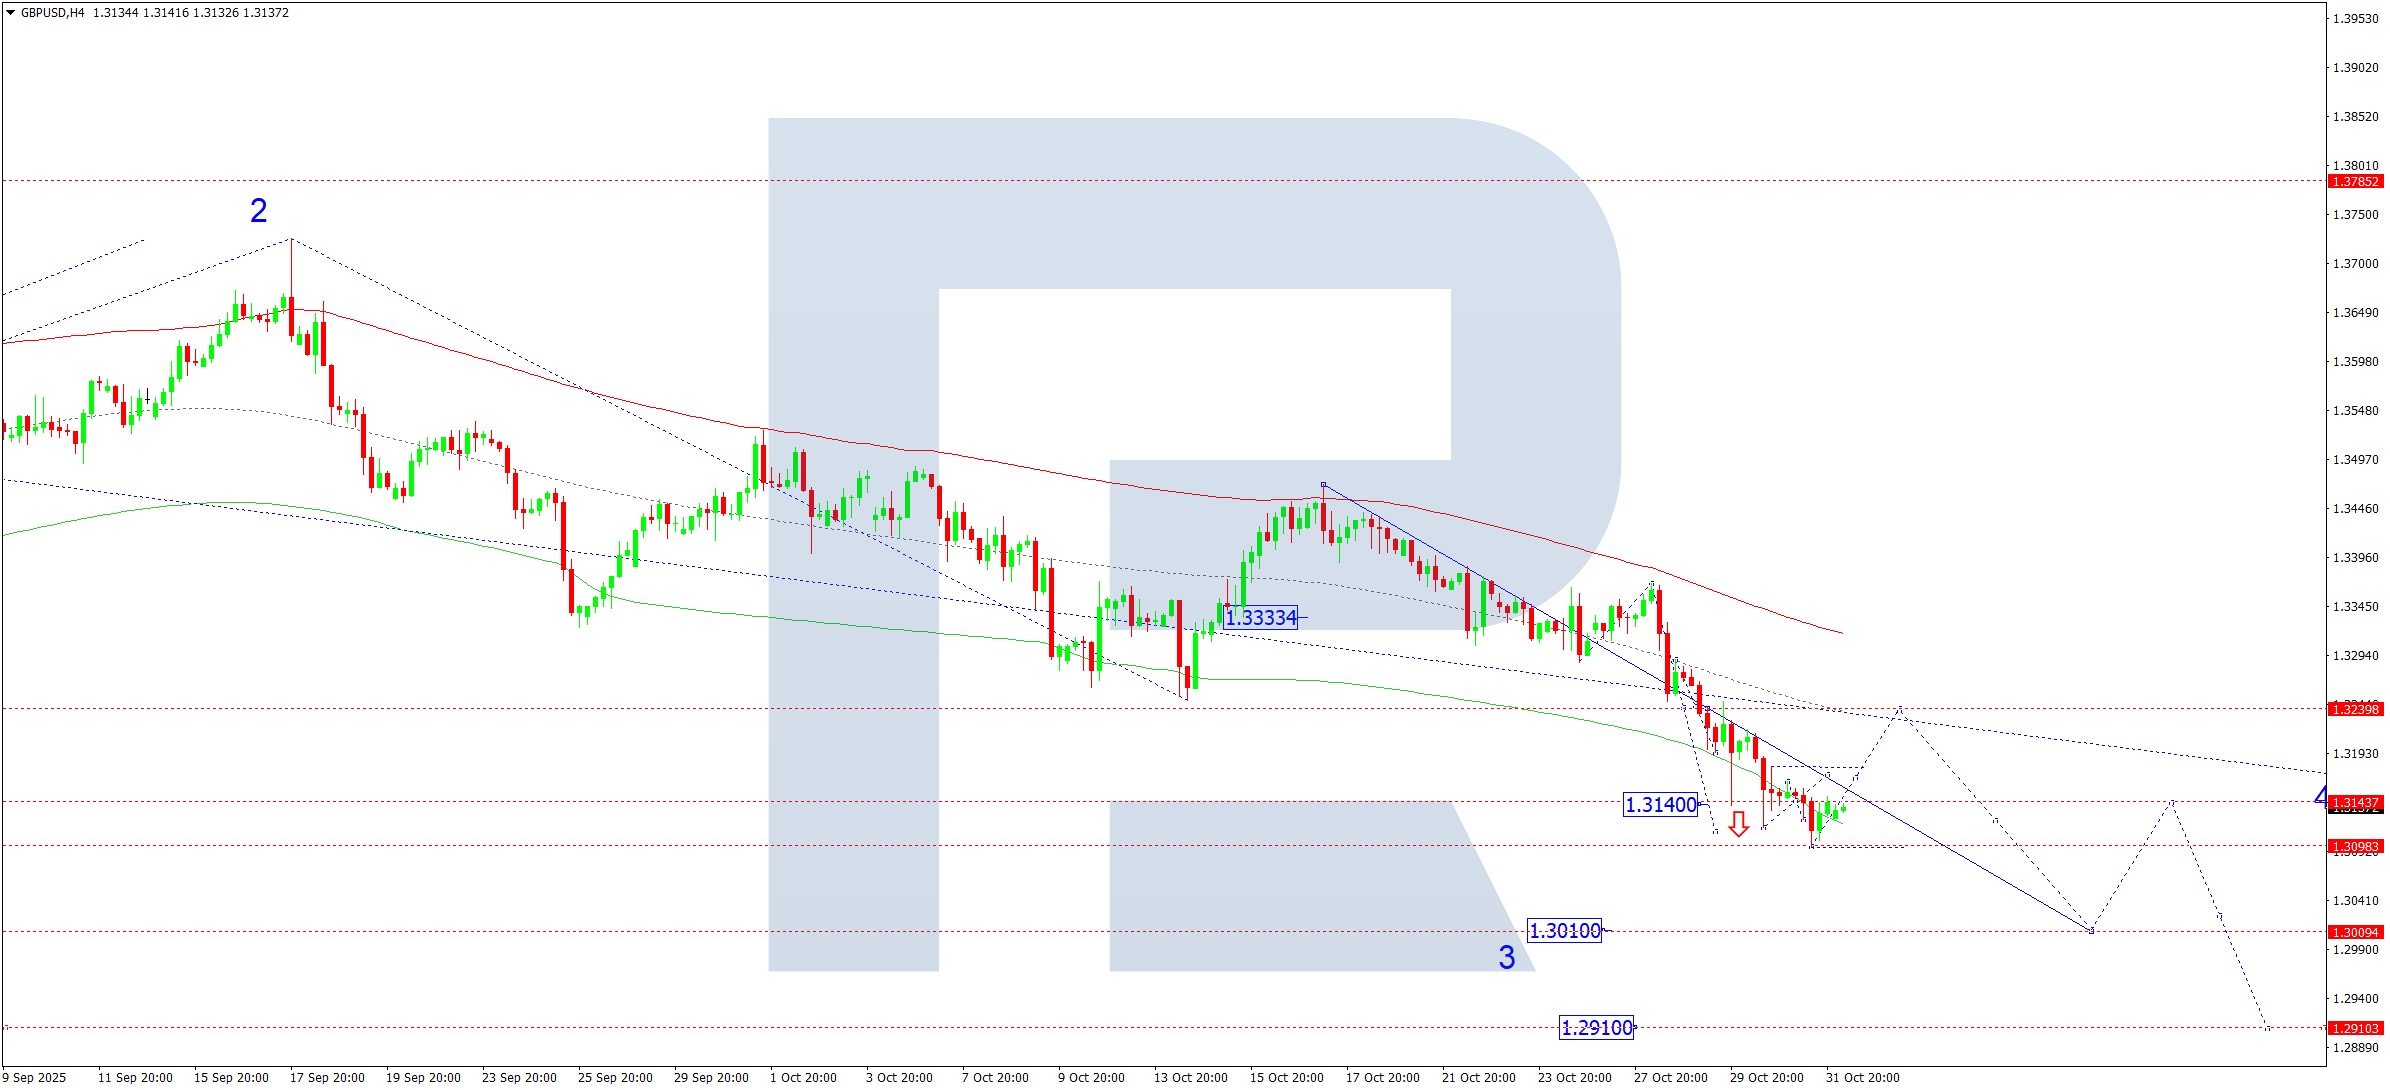
On the H4 chart, the GBPUSD pair reached its downside target at 1.3097. On 3 November 2025, the market is expected to form a consolidation range around 1.3140. An upside breakout could lead to a correction towards 1.3240, while a downside breakout would open potential for continuation of the downward wave to at least 1.3010.
Technically, this scenario is confirmed by the Elliott Wave structure and the bearish wave matrix with a pivot point at 1.3240, which is key for this wave. The market completed a decline to the lower boundary of the Price Envelope at 1.3097, a local target. A corrective rise towards the central line at 1.3240 is possible, followed by a drop to its lower boundary at 1.3010.
Technical indicators for today’s GBPUSD forecast suggest a correction towards 1.3240 and a subsequent decline towards 1.3010.
AUDUSD forecast
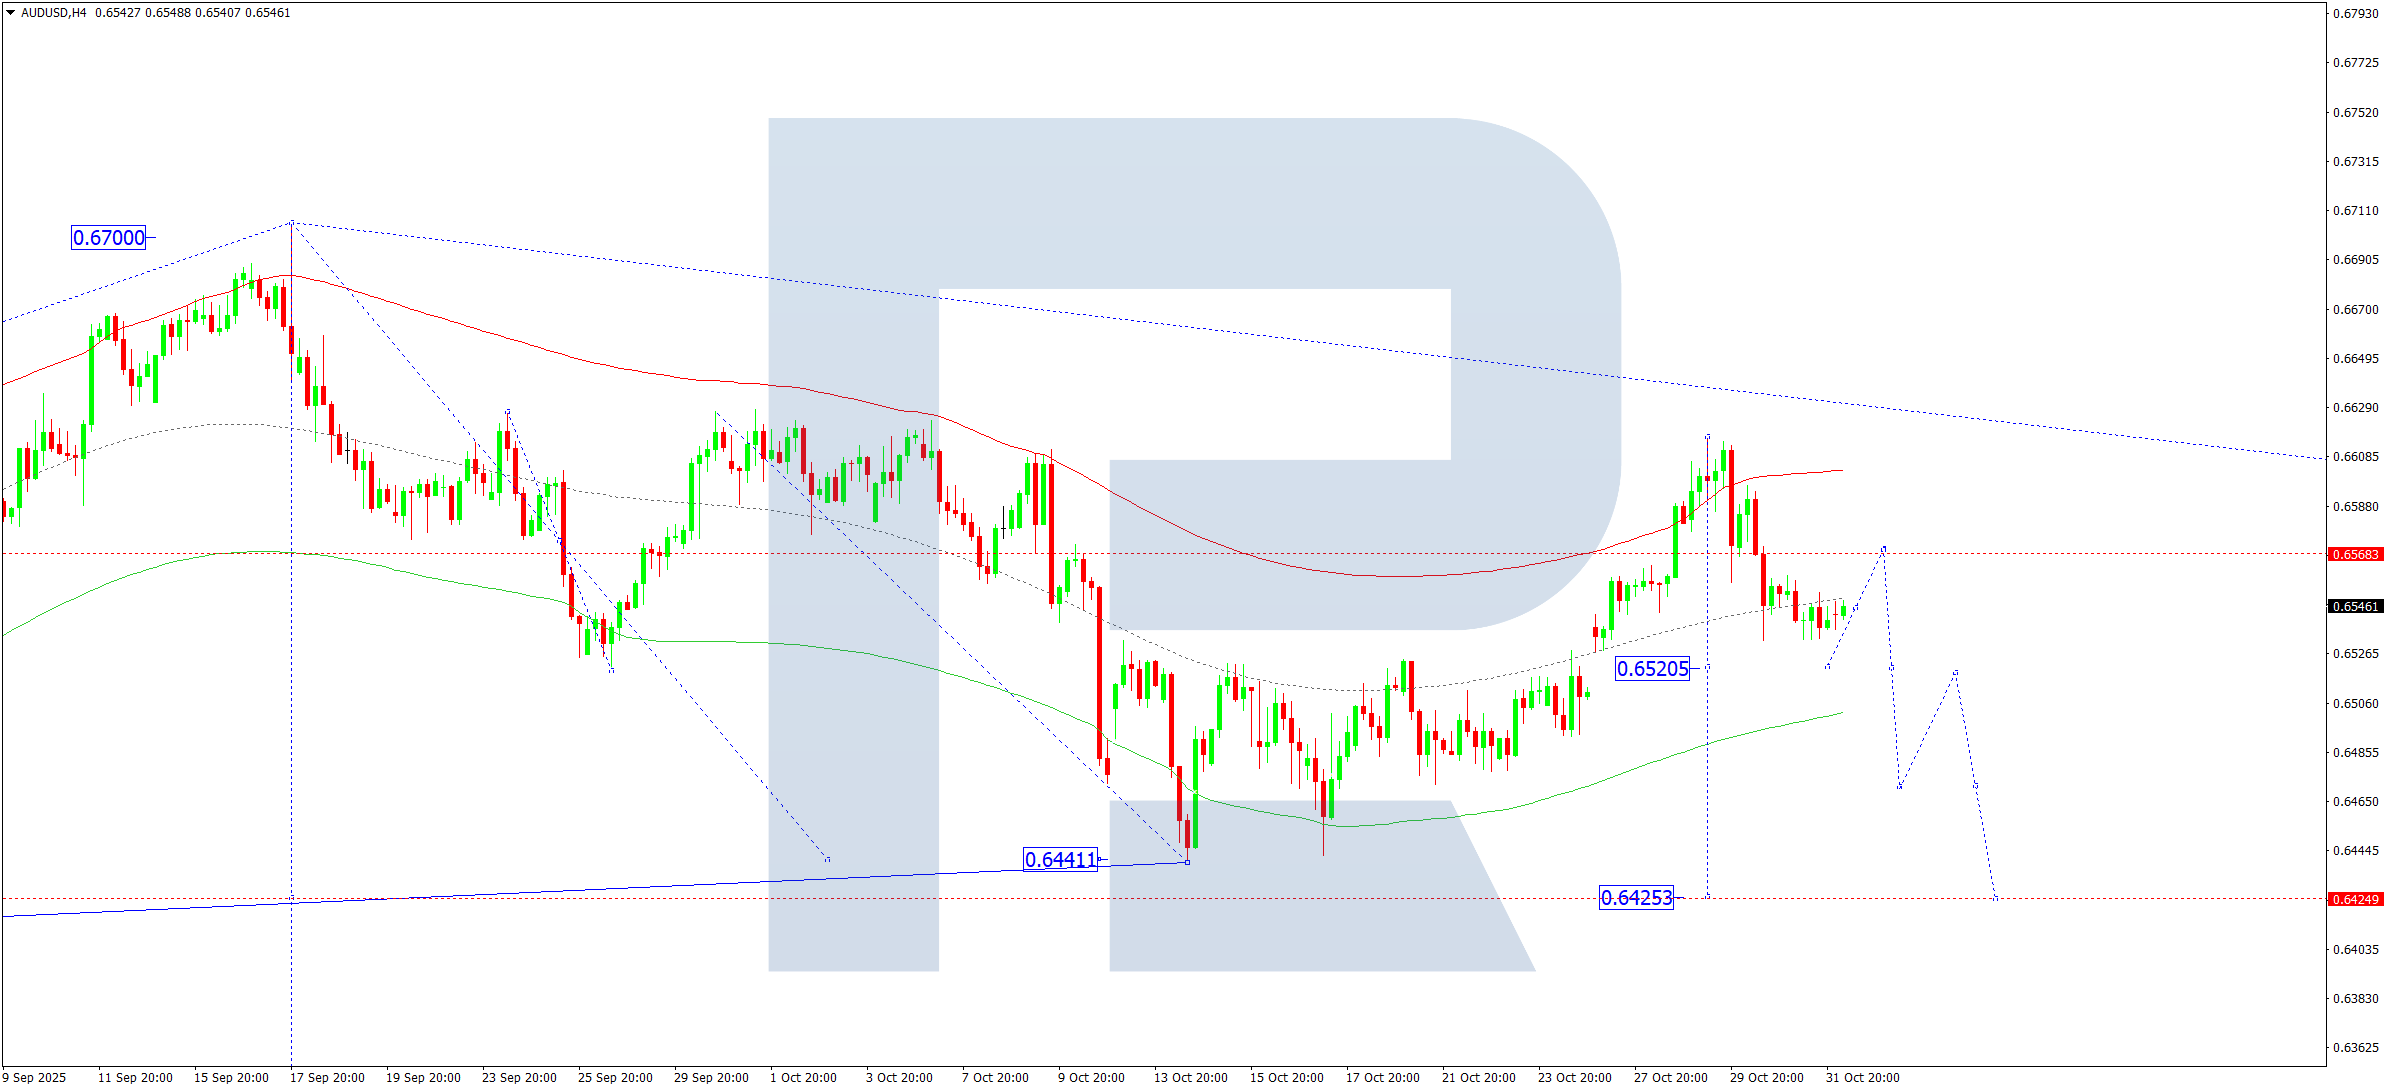
On the H4 chart, the AUDUSD pair completed a downward wave to 0.6532. On 3 November 2025, a consolidation range is forming above this level. A downside breakout would open potential for continuation of the wave towards 0.6470, with prospects of extending the trend to 0.6425.
Technically, this scenario is confirmed by the Elliott Wave structure and the bearish wave matrix with a pivot point at 0.6533, considered key in this wave. The market completed a corrective move to the upper boundary of the Price Envelope at 0.6616. A decline towards the lower boundary at 0.6470 is expected today.
Technical indicators for today’s AUDUSD forecast suggest the beginning of a downward wave towards 0.6470.
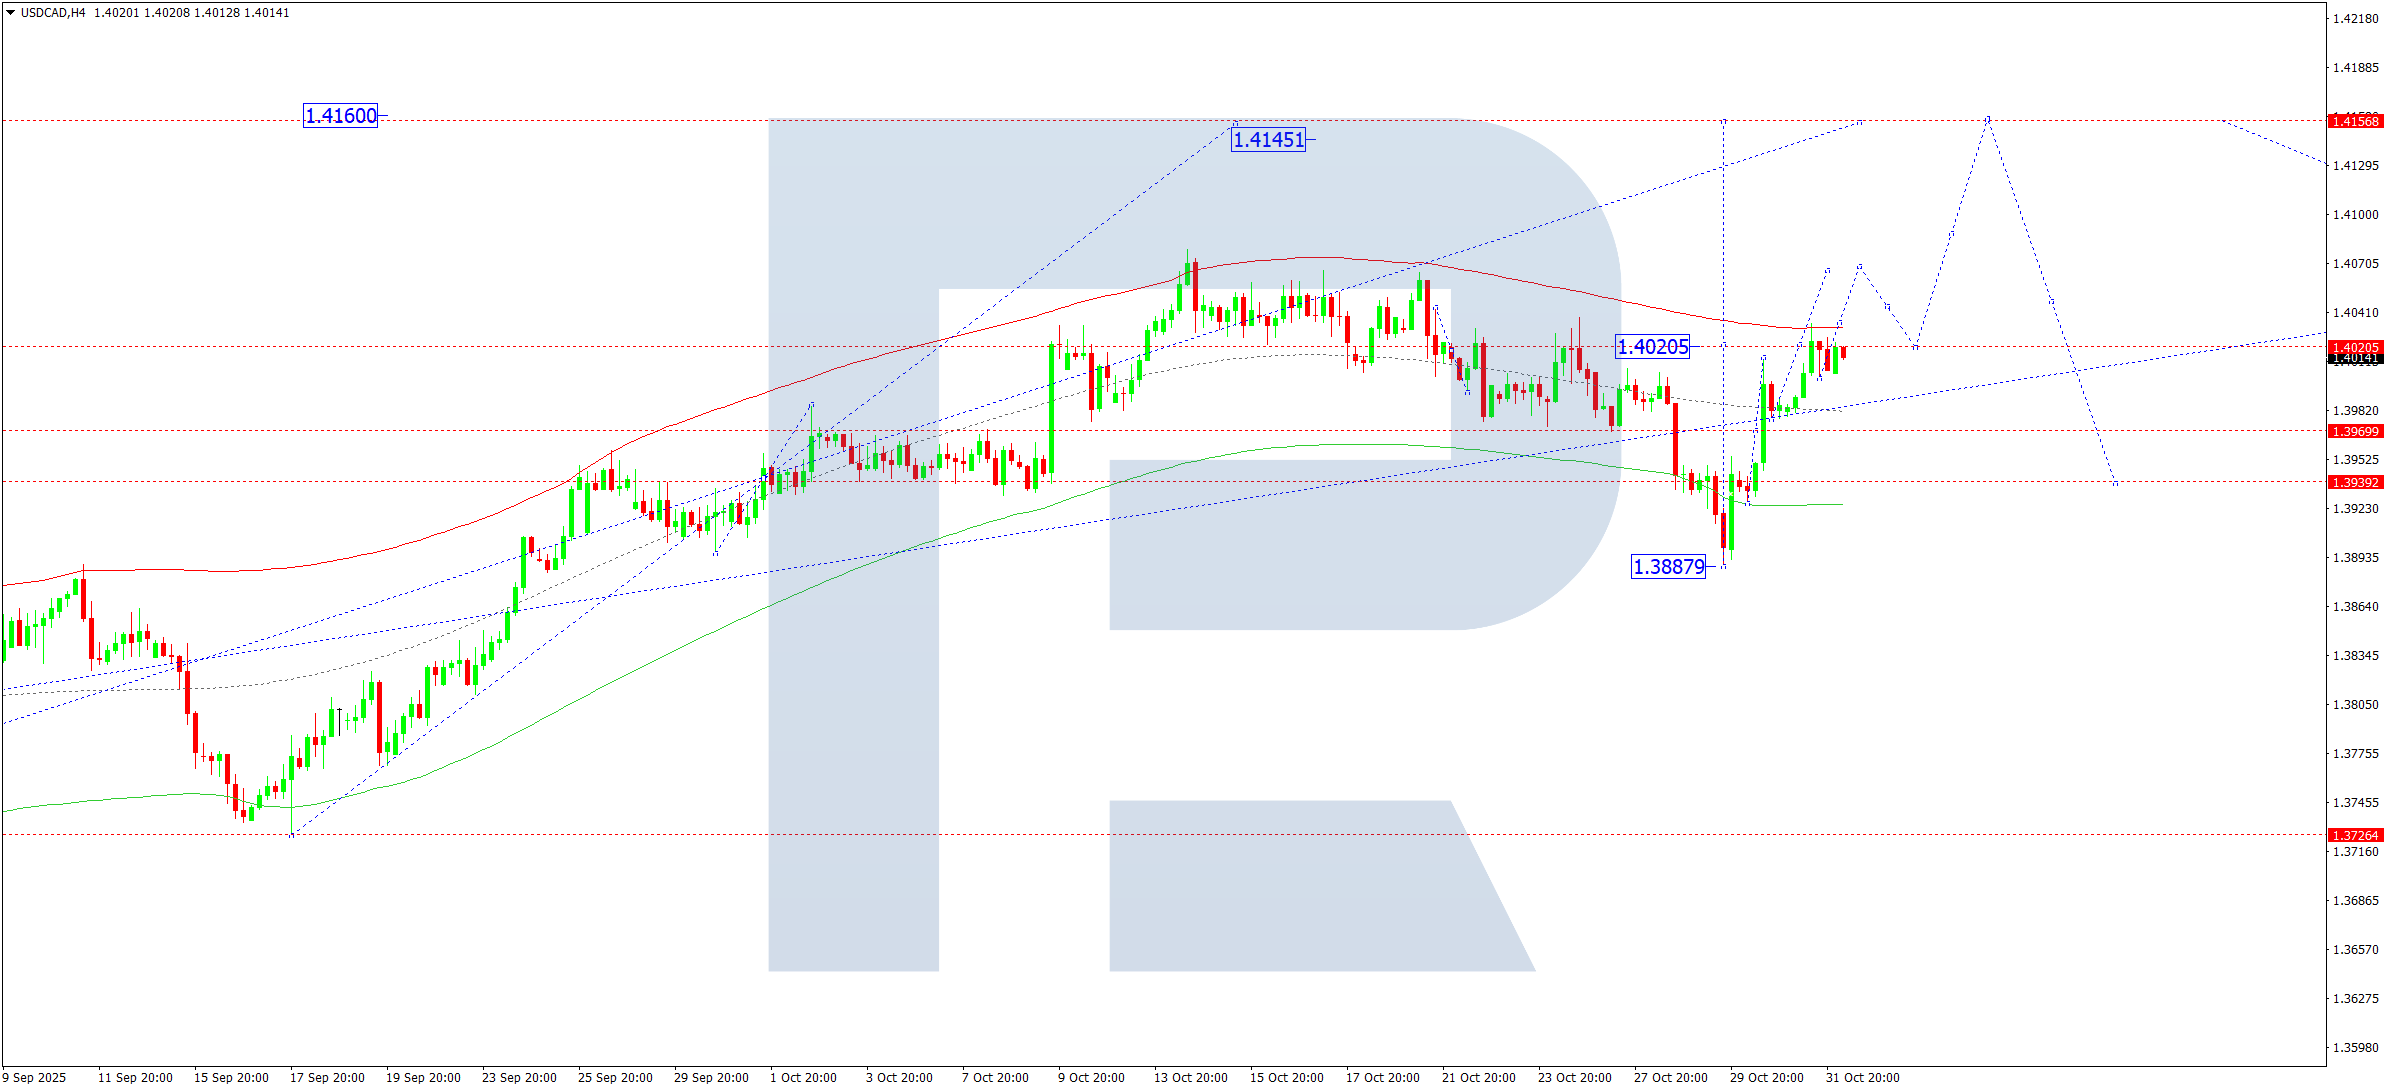
USDCAD forecast
On the H4 chart, the USDCAD pair completed an upward wave towards 1.4034. On 3 November 2025, a correction towards 1.3970 is expected. A new consolidation range around this level may form. An upside breakout from the range would open potential for another wave towards 1.4070, with prospects of continuing to 1.4160 as a local estimated target.
Technically, this scenario is confirmed by the Elliott Wave structure and the bullish wave matrix with a pivot point at 1.3970, viewed as key in this wave. The market completed a rise towards the upper boundary of the Price Envelope at 1.4034. A correction towards its central line at 1.3970 is relevant today, followed by a possible rise to the upper boundary at 1.4070.
Technical indicators for today’s USDCAD forecast suggest a correction towards 1.3970 and continued upward movement towards 1.4070.
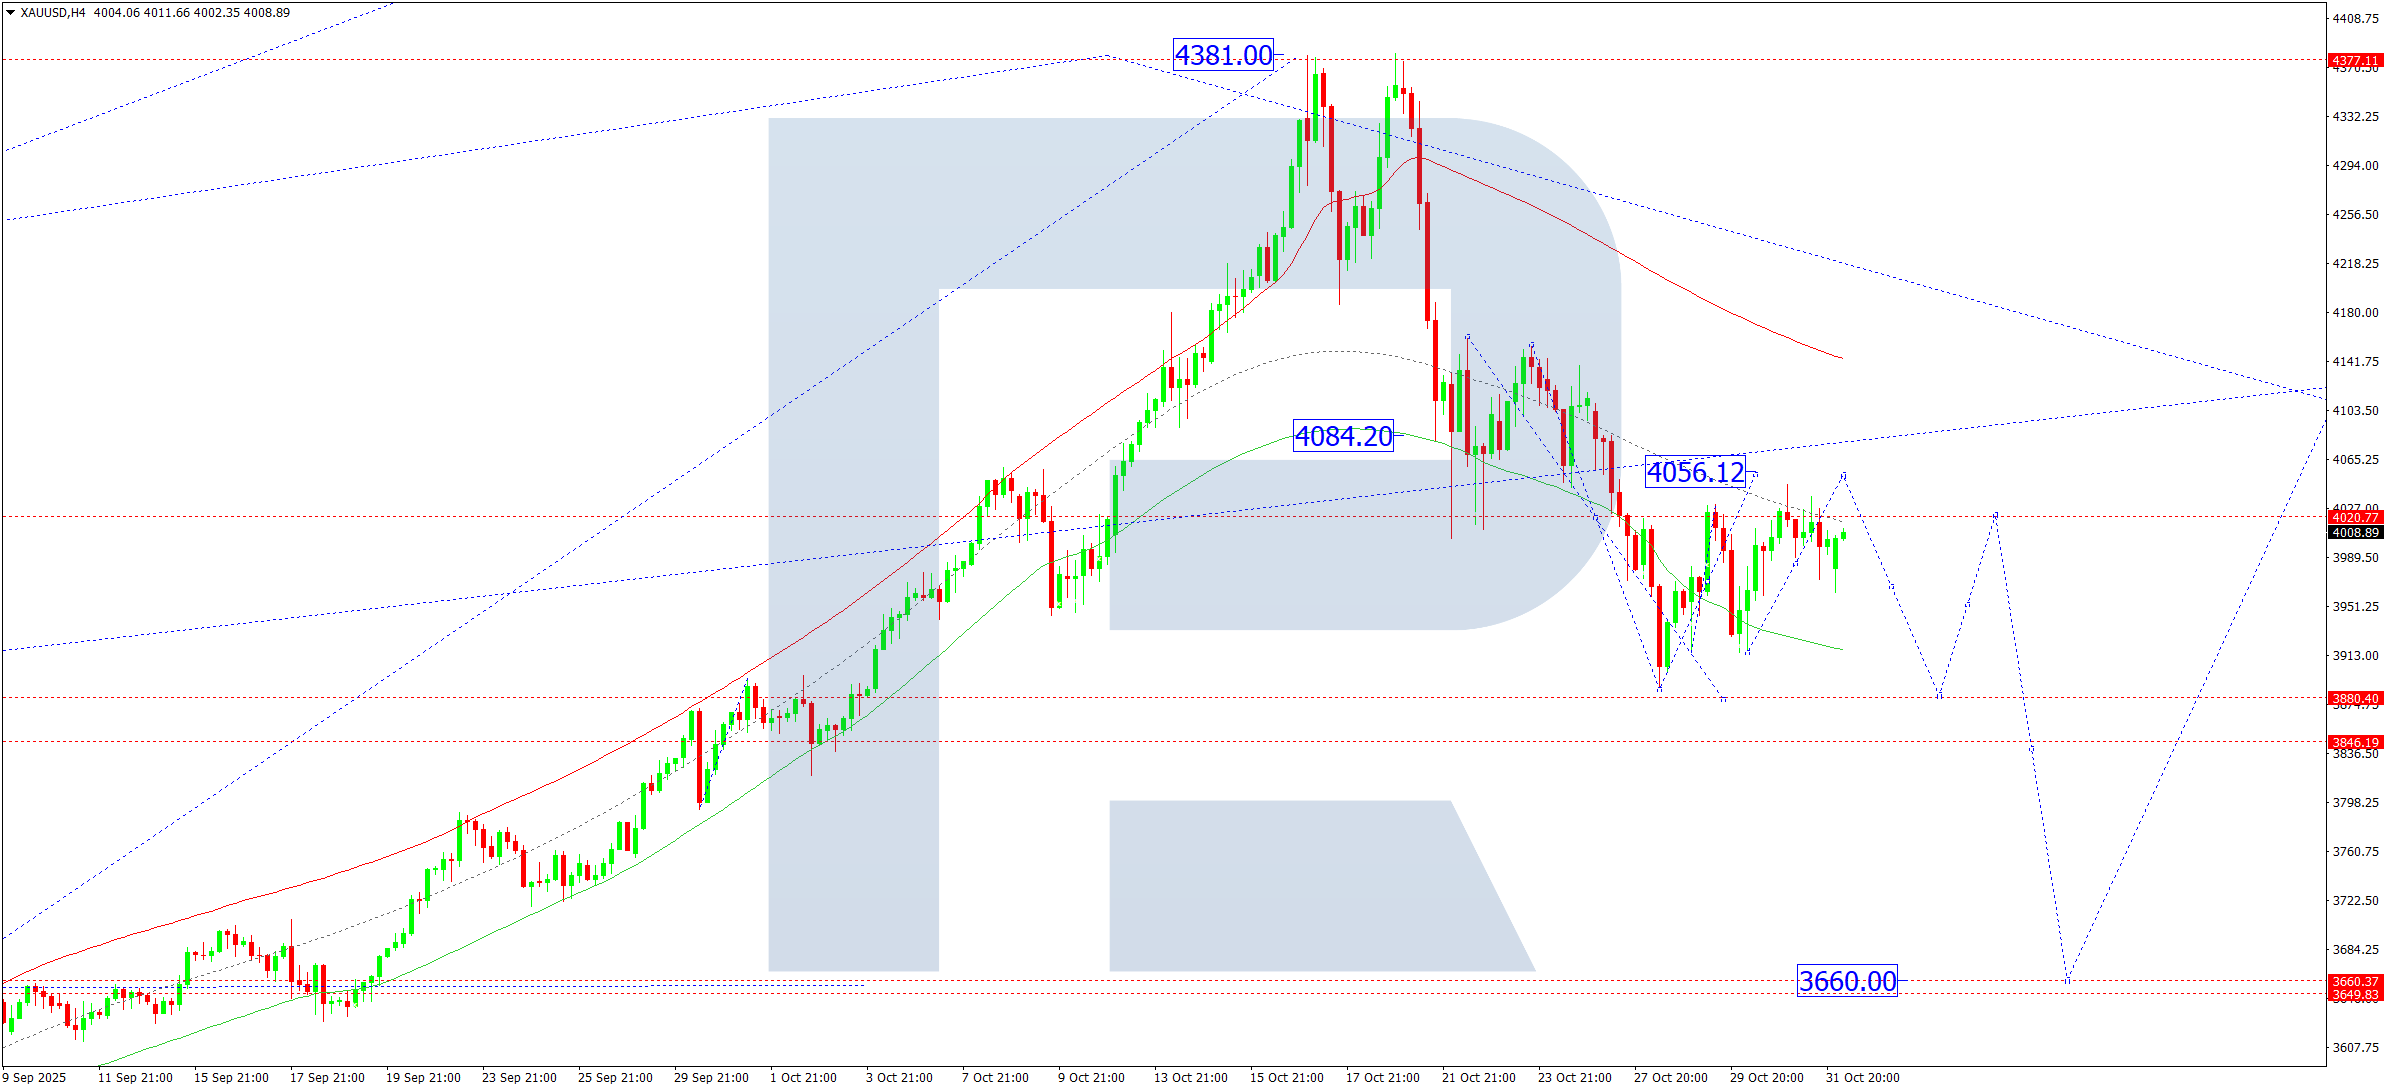
XAUUSD forecast
On the H4 chart, XAUUSD is forming a consolidation range around 3,970. On 3 November 2025, the range may expand upwards to 4,056. Subsequently, prices could decline to 3,880 before rising towards 4,020. The market will likely establish a wider consolidation range around 4,020. A downside breakout would open potential for continued correction to 3,785, with prospects of extending the wave to 3,660. An upside breakout would open the door for trend continuation towards 4,400.
Technically, this scenario is confirmed by the Elliott Wave structure and the bullish wave matrix with a pivot point at 3,660, considered key for this wave. The market is forming a corrective move towards the lower boundary of the Price Envelope at 3,880, followed by a rise towards its central line at 4,020.
Technical indicators for today’s XAUUSD forecast suggest growth towards 4,056 and the start of a decline towards 3,880.
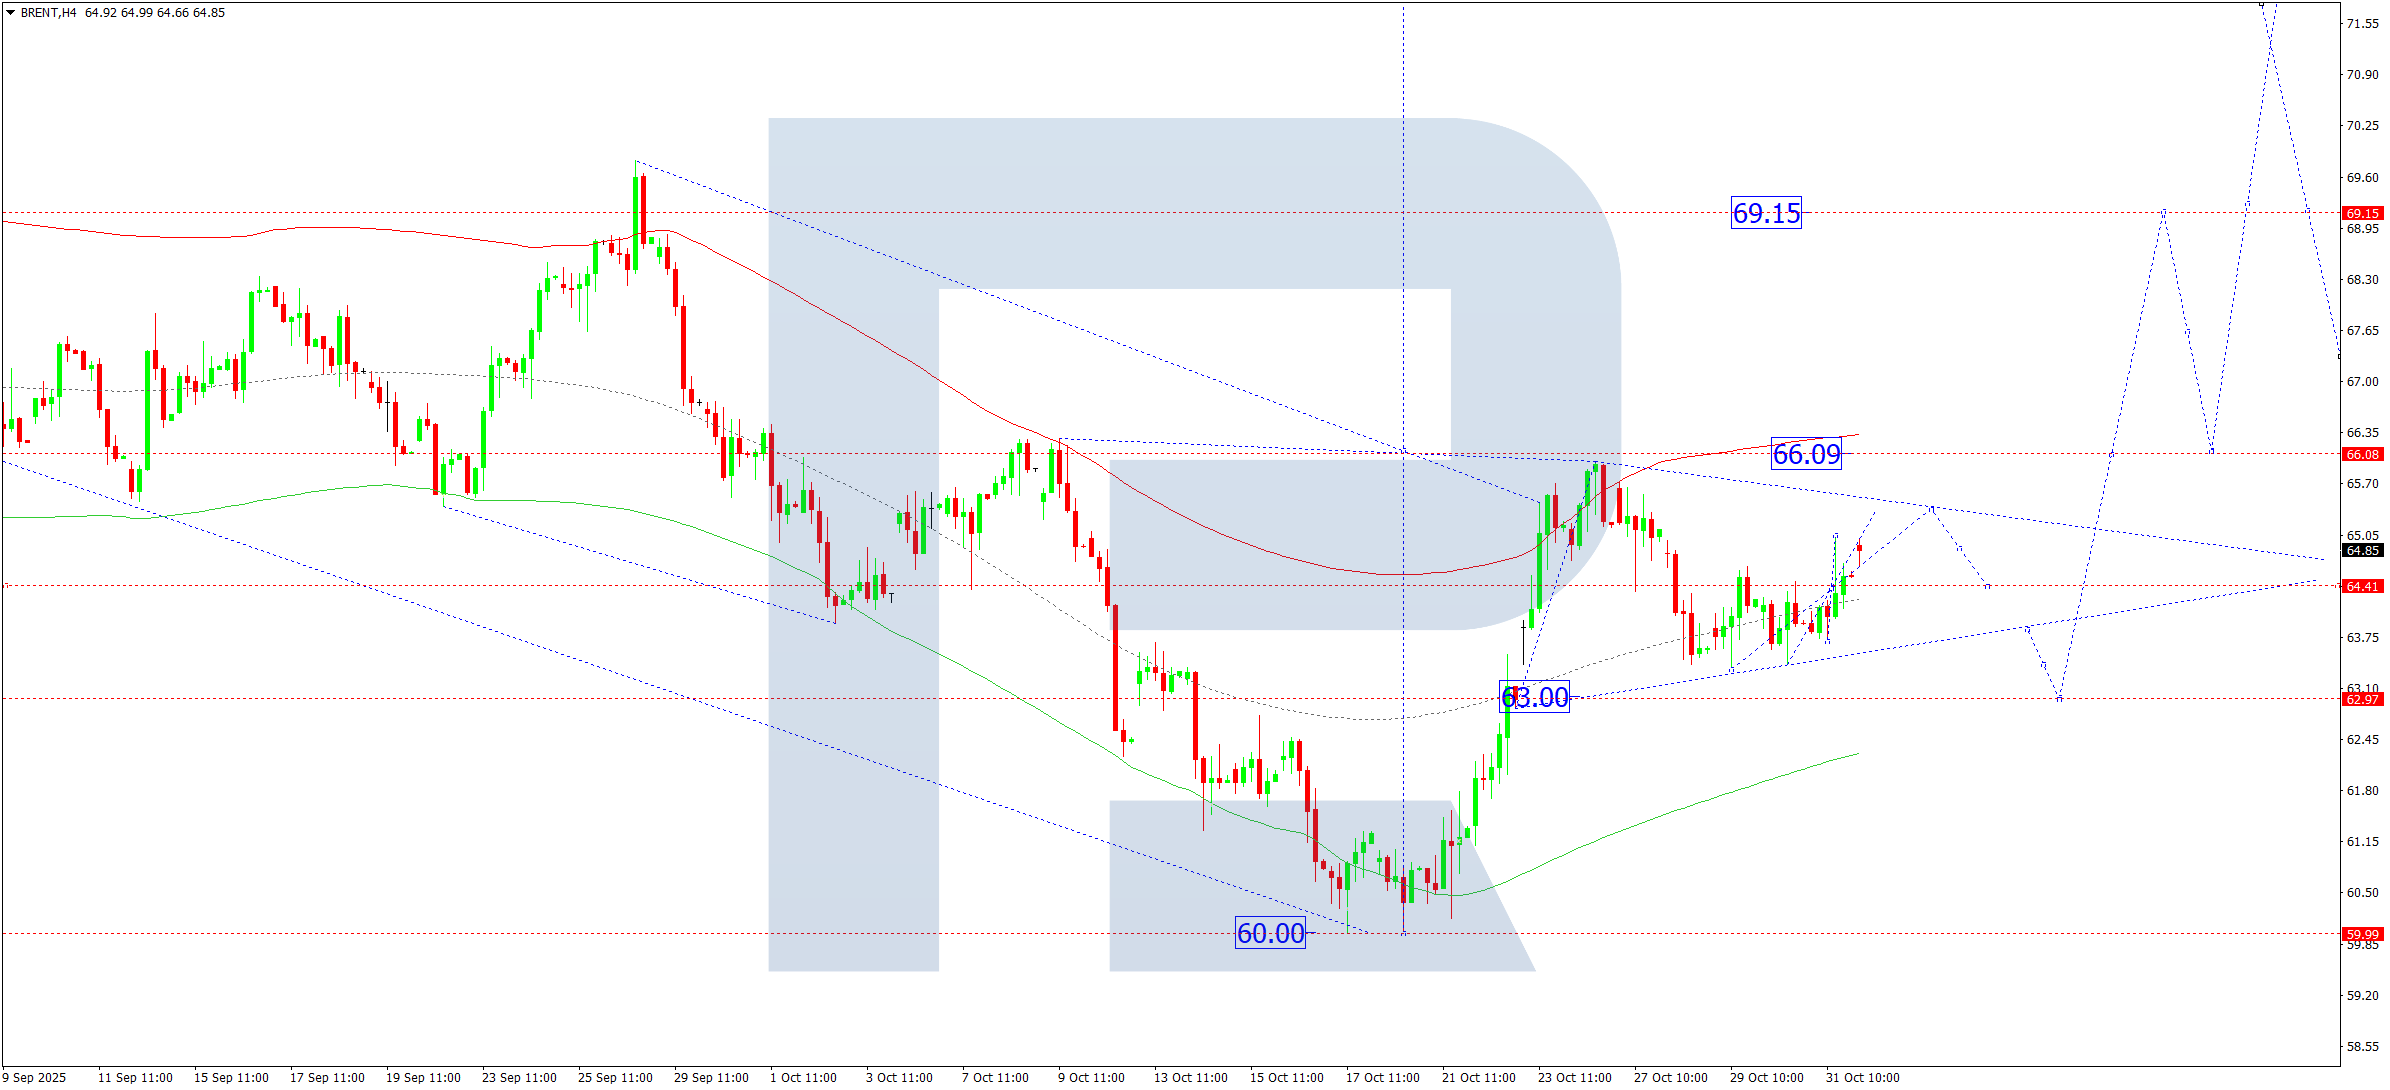
Brent forecast
On the H4 chart, Brent crude is forming a consolidation range around 64.40. On 3 November 2025, a rise towards 65.40 and a decline towards 63.00 are possible. After completing this correction near 63.00, growth towards 66.10 is expected. A breakout above this level would open the way for continued growth towards 69.15, with prospects of extending the trend to 72.30.
Technically, this scenario is supported by the Elliott Wave structure and the bullish wave matrix with a pivot point at 66.10, which is key for this wave. The market reached the upper boundary of the Price Envelope at 65.99 and continues a corrective move towards the lower boundary at 63.00. After completing the correction, an impulsive rise towards the upper boundary at 69.15 is likely.
Technical indicators for today’s Brent forecast suggest the completion of the correction near 63.00 and the start of a rise towards 69.15.
Forecasts presented in this section only reflect the author’s private opinion and should not be considered as guidance for trading. RoboForex bears no responsibility for trading results based on trading recommendations described in these analytical reviews.