Daily technical analysis and forecast for 22 October 2025
Here is a detailed daily technical analysis and forecast for EURUSD, USDJPY, GBPUSD, AUDUSD, USDCAD, XAUUSD and Brent for 22 October 2025.
EURUSD forecast
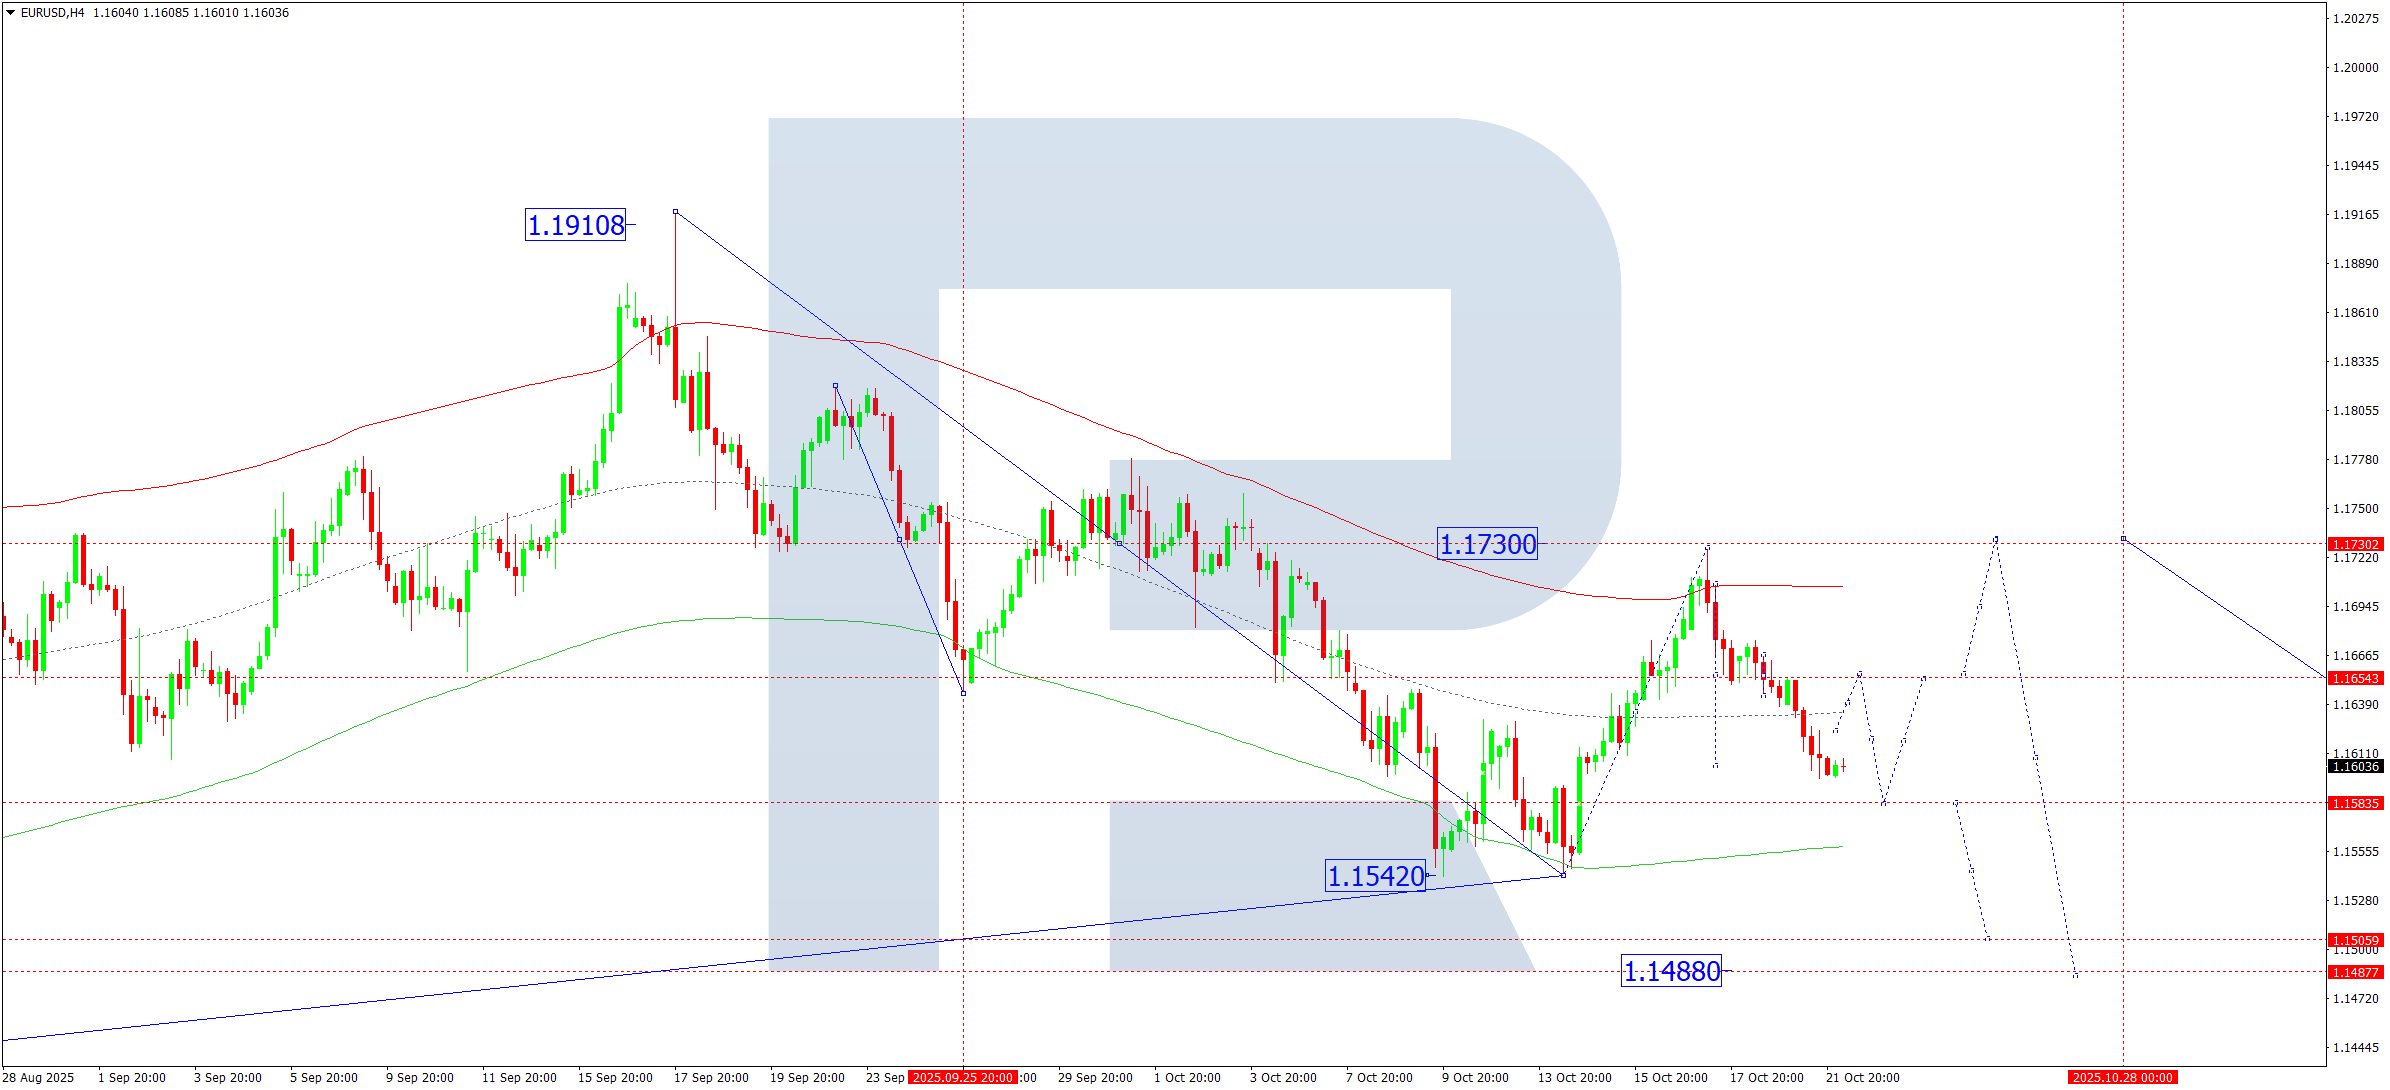
On the H4 chart of EURUSD, the market completed a downward wave to 1.1597. On 22 October 2025, a rise towards 1.1652 (testing from below) is expected. Afterwards, another downward structure to 1.1577 may develop. The market will effectively outline the boundaries of a wider consolidation range. An upward breakout could extend the corrective wave towards 1.1730, while a downward breakout would open potential for a continued move towards 1.1488, with prospects of further decline to 1.1240.
Technically, this scenario is confirmed by the Elliott Wave structure and the bearish wave matrix with a pivot point at 1.1730, which is viewed as key in the EURUSD wave structure. A decline towards the lower boundary of the Price Envelope at 1.1577 is expected, followed by a rise to its central line at 1.1652.
Technical indicators for today’s EURUSD forecast suggest a decline towards 1.1577.
USDJPY forecast
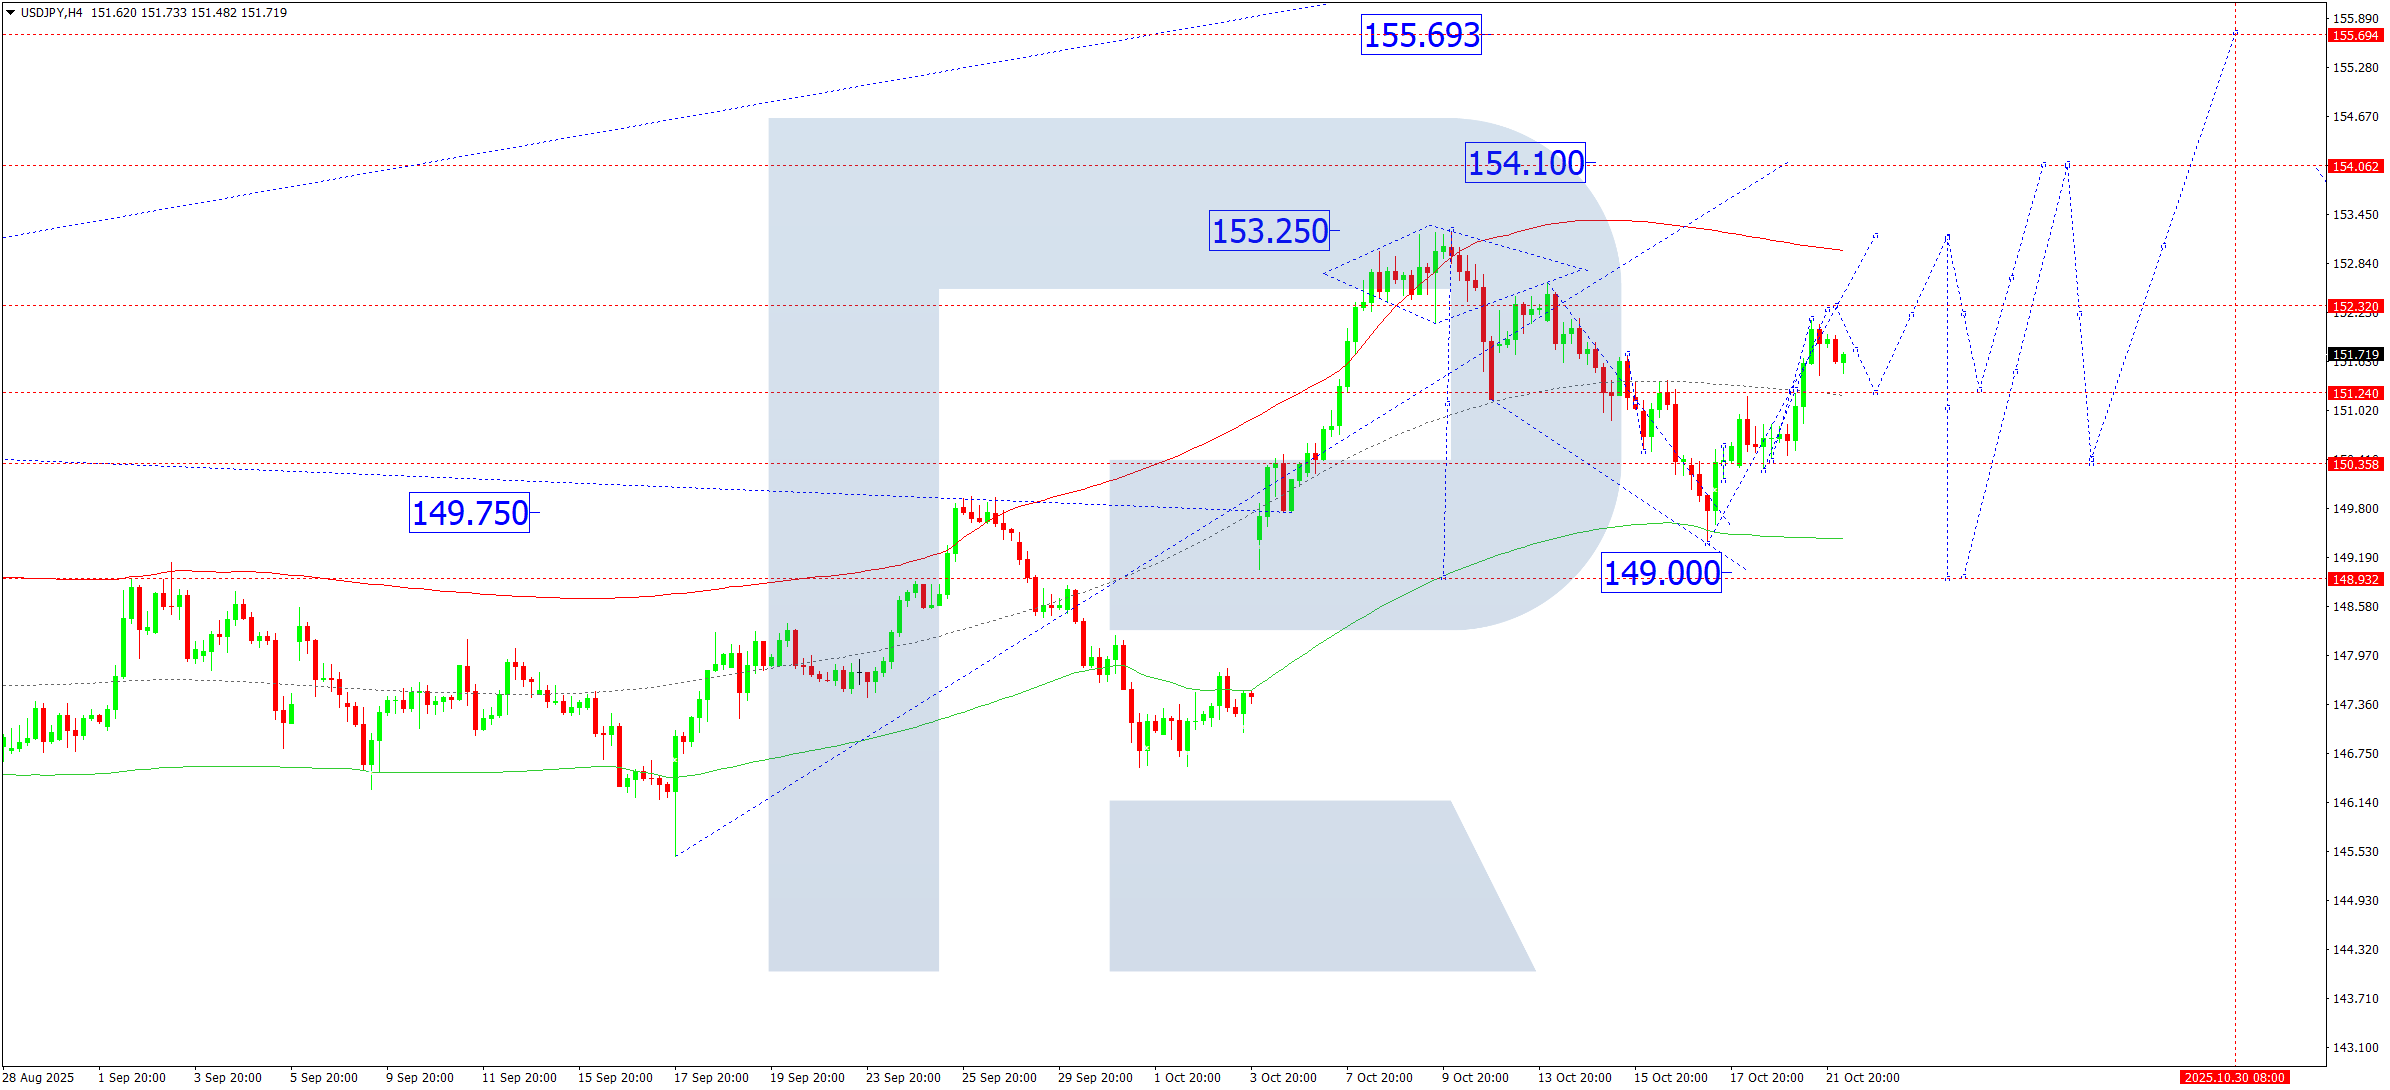
On the H4 chart of USDJPY, the market advanced to 151.33. On 22 October 2025, a consolidation range is forming around this level. A rise towards 152.32 is expected, followed by a pullback to 151.37 (testing from above). Afterwards, another upward move towards 153.20 is not excluded.
Technically, this scenario is supported by the Elliott Wave structure and the bullish wave matrix with a pivot point at 149.75, the key level in this wave. The market has formed a consolidation range around the central line of the Price Envelope at 151.37. An expansion towards 152.32 is expected, with potential continuation of the wave to the upper boundary at 153.20.
Technical indicators for today’s USDJPY forecast suggest potential growth towards 153.20.
GBPUSD forecast
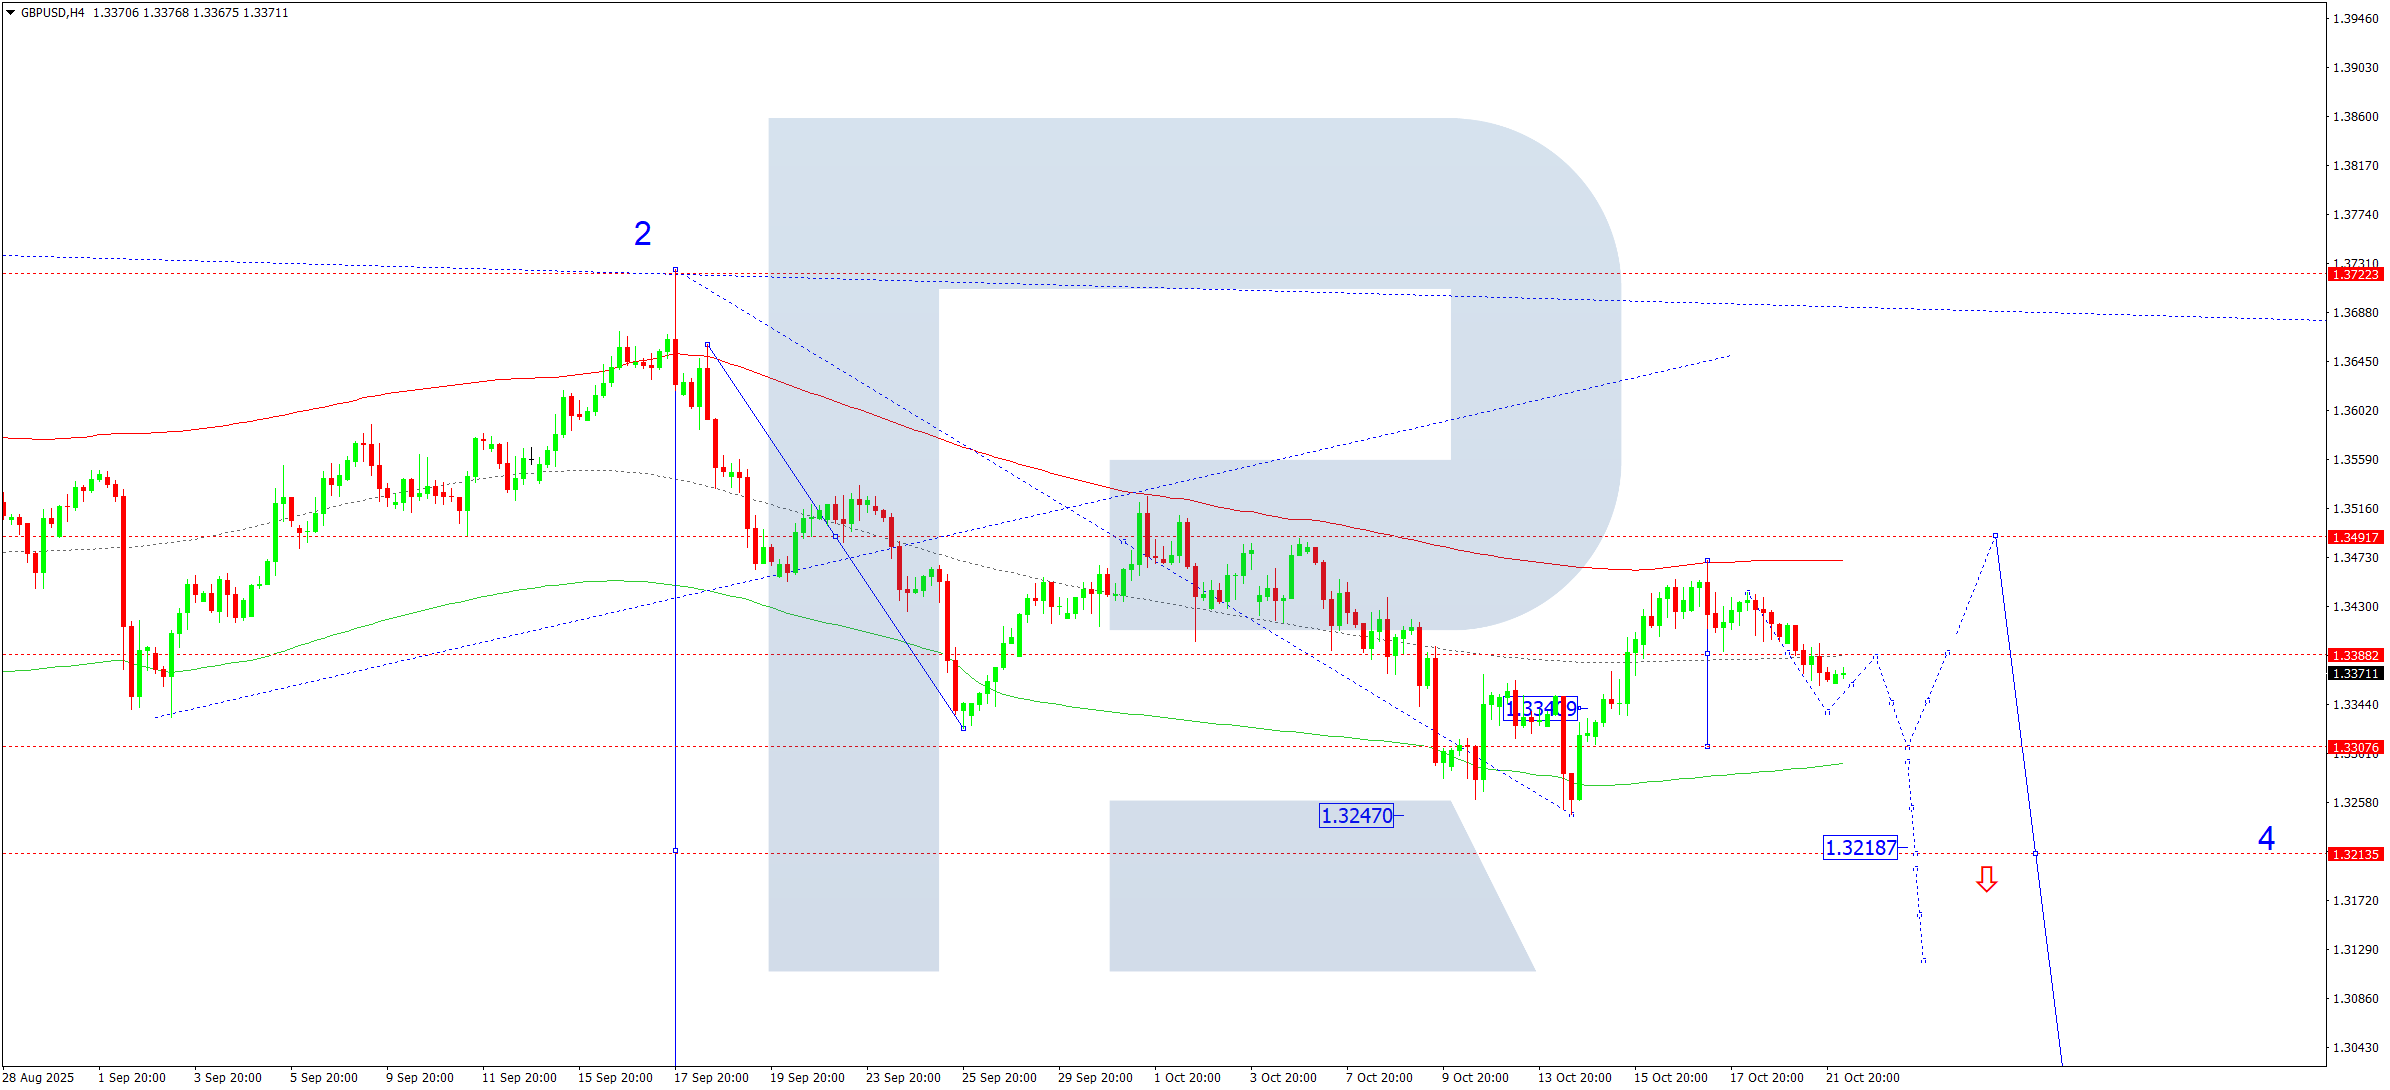
On the H4 chart of GBPUSD, the market formed a consolidation range around 1.3400 and broke it to the downside. On 22 October 2025, the pair has potential for a decline towards 1.3336 at a minimum. Later, another corrective structure towards 1.3388 is possible before a downward move continues to 1.3300.
Technically, this scenario is supported by the Elliott Wave structure and the bearish wave matrix with a pivot point at 1.3490, viewed as key in this wave. The market continues a downward wave towards the lower boundary of the Price Envelope. The correction could complete near 1.3300, after which a rise towards the upper boundary at 1.3490 is possible, followed by a new downward wave towards 1.3218.
Technical indicators for today’s GBPUSD forecast suggest a decline towards 1.3300.
AUDUSD forecast
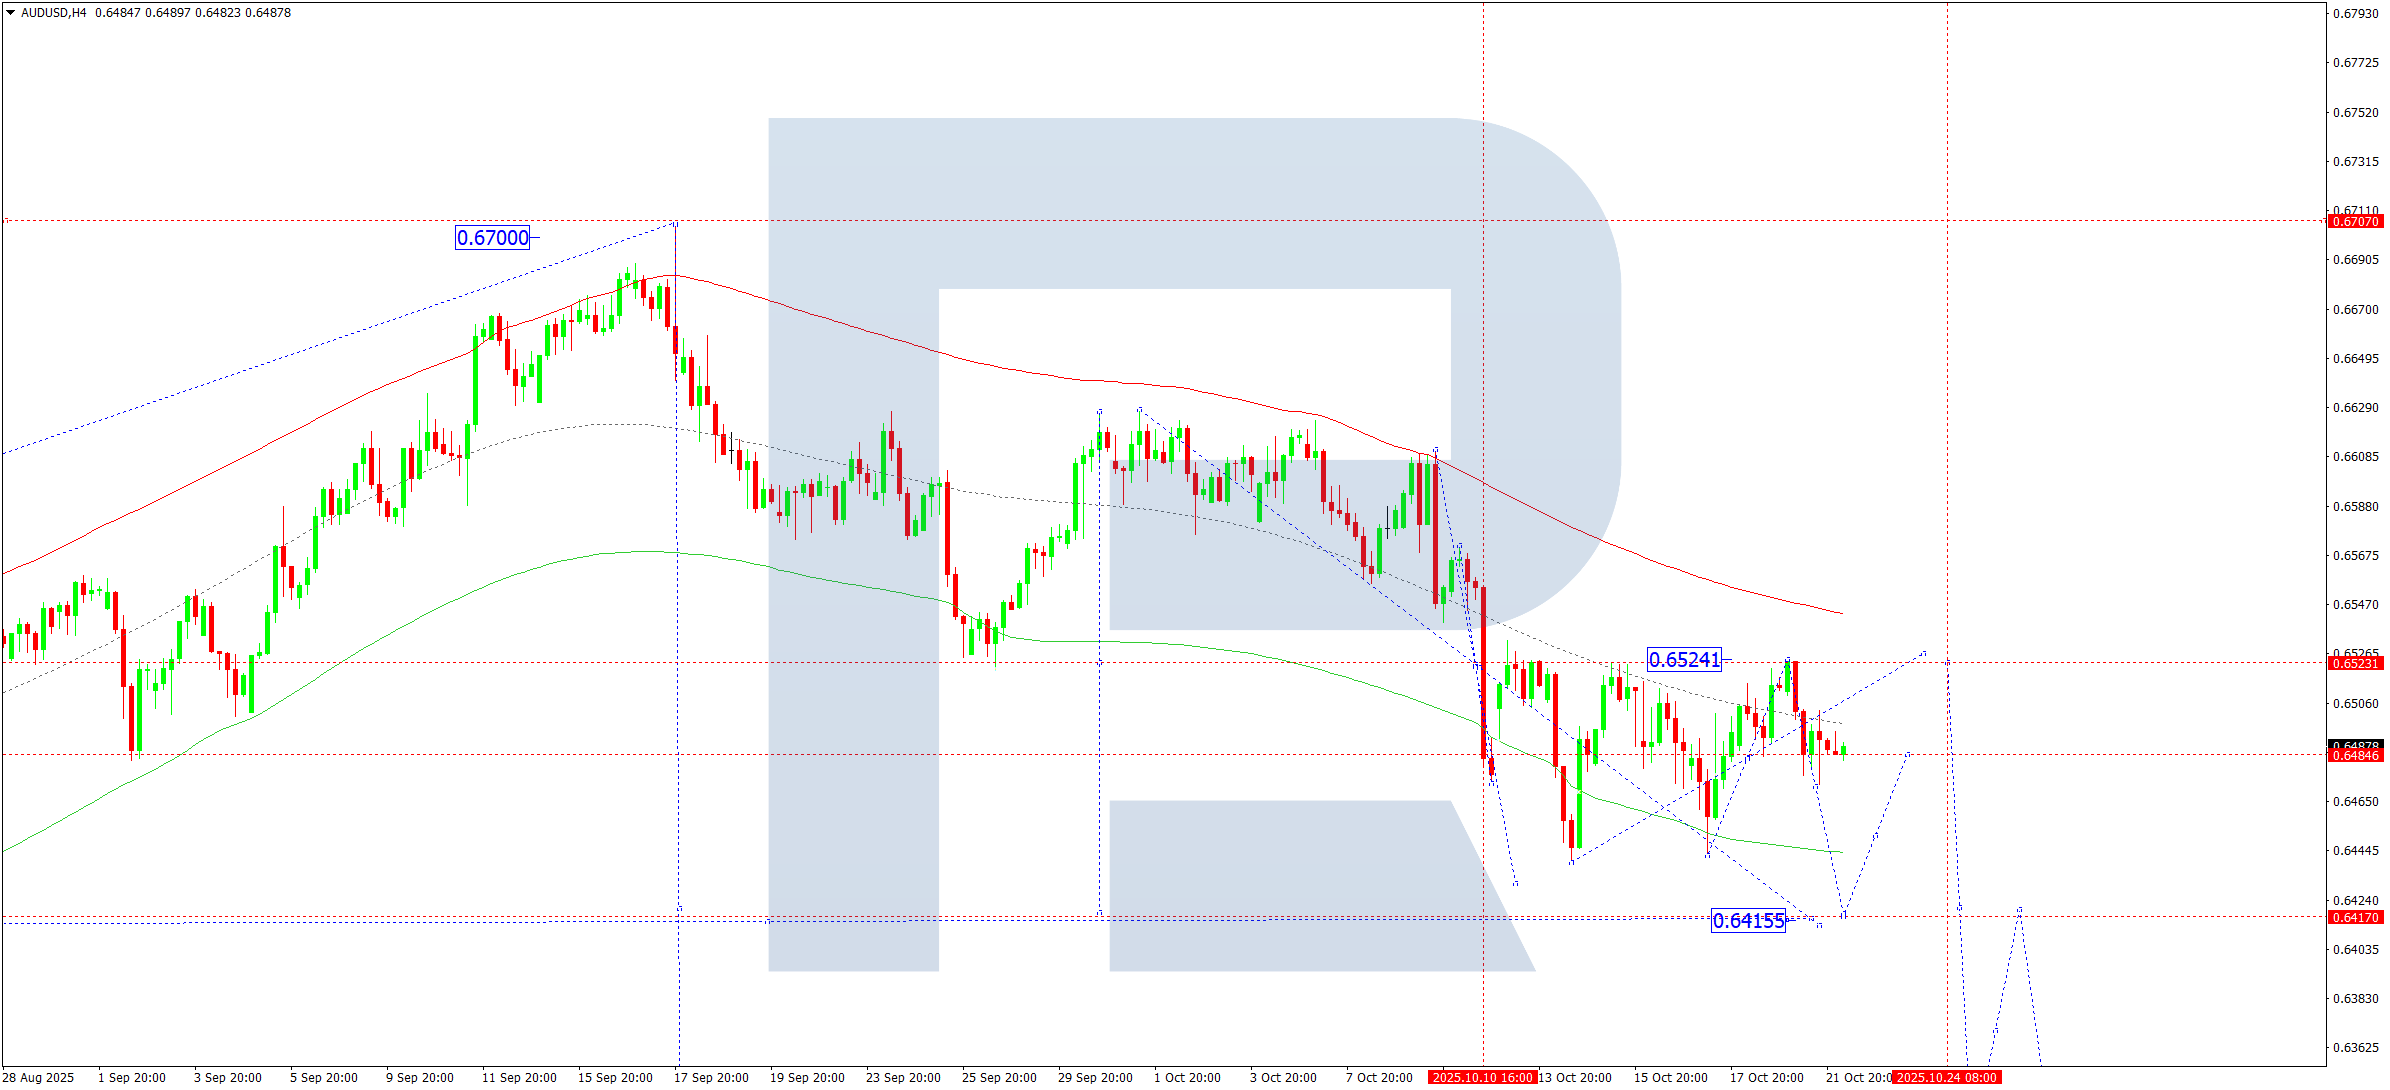
On the H4 chart of AUDUSD, the market continues to develop a compact consolidation range around 0.6484. On 22 October 2025, if the price breaks upwards, the range could expand towards 0.6525. If price breaks downwards, expansion towards 0.6415 is expected.
Technically, this scenario is confirmed by the Elliott Wave structure and the bearish wave matrix with a pivot point at 0.6525, which is key for this wave. The market completed a downward wave to the lower boundary of the Price Envelope at 0.6440 and a corrective leg to the central line at 0.6524. A rise towards the upper boundary at 0.6530 may follow, then a decline to the lower boundary at 0.6415.
Technical indicators for today’s AUDUSD forecast suggest a potential rise towards 0.6530, followed by a decline to 0.6415.
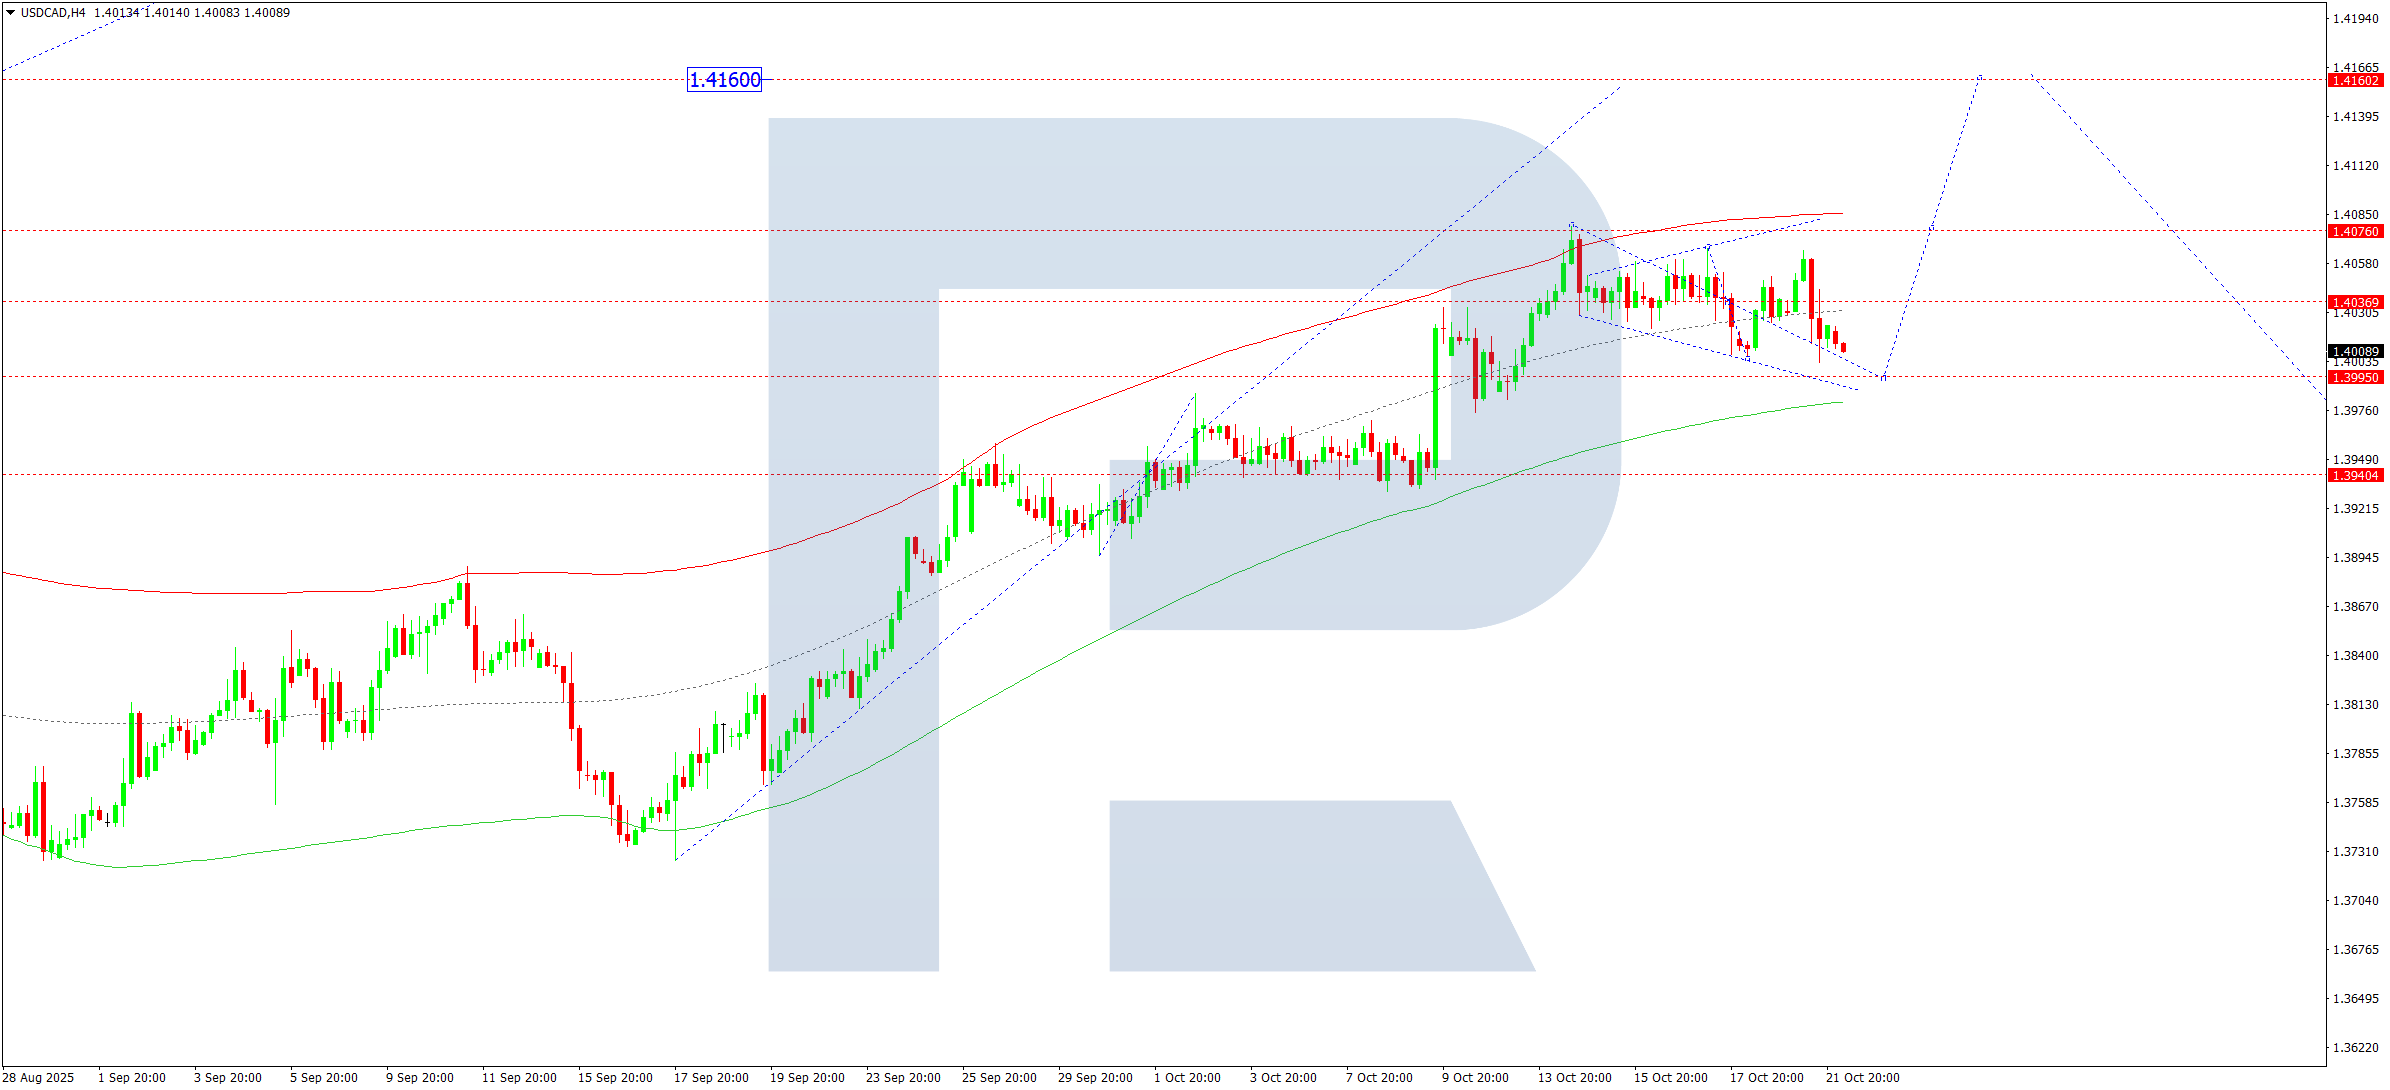
USDCAD forecast
On the H4 chart of USDCAD, the market continues to consolidate around 1.4035. On 22 October 2025, expansion of the range downwards to 1.3995 is possible, followed by a rise towards 1.4076. A breakout above this level would open potential for continuation towards 1.4160 as a local target.
Technically, this scenario is confirmed by the Elliott Wave structure and the bullish wave matrix with a pivot point at 1.3940, which is key for this wave. The structure continues to form a growth structure towards the upper boundary of the Price Envelope at 1.4160. Today, a possible upward move from 1.4076 may begin, and its breakout would open the way for further growth to 1.4160. Later, a correction to the central line at 1.3940 (testing from above) is possible.
Technical indicators for today’s USDCAD forecast suggest a continued upward wave towards 1.4070 and 1.4160.
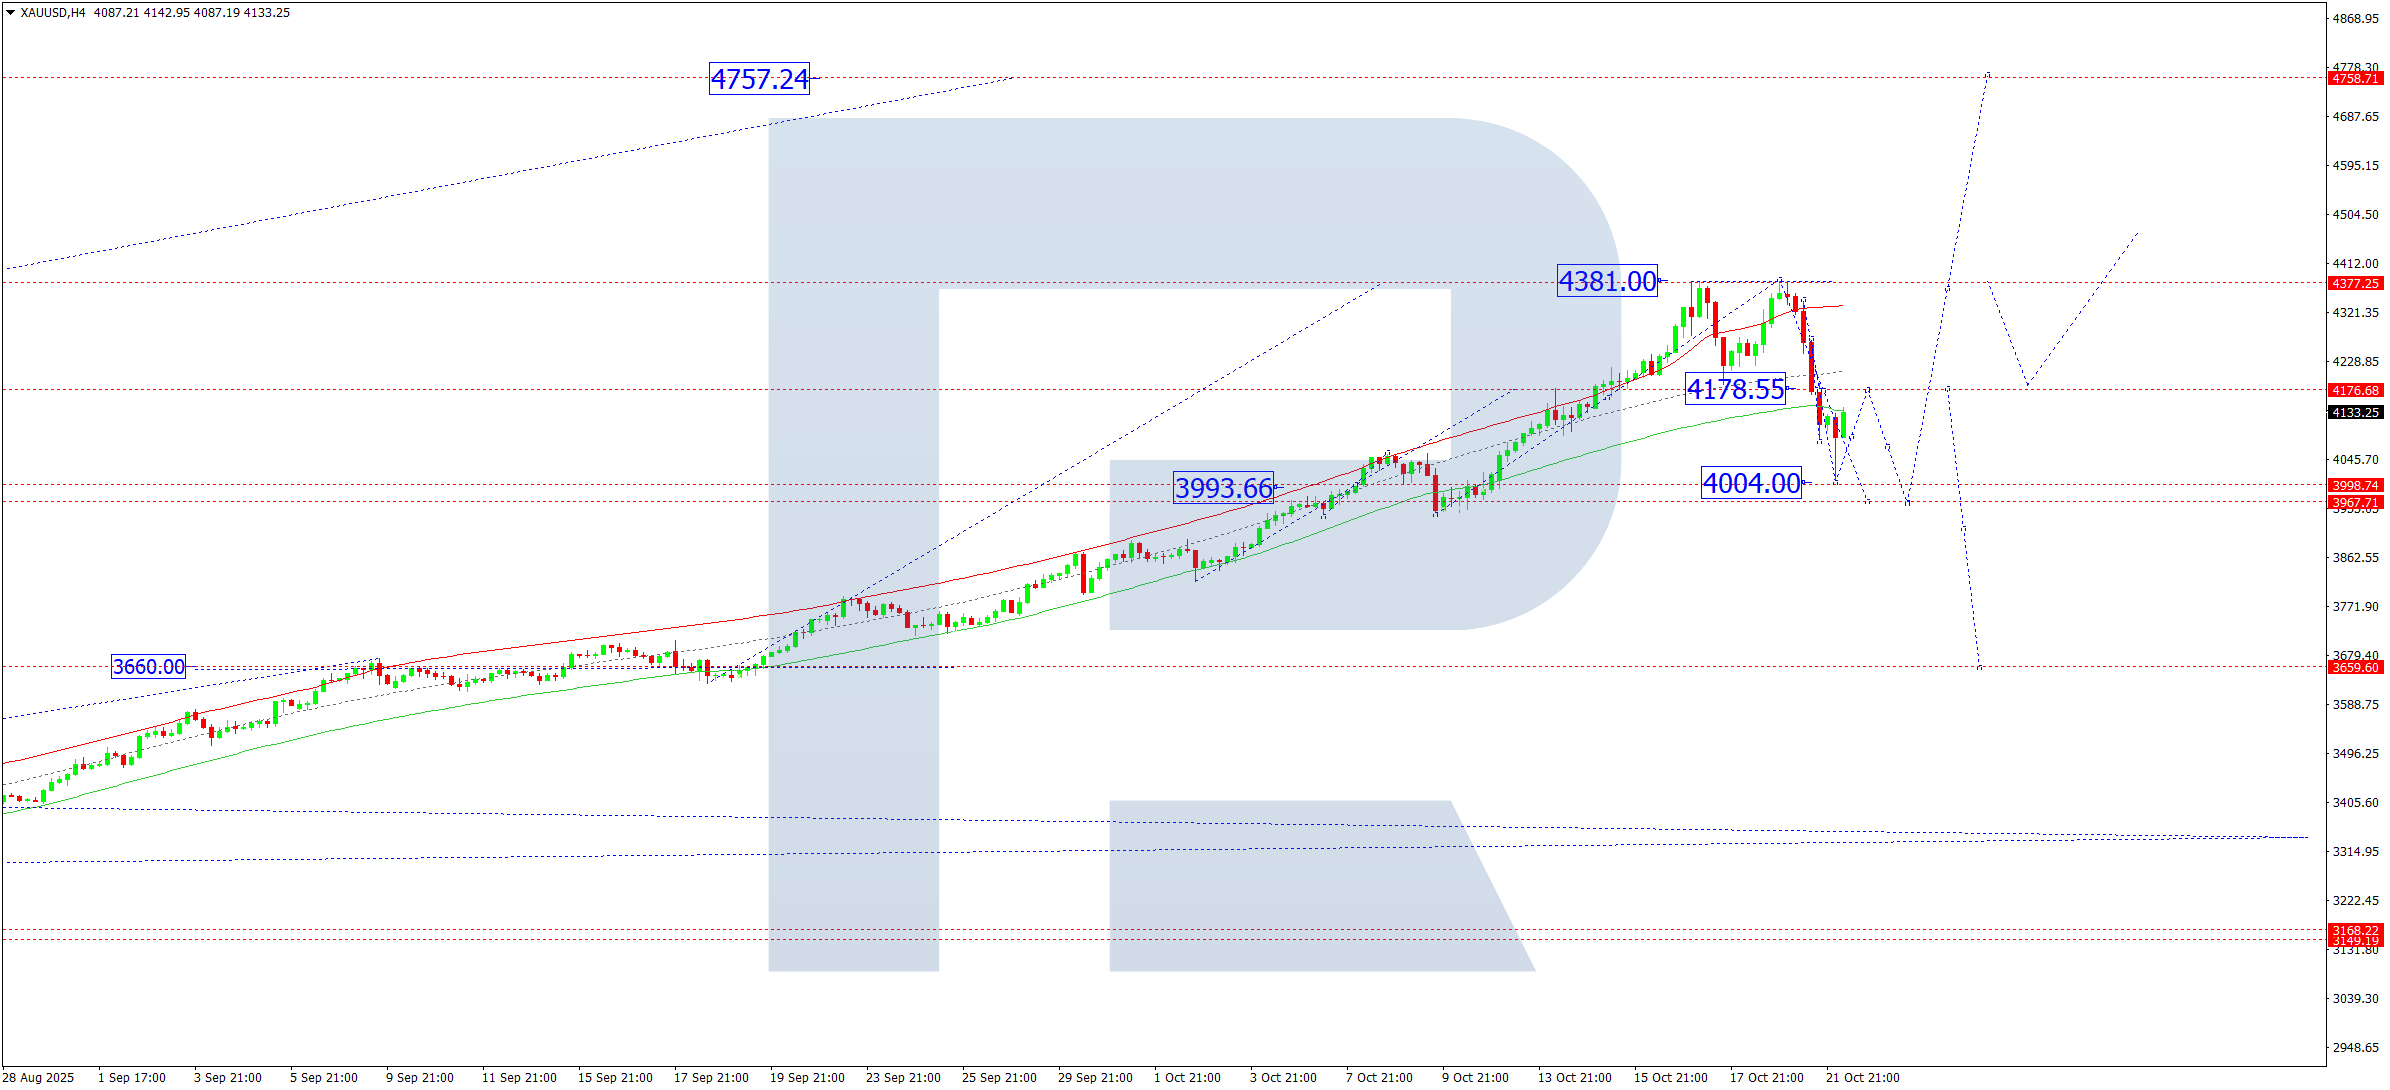
XAUUSD forecast
On the H4 chart of XAUUSD, the market broke below 4,178, reaching the local target of the downside wave. On 22 October 2025, a rise towards 4,178 (testing from below) is expected, followed by another downward structure towards 3,967.
Technically, this scenario is supported by the Elliott Wave structure and the bullish wave matrix with a pivot point at 3,660, the key level for this wave. The market is developing a corrective structure towards the lower boundary of the Price Envelope at 3,967, followed by a rise towards the upper boundary at 4,380.
Technical indicators for today’s XAUUSD forecast suggest a further correction towards 3,967.
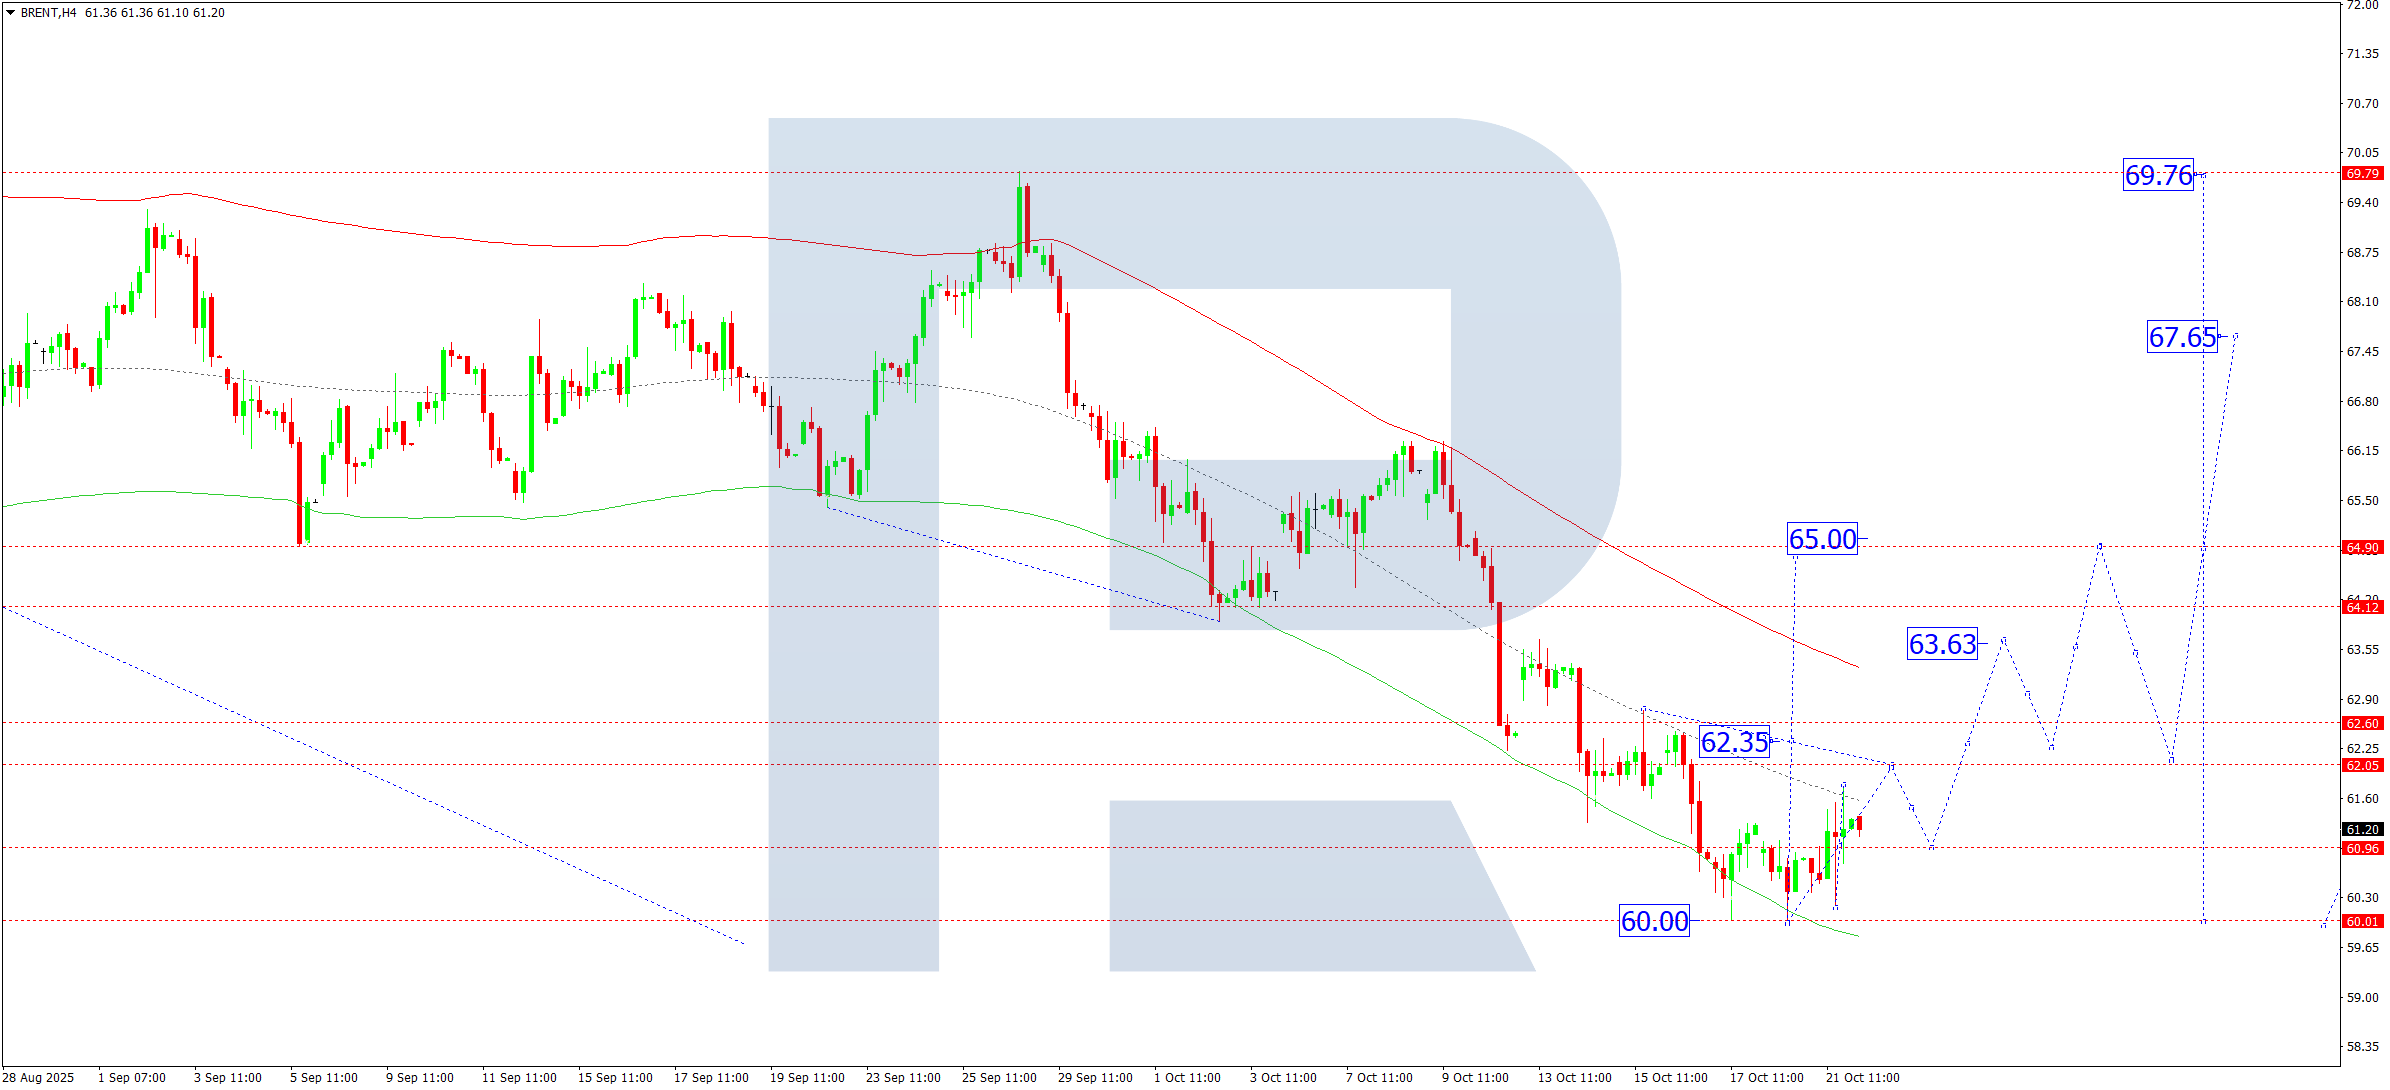
Brent forecast
On the H4 chart of Brent crude, the market is forming an upward structure towards 62.15. On 22 October 2025, prices are expected to reach this target. Afterwards, a corrective move to 61.00 is possible. Later, growth towards 63.63 may follow, with potential continuation of the trend to 65.00.
Technically, this scenario is supported by the Elliott Wave structure and the bearish wave matrix with a pivot point at 65.65, the key level for Brent in this wave. The market completed a move to the lower boundary of the Price Envelope at 60.00. Next, a rise towards the upper boundary at 65.00 is expected.
Technical indicators for today’s Brent forecast suggest potential growth towards 63.00 and 65.00.
Forecasts presented in this section only reflect the author’s private opinion and should not be considered as guidance for trading. RoboForex bears no responsibility for trading results based on trading recommendations described in these analytical reviews.