Daily technical analysis and forecast for 21 October 2025
Here is a detailed daily technical analysis and forecast for EURUSD, USDJPY, GBPUSD, AUDUSD, USDCAD, XAUUSD and Brent for 21 October 2025.
EURUSD forecast
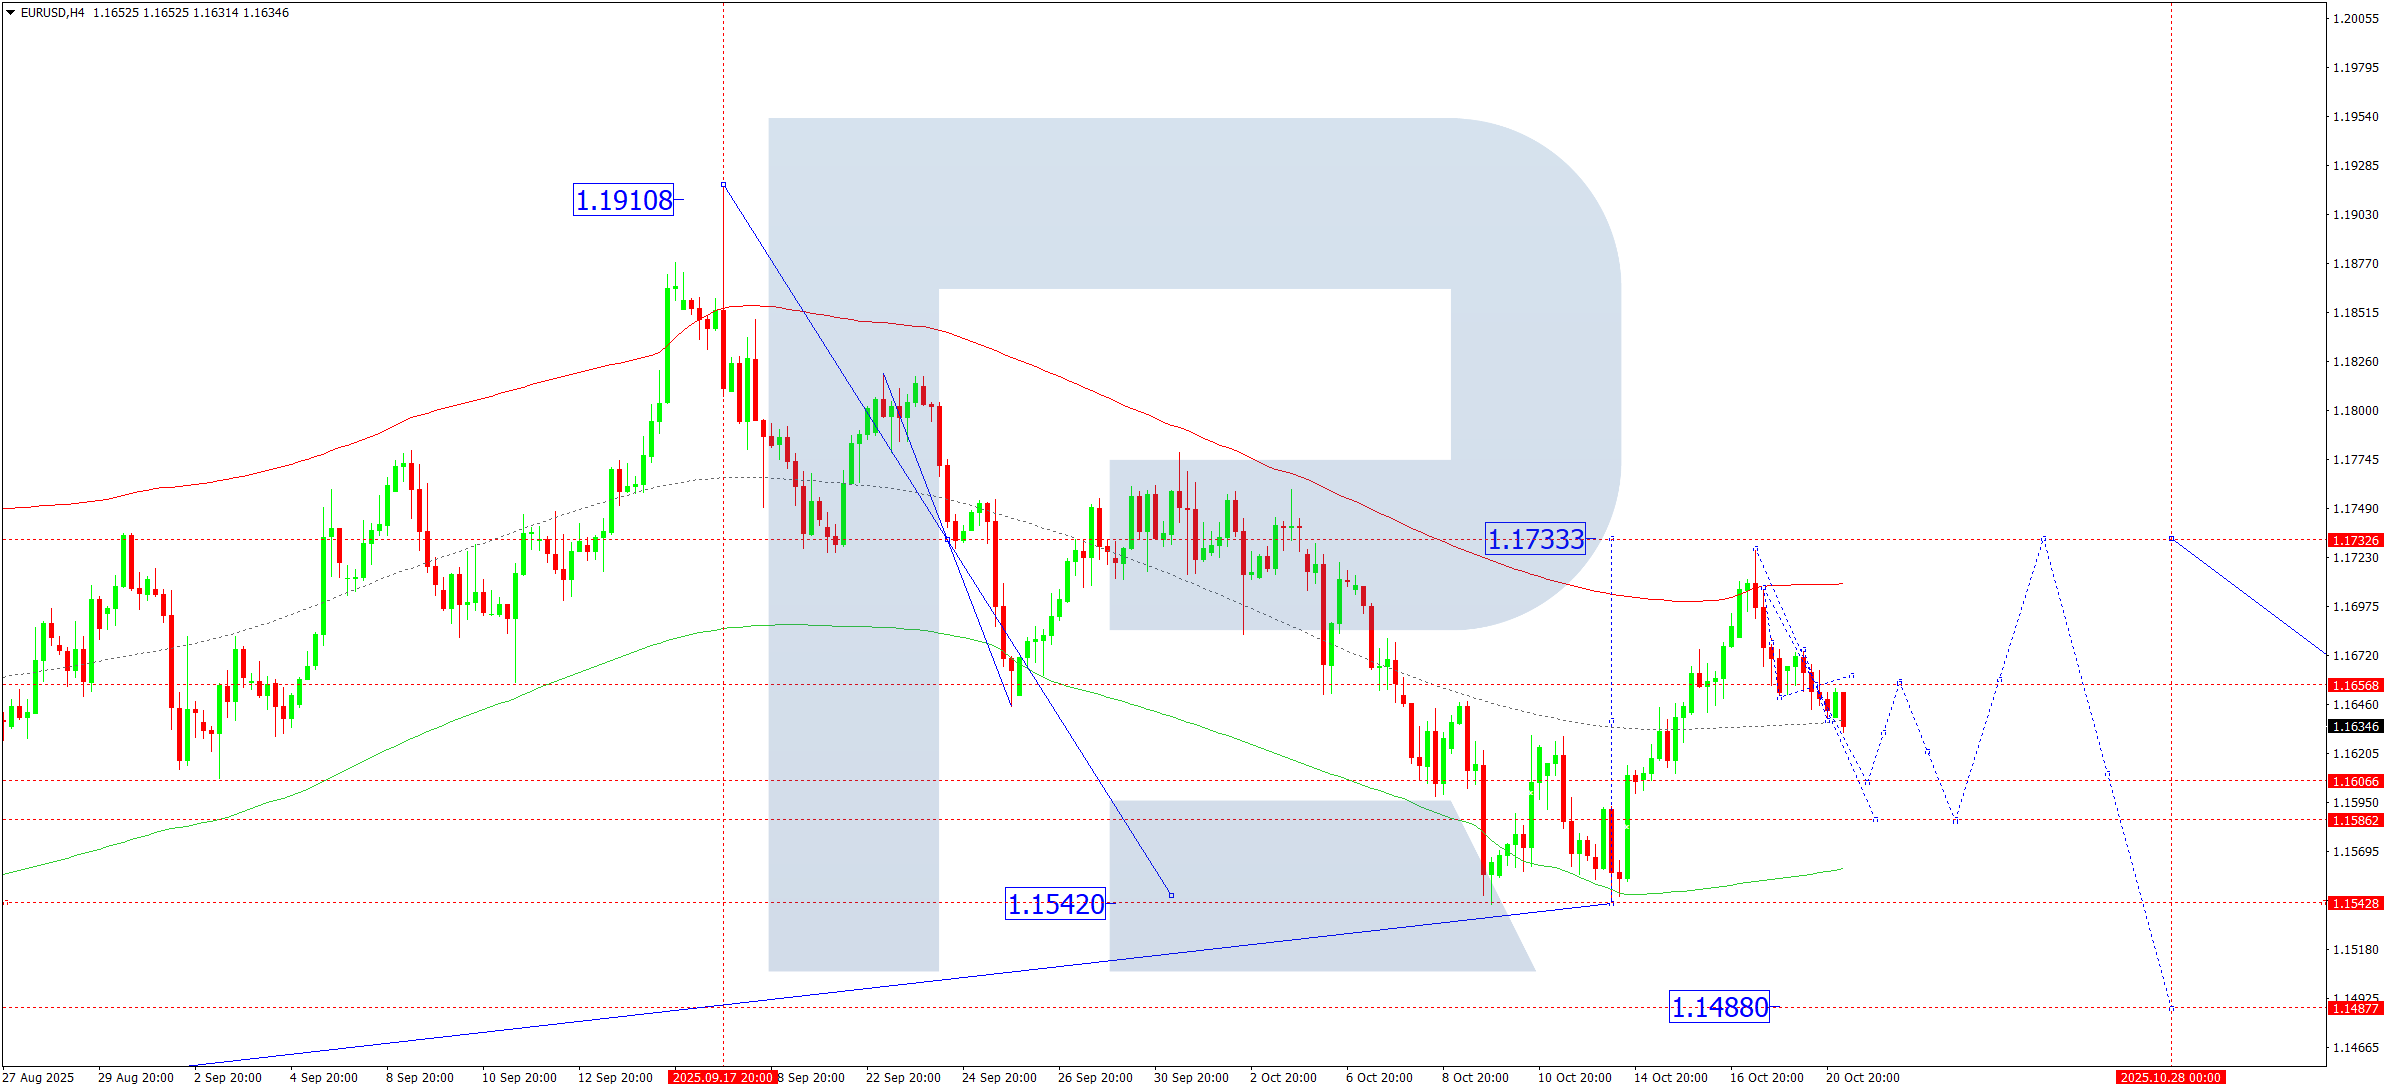
On the H4 chart of EURUSD, the market formed a compact consolidation range around 1.1656 and then broke below it. On 21 October 2025, a decline towards 1.1606 is expected, followed by a rise to 1.1656 (testing from below). After that, another downward structure towards 1.1586 is possible. Effectively, the market will outline the boundaries of a wider consolidation range. If the price breaks upwards, the corrective wave may extend towards 1.1733. A downward breakout would open the door for a continued move towards 1.1488 with prospects of extending the trend to 1.1240.
Technically, this scenario is confirmed by the referenced Elliott Wave structure and the bearish wave matrix with a pivot point at 1.1733, viewed as key in EURUSD’s wave structure. Today, a move towards the lower boundary of the Price Envelope at 1.1586 is anticipated, followed by a rise towards its central line at 1.1656.
Technical indicators for today’s EURUSD forecast suggest a decline to 1.1606 and 1.1586.
USDJPY forecast
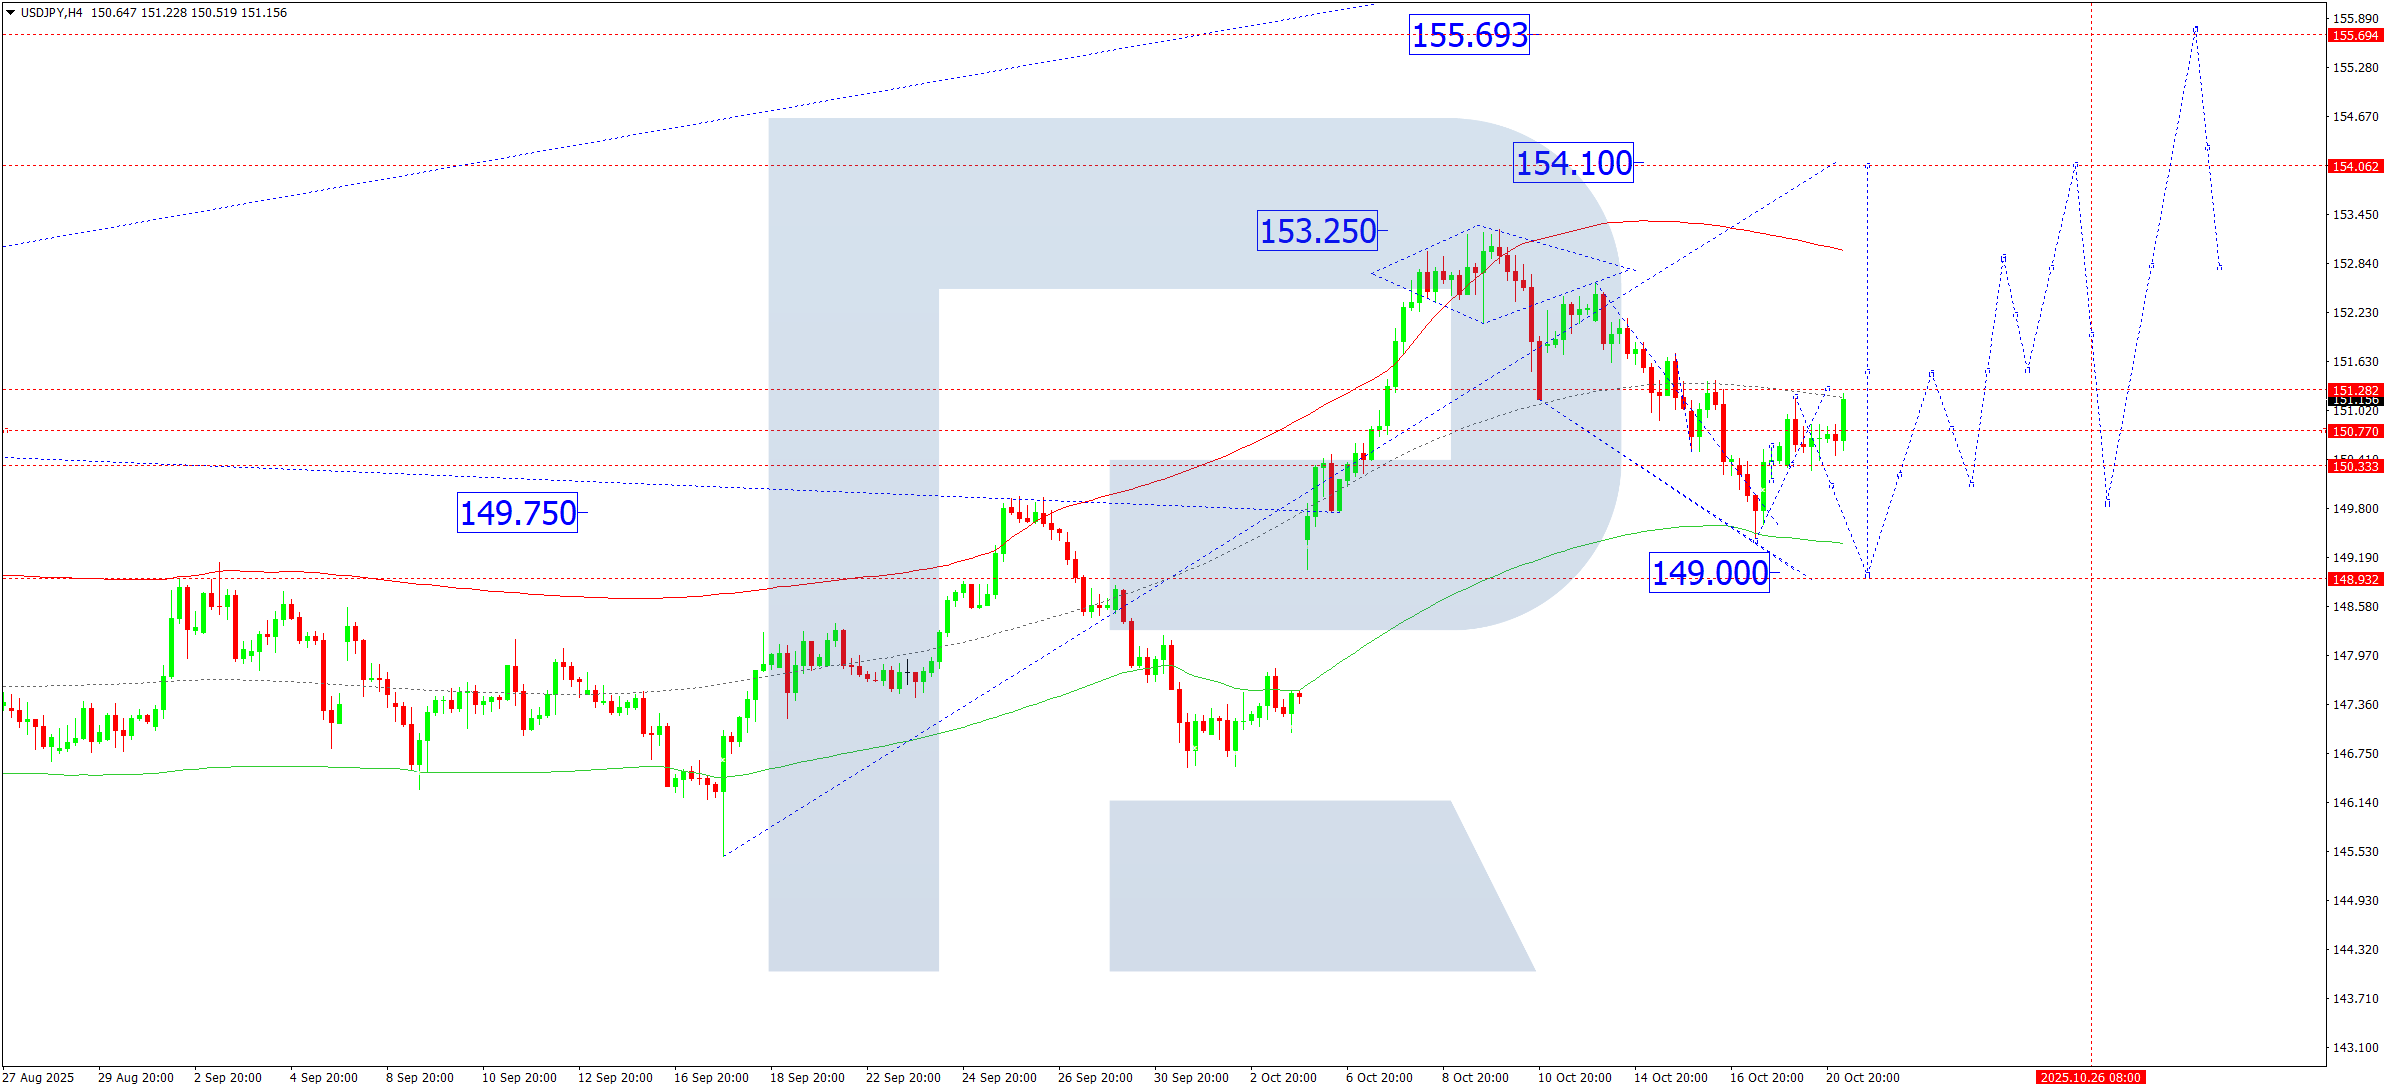
On the H4 chart of USDJPY, a consolidation range formed around 150.33 and, after an upside breakout, the corrective wave is continuing towards 151.30. On 21 October 2025, the pair is expected to reach this level. Subsequently, another downward structure towards 149.00 is possible, which would complete the correction. From there, an upward wave towards 154.10 is anticipated.
Technically, this scenario is supported by the Elliott Wave structure and a bullish wave matrix with a pivot point at 149.75, the key level for this wave. The market is still correcting towards the lower boundary of the Price Envelope at 149.00. Once the correction ends, an advance towards the central line at 151.10 and further towards the upper boundary at 154.10 is expected.
Technical indicators for today’s USDJPY forecast point to a potential rise to 151.30 and a subsequent pullback to 149.00.
GBPUSD forecast
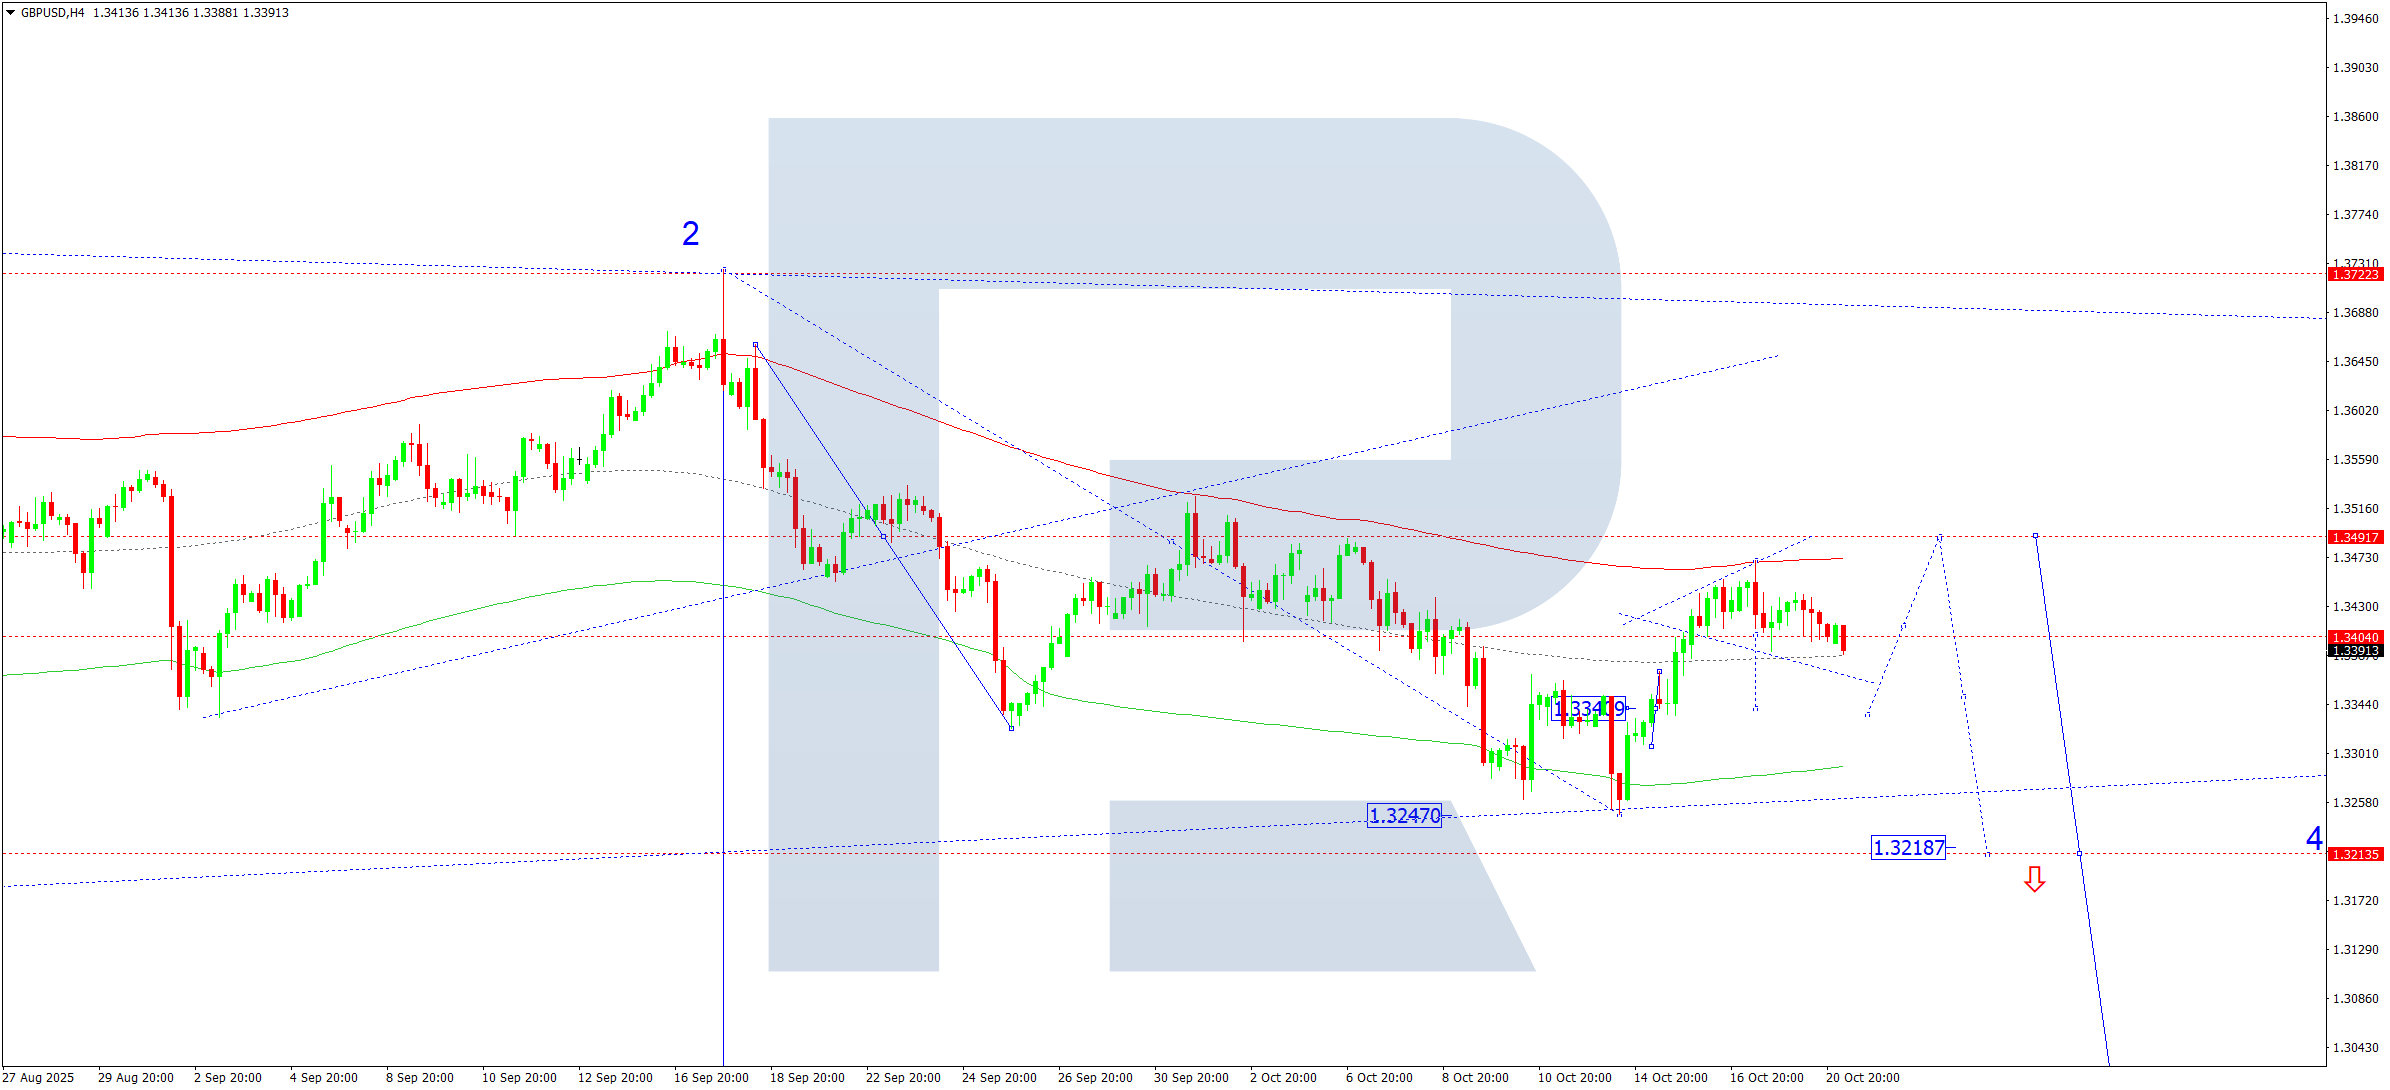
On the H4 chart of GBPUSD, a consolidation range formed around 1.3400 and then broke to the downside. On 21 October 2025, there is potential for a decline towards 1.3340 at a minimum. Later, another corrective structure towards 1.3490 is possible, followed by a decline to 1.3218.
Technically, this scenario is confirmed by the Elliott Wave structure and the bearish wave matrix with a pivot point at 1.3490, considered key in this wave. A consolidation band formed around the central line of the Price Envelope, and the downside breakout continues towards its lower boundary. The correction may complete near the upper boundary at 1.3340. A subsequent rebound towards 1.3490 is possible before the trend resumes lower towards the lower boundary at 1.3218.
Technical indicators for today’s GBPUSD forecast suggest a decline to 1.3340.
AUDUSD forecast
On the H4 chart of AUDUSD, a correction reached 0.6524 and a downward wave towards 0.6415 has begun. On 21 October 2025, the pair is expected to reach this level, with a downward breakout likely to open the potential for trend continuation towards 0.6233.
Technically, this scenario is confirmed by the Elliott Wave structure and the bearish wave matrix with a pivot point at 0.6620, the key level in this wave. The market completed a decline to the lower boundary of the Price Envelope at 0.6440 and a corrective move to its central line at 0.6524. A decline towards the lower boundary at 0.6415 is now anticipated.
Technical indicators for today’s AUDUSD forecast suggest a move down to 0.6415.

USDCAD forecast
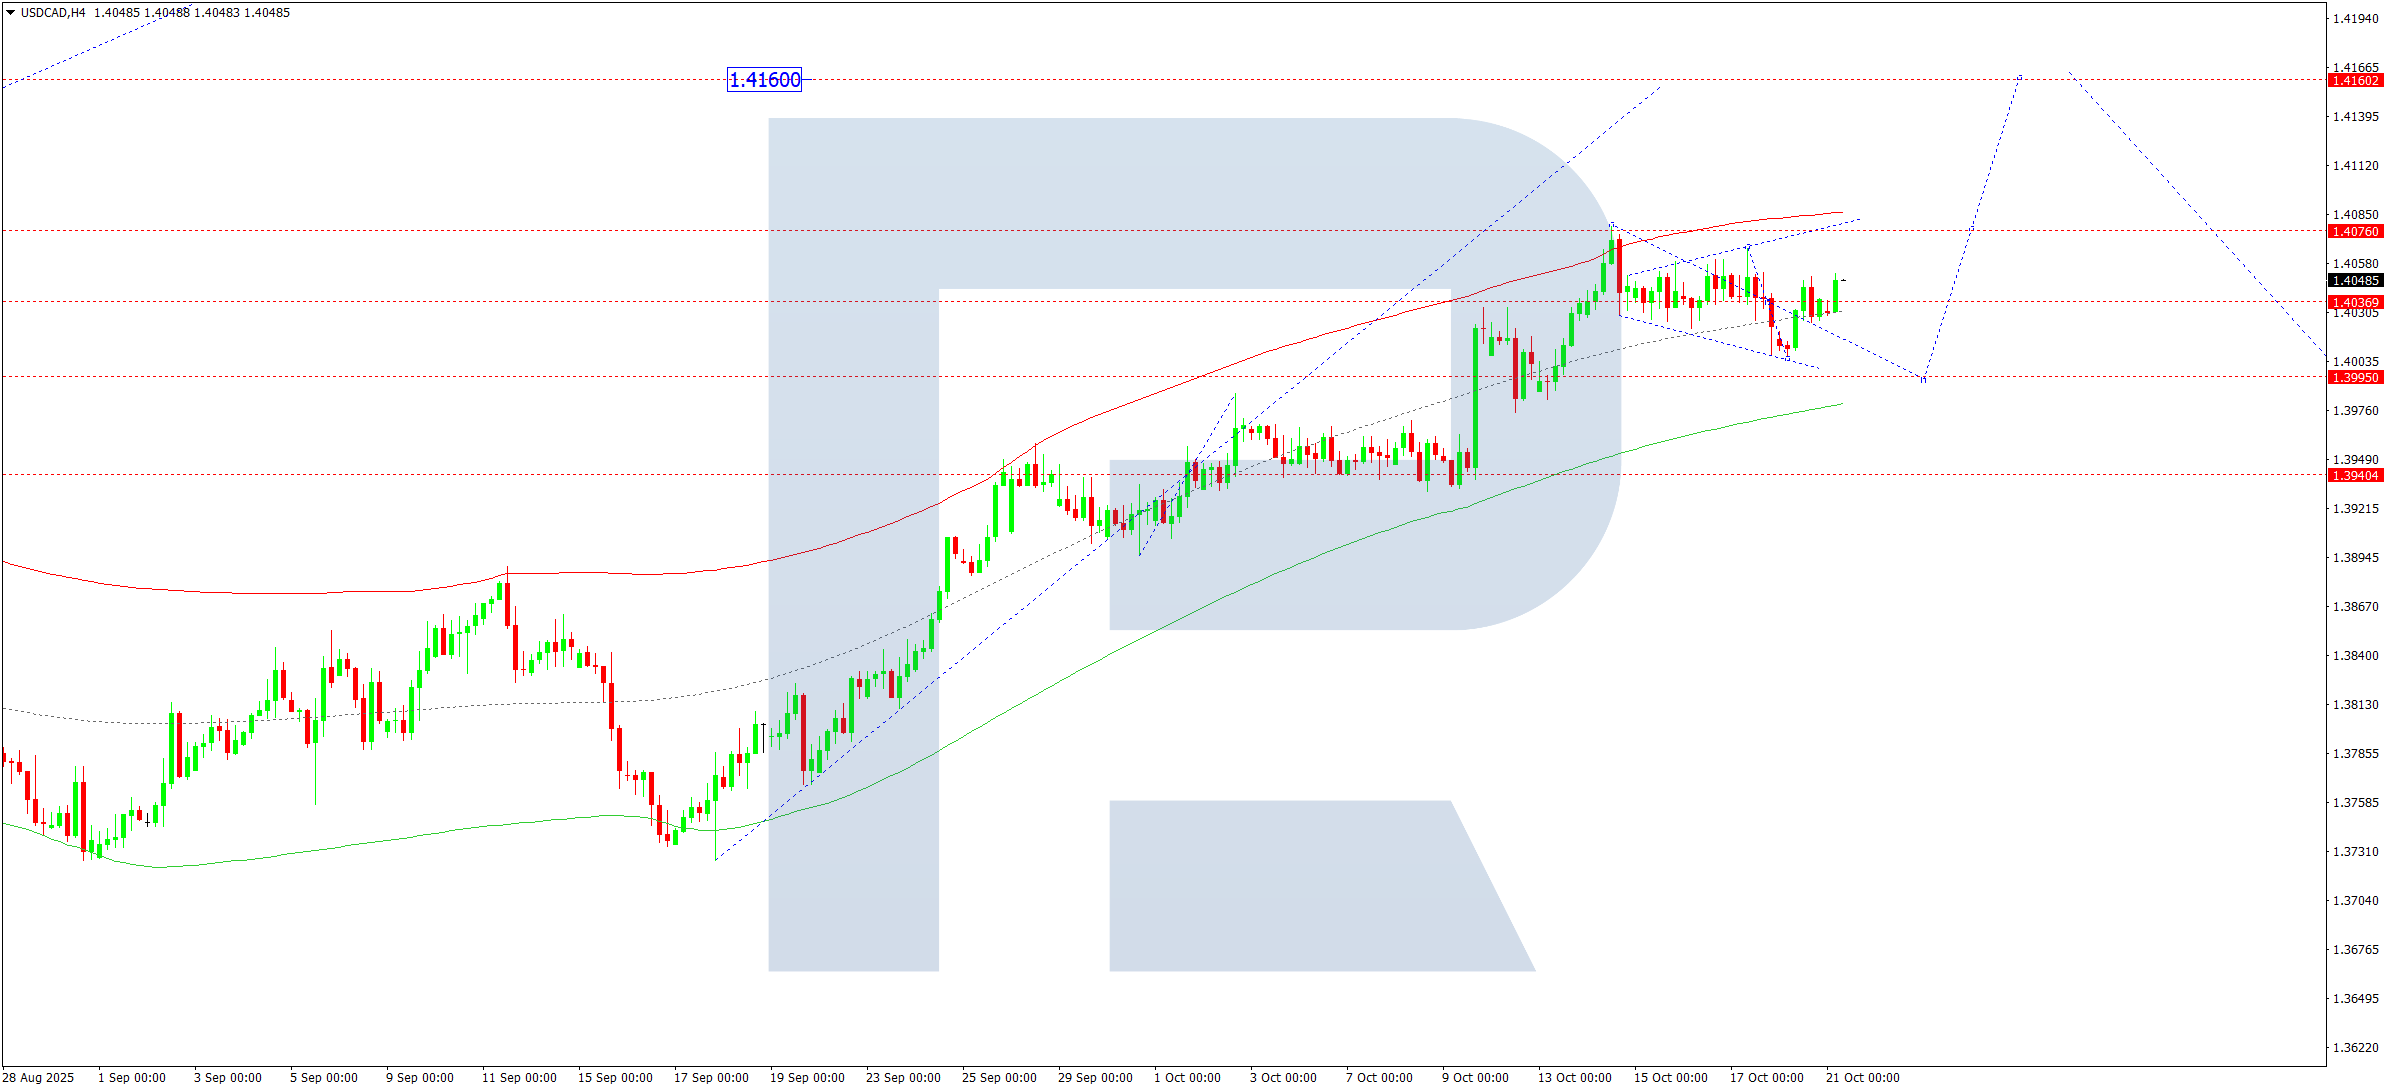
On the H4 chart of USDCAD, the market continues to consolidate around 1.4035. On 21 October 2025, the range may expand upwards to 1.4076, followed by a possible decline to 1.3995. A breakout above 1.4076 would open the potential for a continuation towards 1.4160 as a local target.
Technically, this scenario is supported by the Elliott Wave structure and a bullish wave matrix with a pivot point at 1.3940, the key level in this wave. The structure is developing towards the upper boundary of the Price Envelope at 1.4160. An initial push towards 1.4076 is plausible; if broken, extension towards 1.4160 is in view. Later, a corrective move towards the central line at 1.3940 (testing from above) is possible.
Technical indicators for today’s USDCAD forecast suggest the pair could continue its upward trajectory towards 1.4070 and 1.4160.
XAUUSD forecast
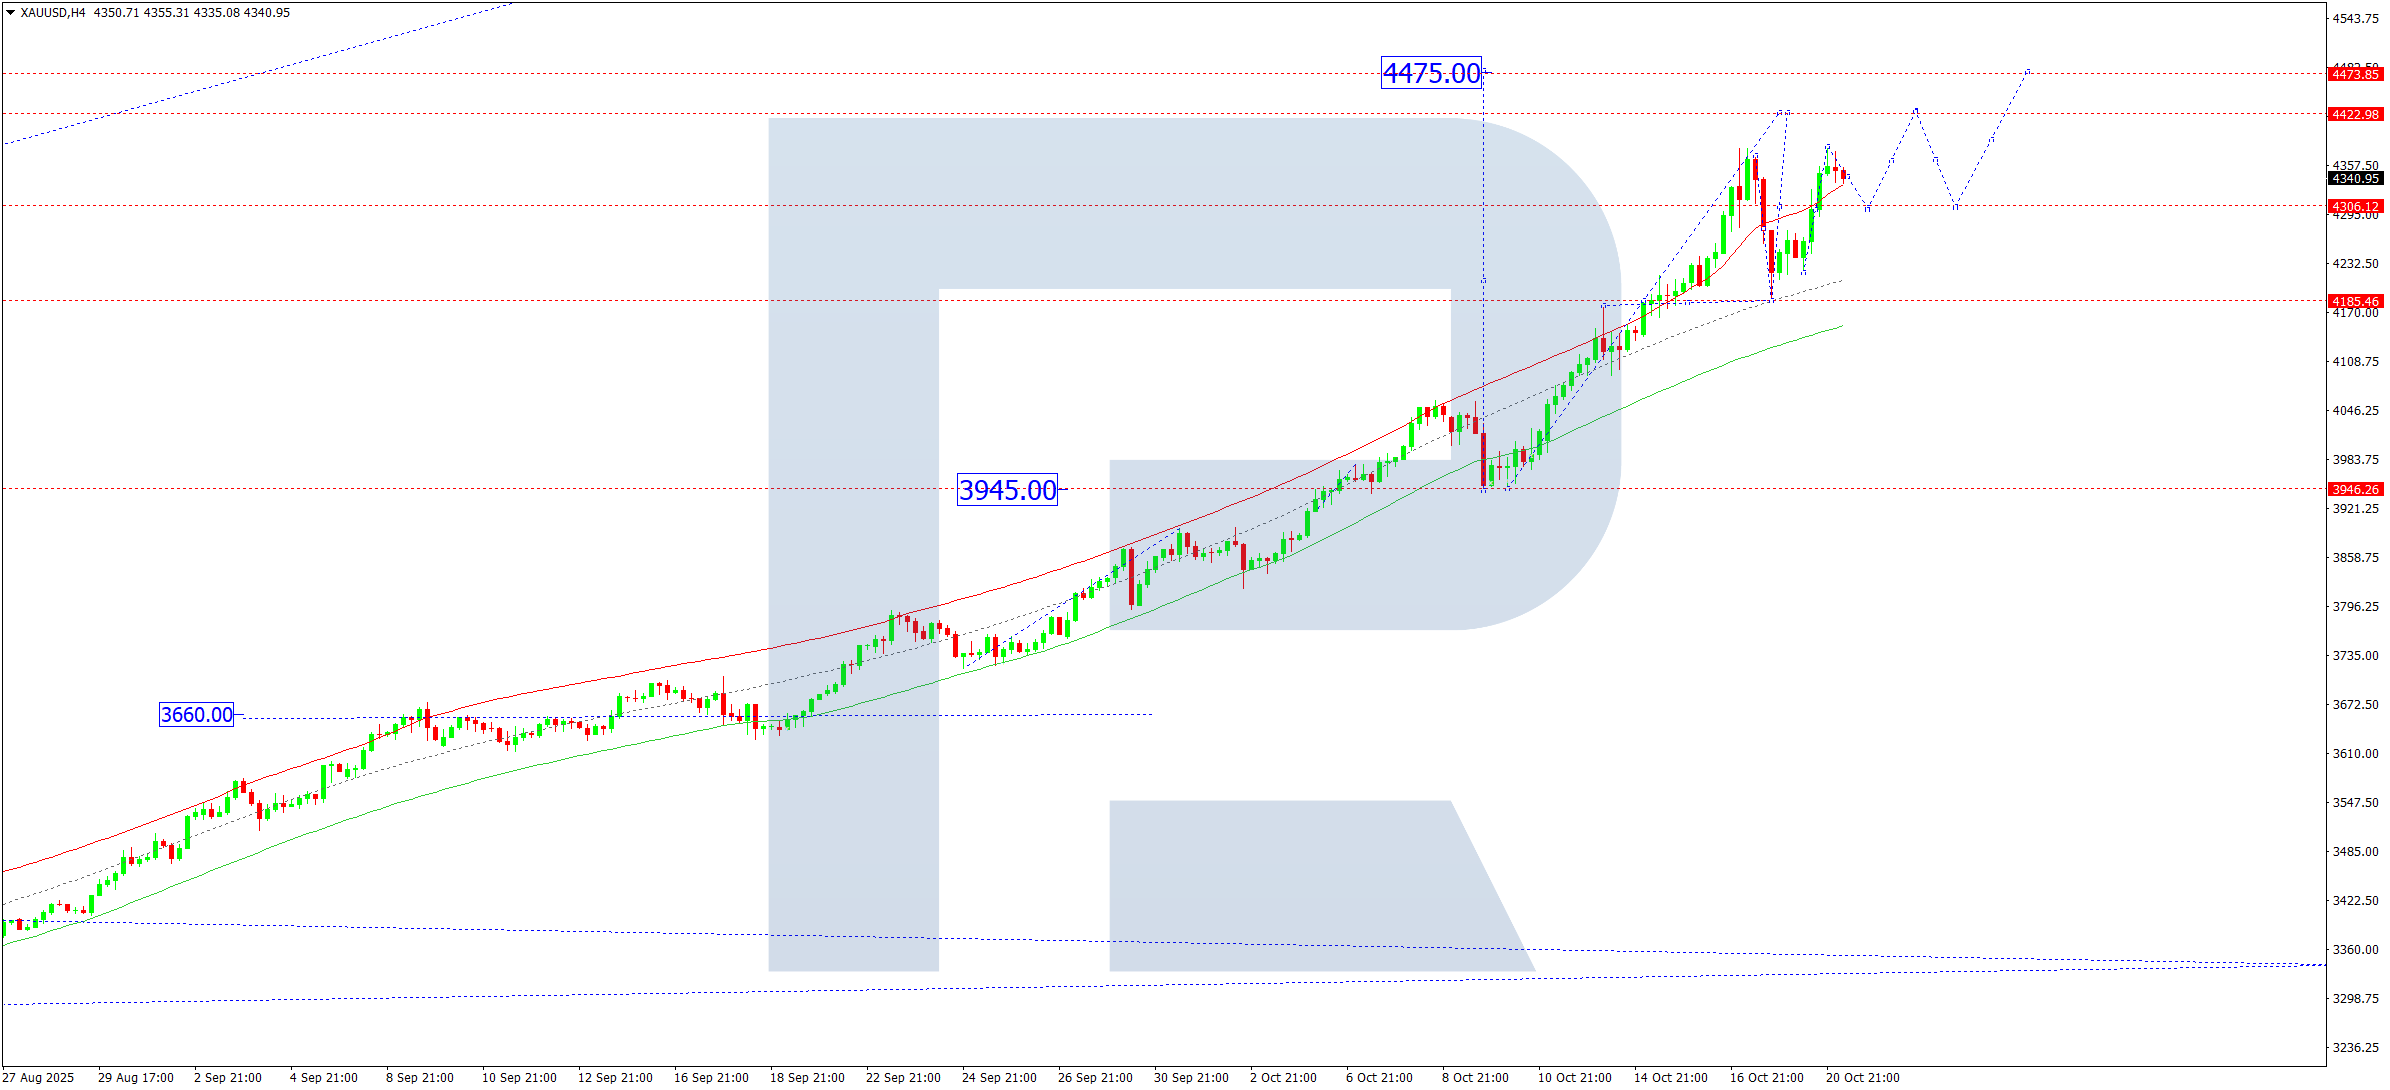
On the H4 chart of XAUUSD, a consolidation range is forming around 4,306. On 21 October 2025, an upside breakout would signal continuation towards 4,422 with prospects of extending the trend to 4,475. A downside breakout would point to the start of a correction towards 4,170.
Technically, this scenario is confirmed by the Elliott Wave structure and a bullish wave matrix with a pivot point at 3,660, the key level for this wave. The structure is developing towards the upper boundary of the Price Envelope at 4,475, followed by a possible correction to its lower boundary at 4,170.
Technical indicators for today’s XAUUSD forecast indicate potential continuation of the upward wave towards 4,475.
Brent forecast
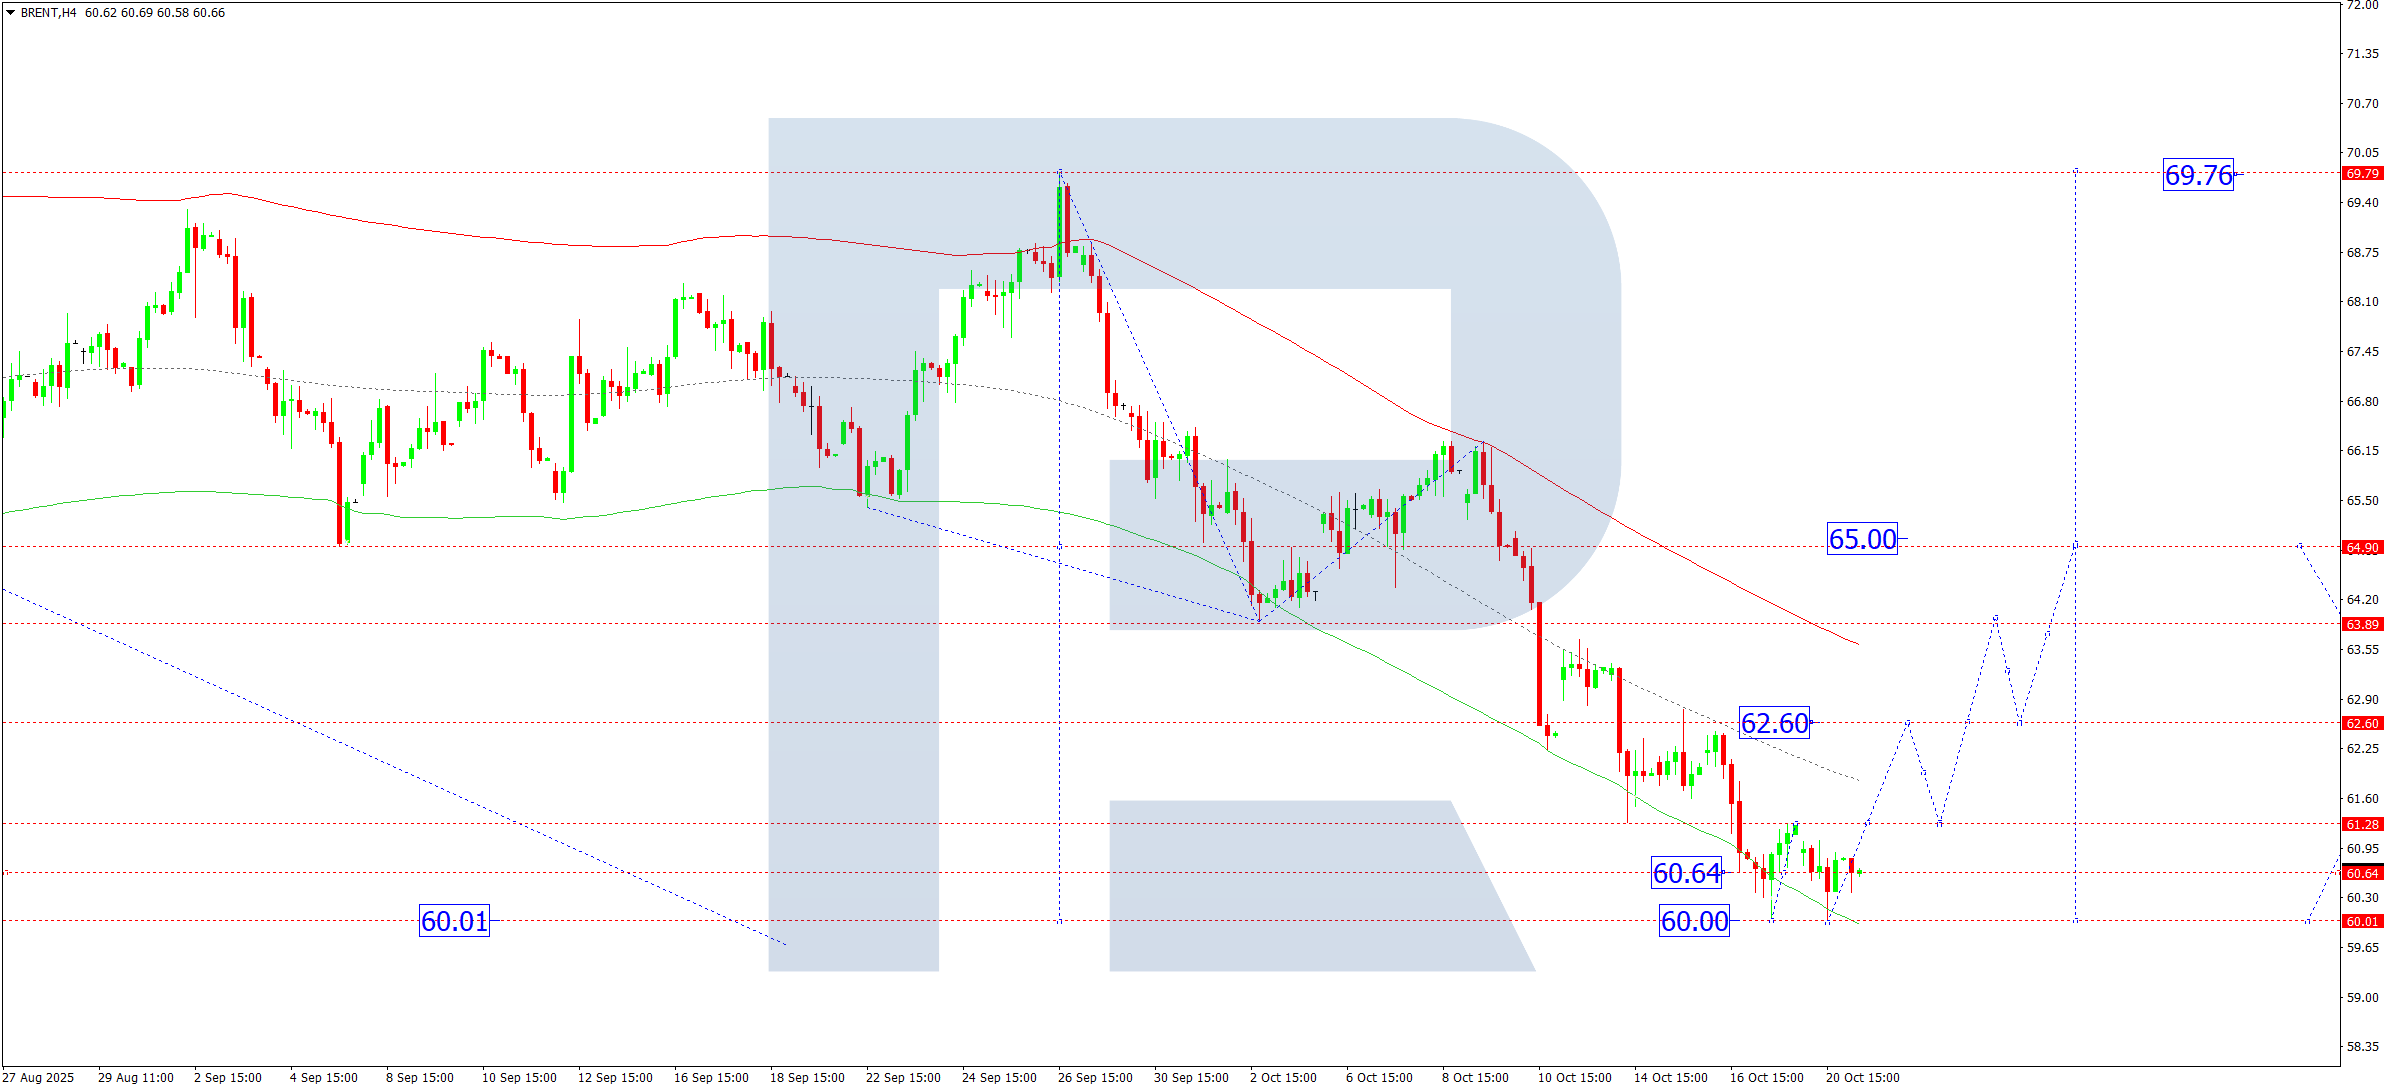
On the H4 chart of Brent crude, the market advanced to 61.28 and then pulled back to 60.00, outlining the bounds of a consolidation range around 60.64. On 21 October 2025, an upside breakout would suggest the start of a rise towards 62.60 with potential continuation to 65.00 as the first target. A downside breakout could extend the decline to 59.00 before a subsequent rise towards 65.00.
Technically, this scenario is supported by the Elliott Wave structure and the bearish wave matrix with a pivot point at 65.65, the key level in this wave. The market reached the lower boundary of the Price Envelope at 60.00; looking ahead, a move towards the upper boundary at 65.00 is in view.
Technical indicators for today’s Brent forecast suggest potential growth towards 63.00 and 65.00.
Forecasts presented in this section only reflect the author’s private opinion and should not be considered as guidance for trading. RoboForex bears no responsibility for trading results based on trading recommendations described in these analytical reviews.