Daily technical analysis and forecast for 17 October 2025
Here is a detailed daily technical analysis and forecast for EURUSD, USDJPY, GBPUSD, AUDUSD, USDCAD, XAUUSD and Brent for 17 October 2025.
EURUSD forecast
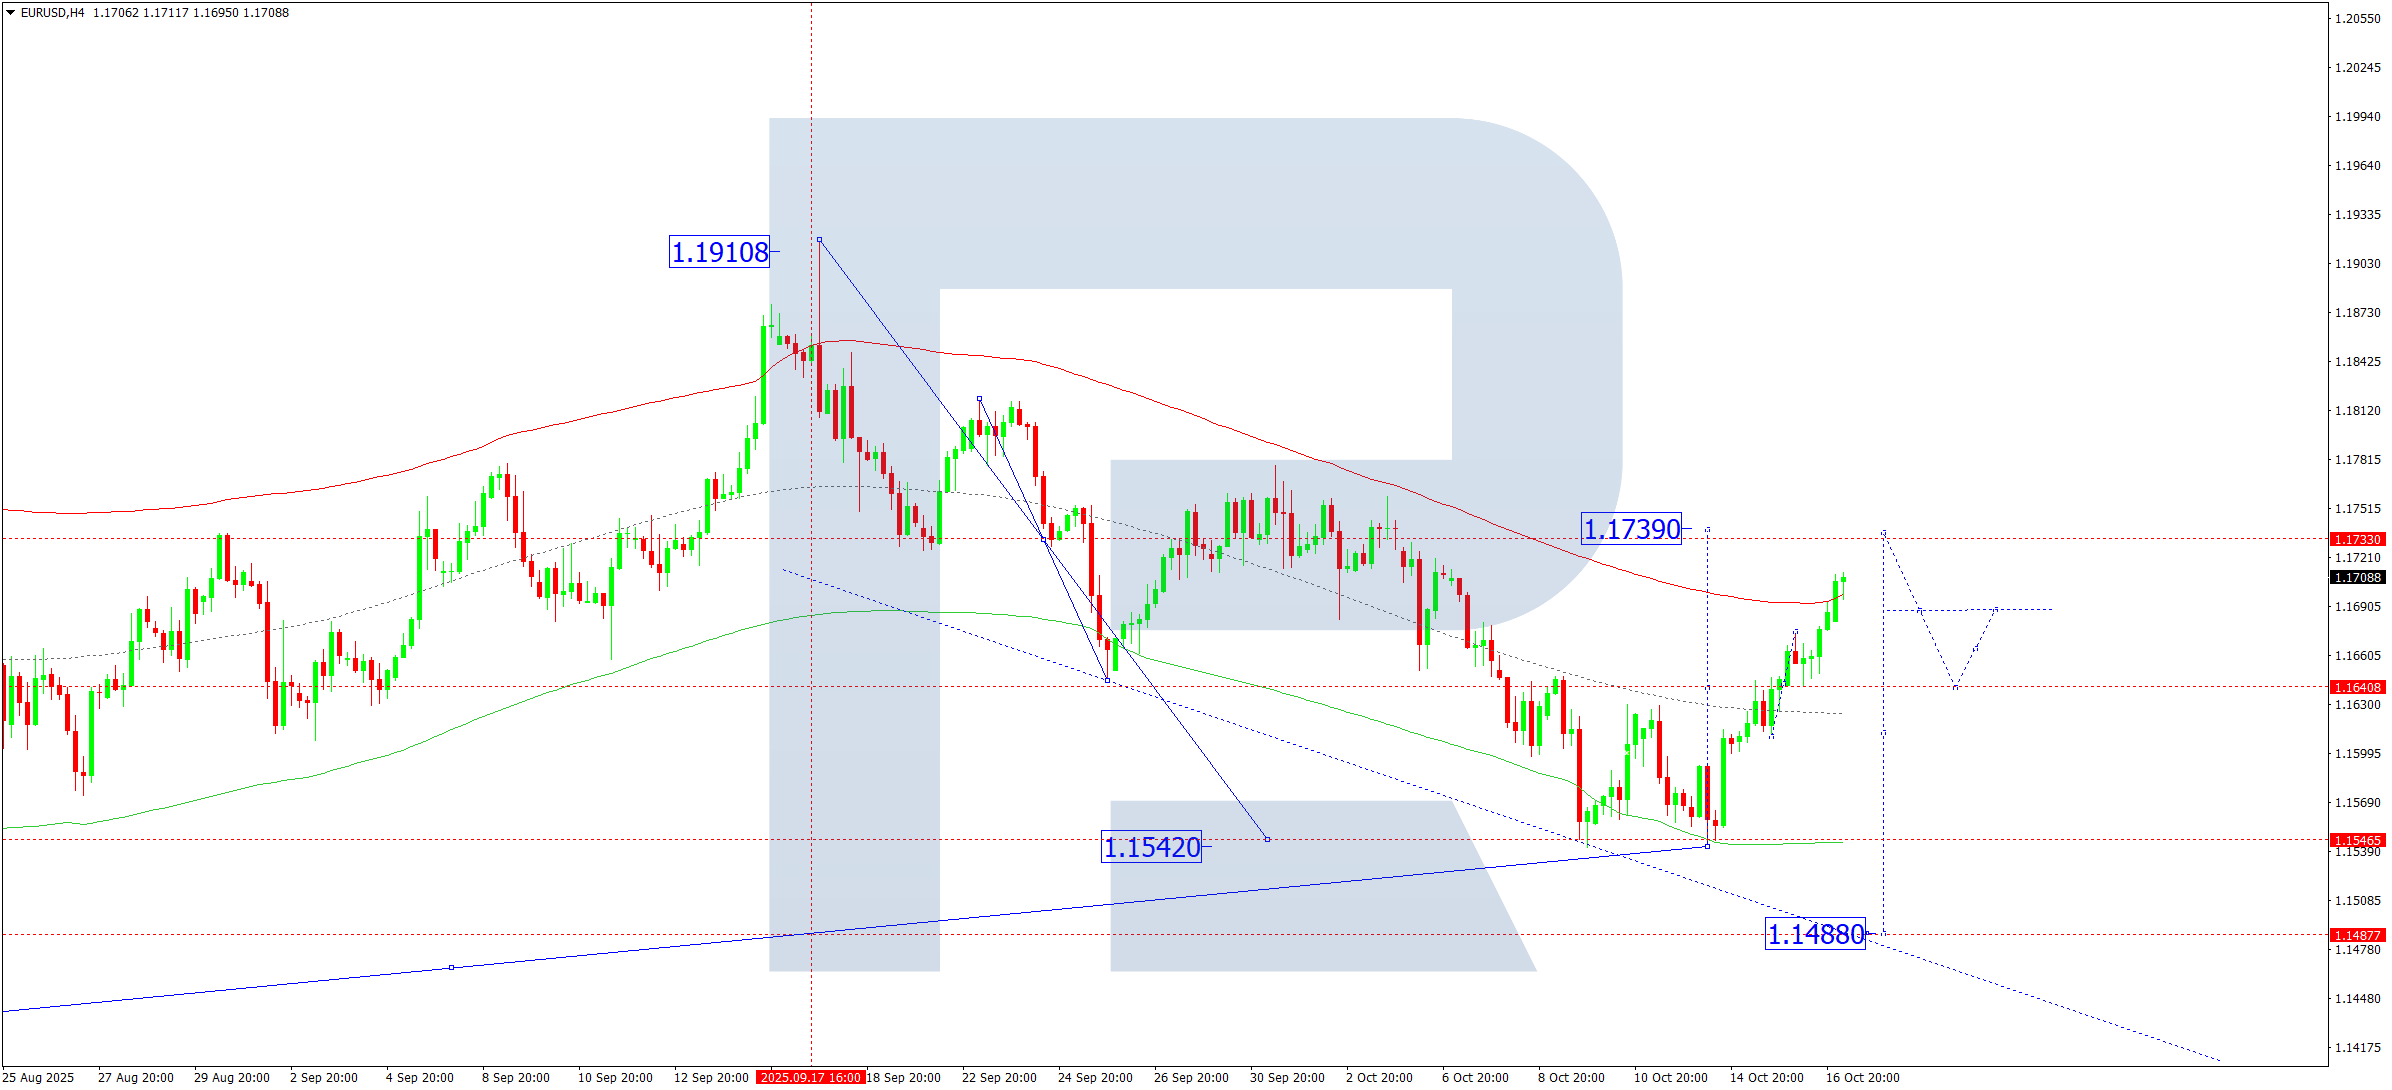
On the H4 chart of EURUSD, the market formed a consolidation range around 1.1640 and, breaking upwards, continues a corrective wave towards 1.1733. On 17 October 2025, a pullback to 1.1640 (testing from above) is expected. Afterwards, a further rise towards 1.1739 is possible. Once this correction is complete, a new downward wave towards 1.1488 is anticipated as a local trend target.
Technically, this scenario is supported by the Elliott Wave structure and the bearish wave matrix with a pivot point at 1.1740, considered key in the EURUSD wave structure. Further correction towards the upper boundary of the Price Envelope at 1.1739 is expected, followed by a decline towards the lower boundary at 1.1488.
Technical indicators for today’s EURUSD forecast suggest the correction could complete near 1.1739, followed by the start of a downward wave towards at least 1.1488.
USDJPY forecast
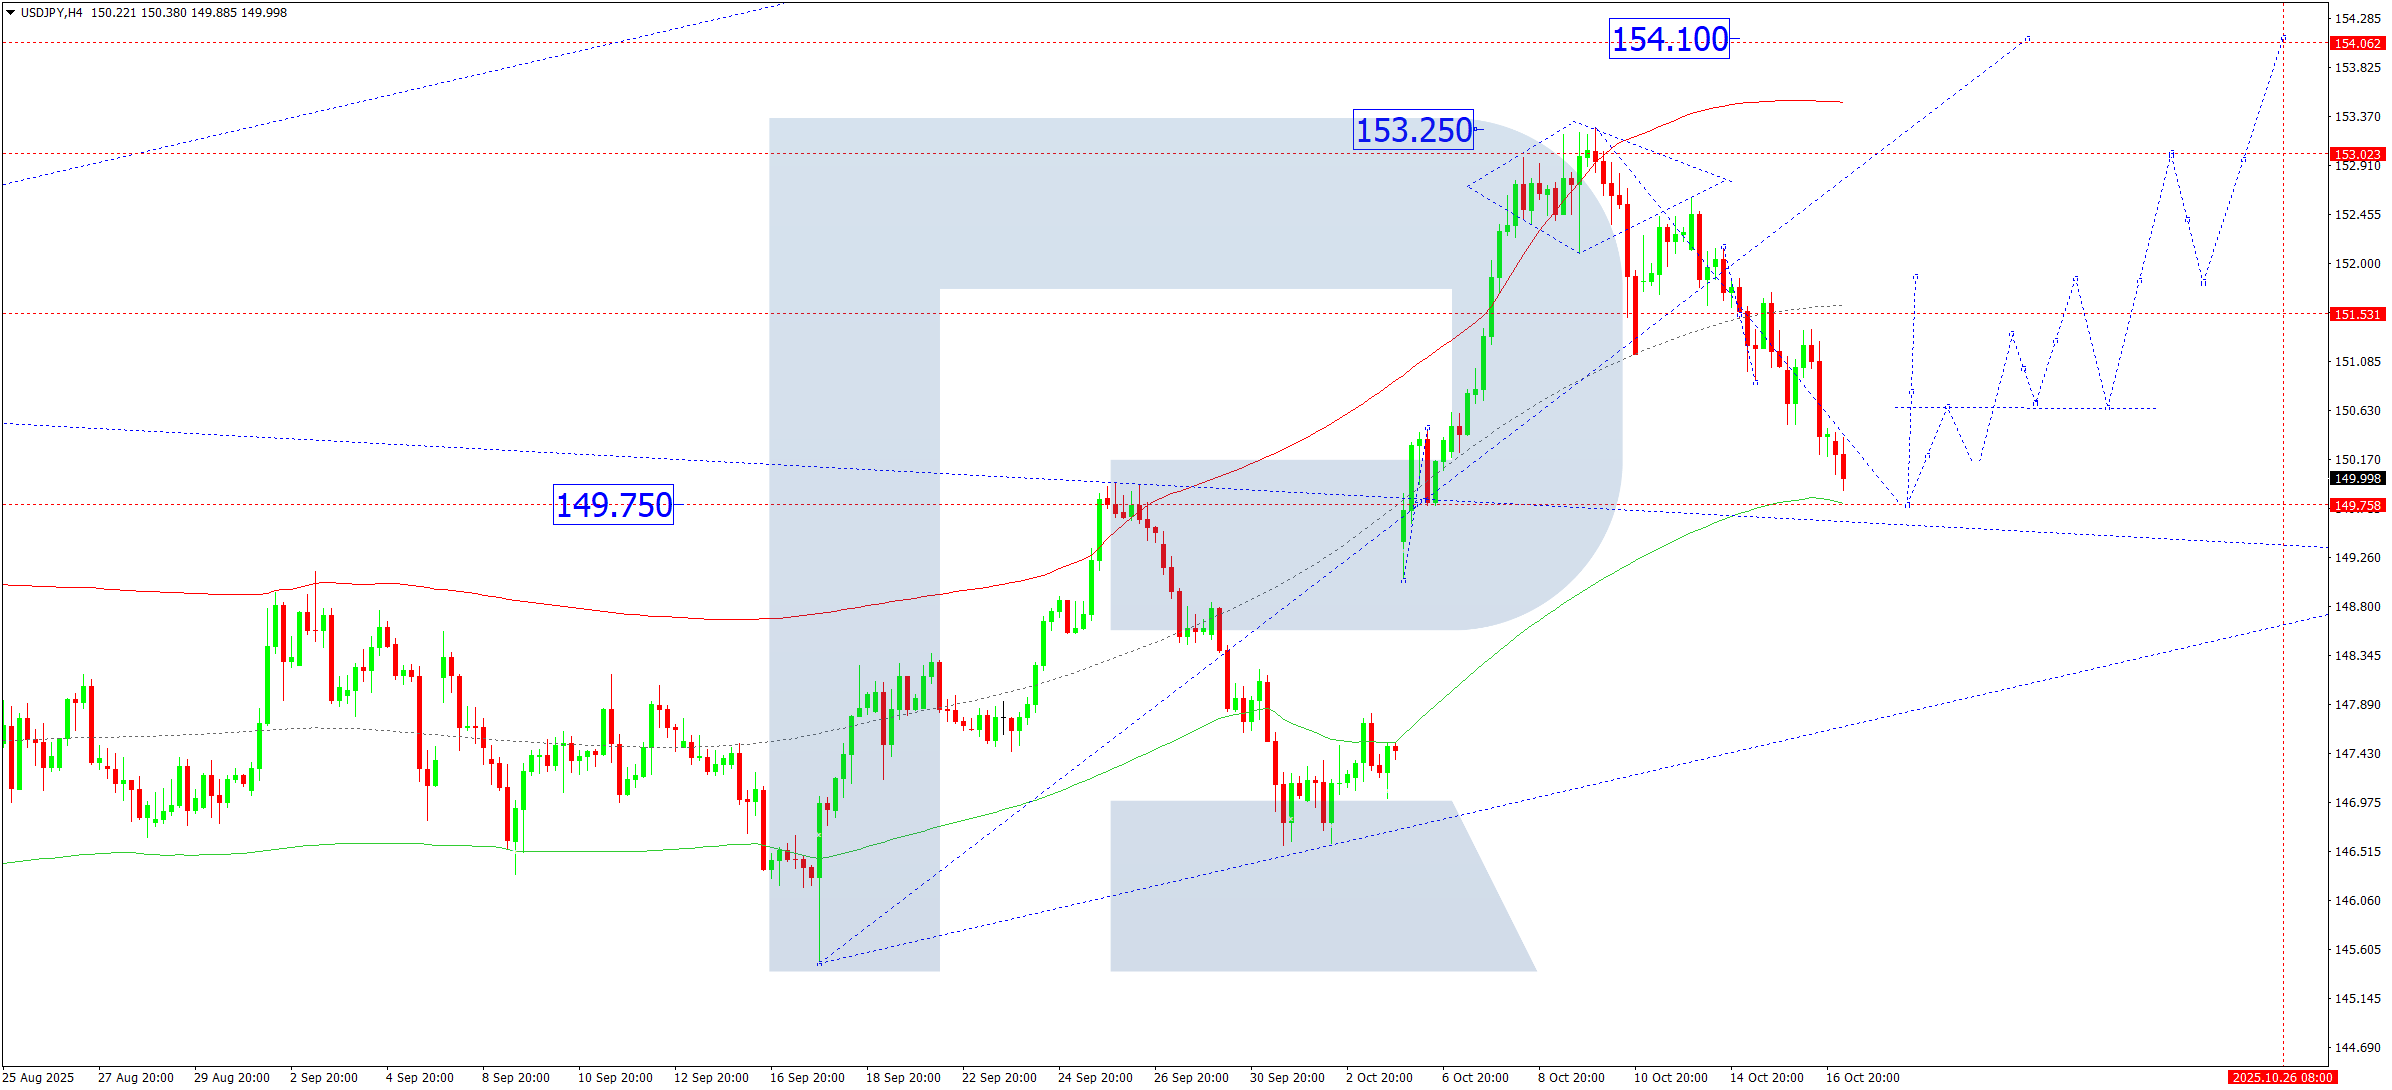
On the H4 chart of USDJPY, the corrective wave towards 149.75 remains in progress. On 17 October 2025, this correction is expected to complete, followed by an advance towards 151.85, with potential extension to 154.10.
Technically, the scenario is confirmed by the Elliott Wave structure and the bullish wave matrix with a pivot point at 149.75, the key level in this wave. The market continues correcting towards the lower boundary of the Price Envelope at 149.75. After the correction ends, an upward wave towards the upper boundary at 154.10 is anticipated.
Technical indicators for today’s USDJPY forecast suggest a continued correction towards 149.75 and the start of growth towards 151.85.
GBPUSD forecast
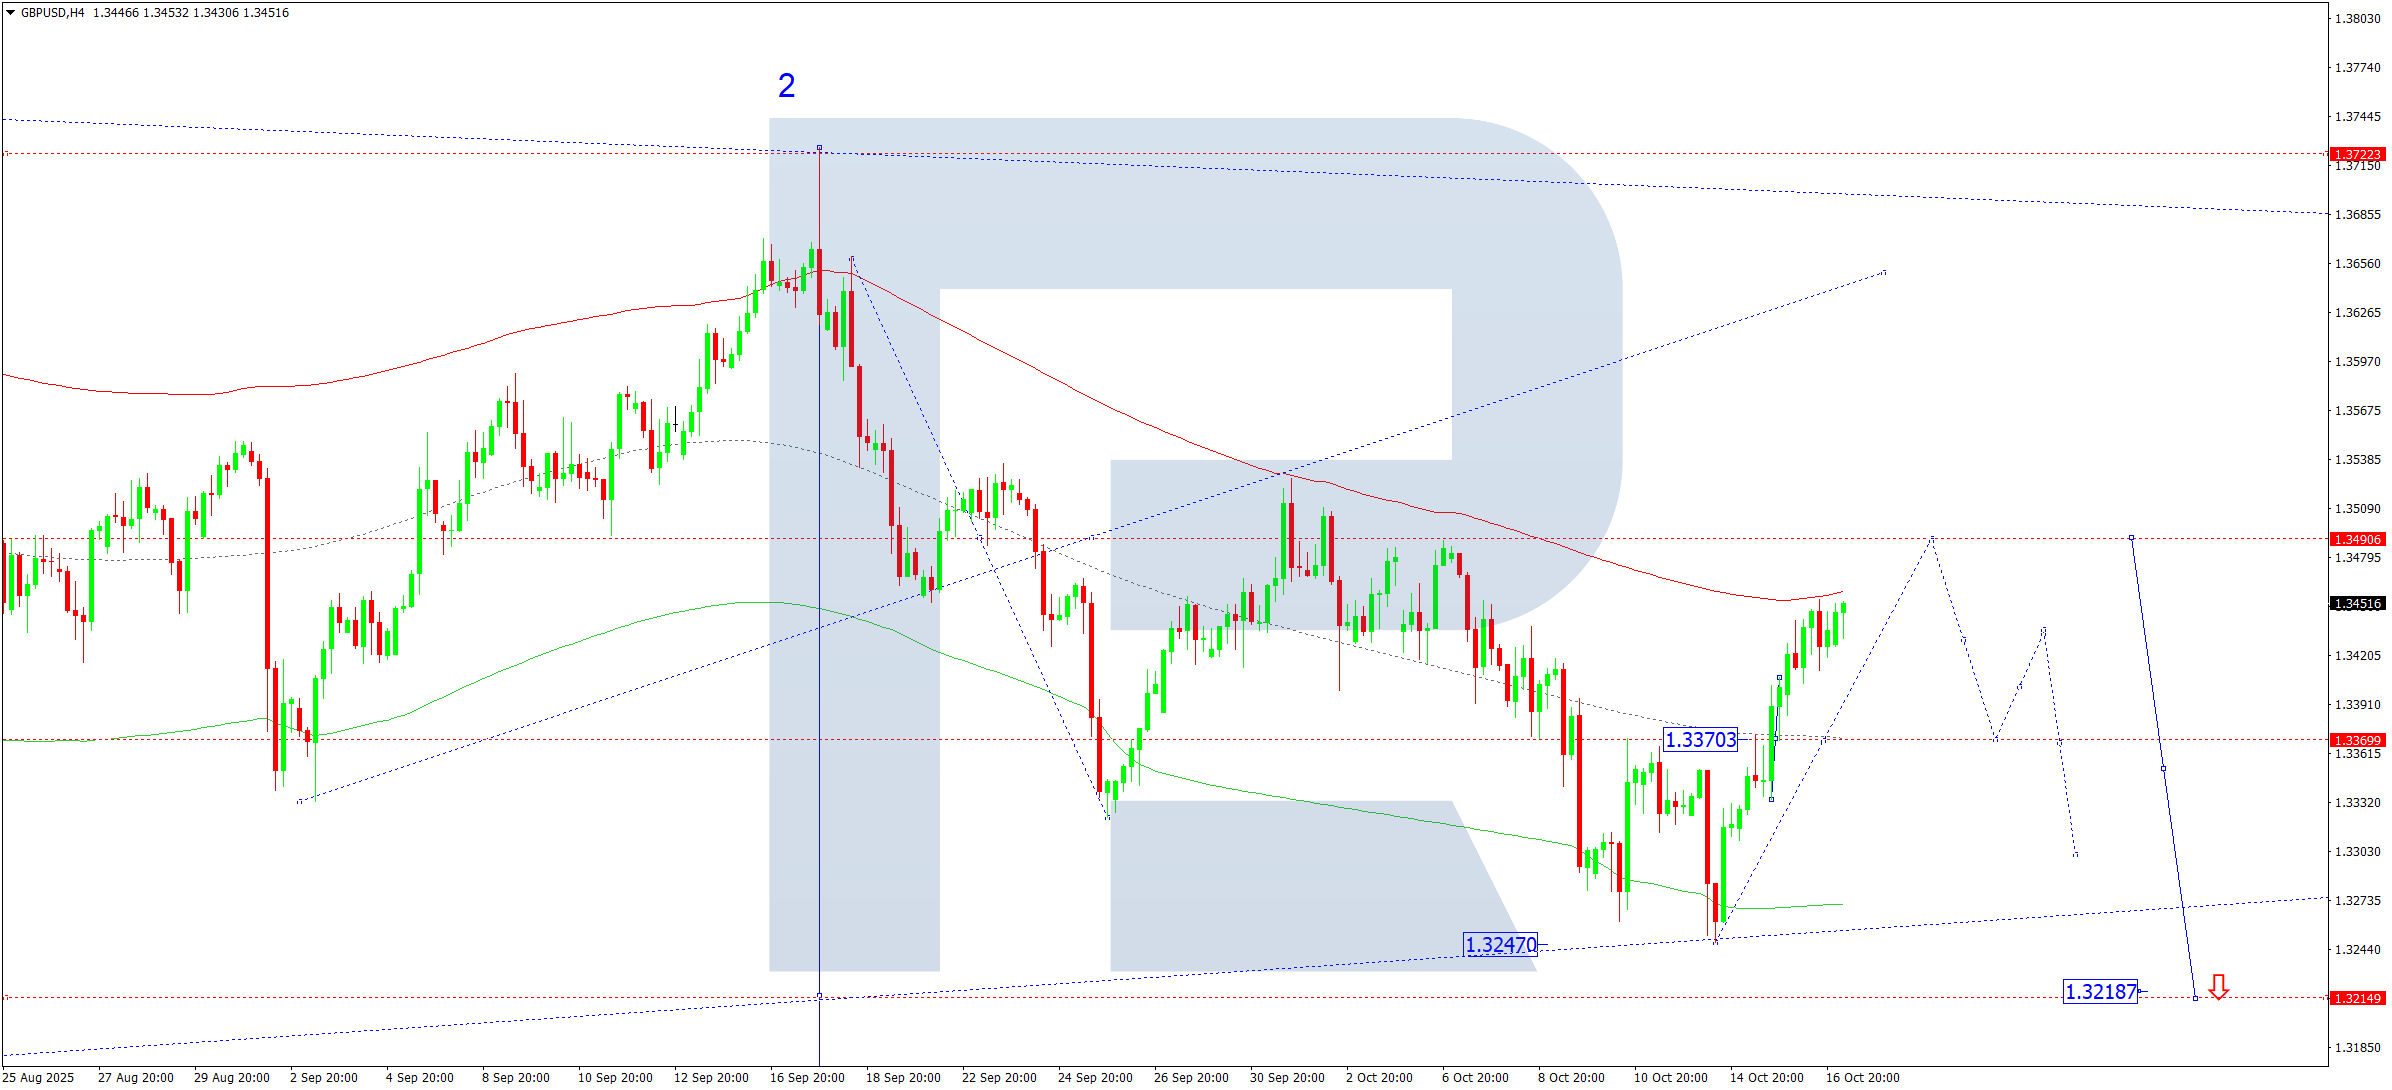
On the GBPUSD H4 chart, the market formed a consolidation range around 1.3370 and, breaking upwards, continues a corrective movement towards 1.3490. On 17 October 2025, the correction is expected to end, followed by a decline back to 1.3370. A breakout below this level would open the potential for a further downtrend towards 1.3218 as a local target.
Technically, the scenario is supported by the Elliott Wave structure and the bearish wave matrix with a pivot point at 1.3490, the key level in this wave. A consolidation around the central line of the Price Envelope has formed; with an upward breakout, the corrective leg extends. The correction is expected to complete near the upper boundary at 1.3490, followed by a new downward wave towards the lower boundary at 1.3218 and potential continuation to 1.3125.
Technical indicators for today’s GBPUSD forecast suggest the correction may end near 1.3490, with a subsequent decline towards 1.3218 and 1.3125.
AUDUSD forecast
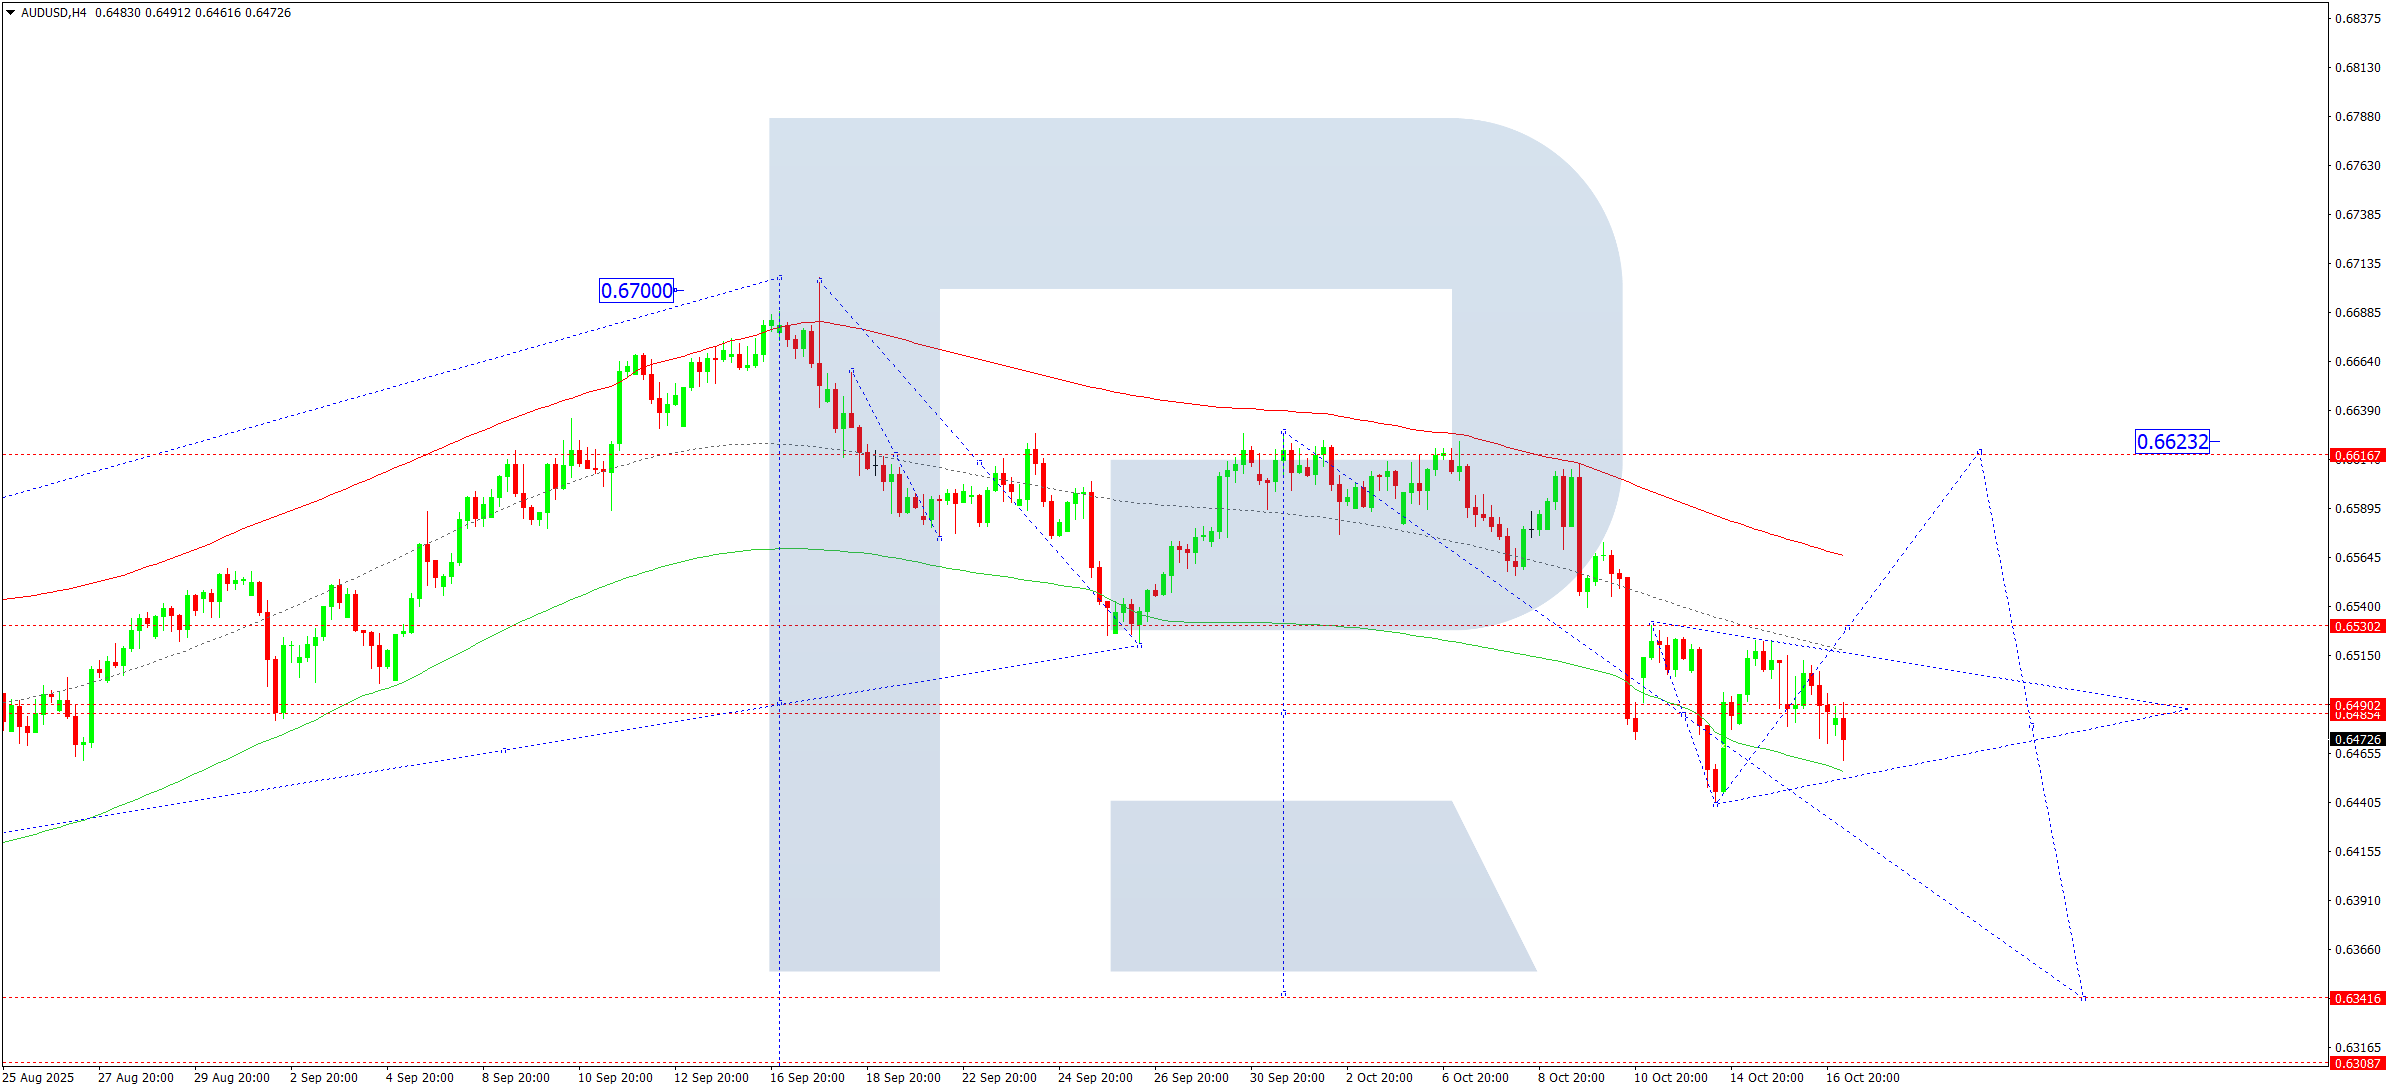
On the H4 chart of AUDUSD, a broad consolidation range is forming around 0.6490. On 17 October 2025, a downside breakout would open the potential for a move to 0.6340. If the price breaks upwards, a corrective leg towards 0.6623 is possible, after which a decline towards 0.6340 is anticipated.
Technically, this is backed by the Elliott Wave structure and the bearish wave matrix with a pivot point at 0.6620, the key level in this wave. The market declined to the lower boundary of the Price Envelope at 0.6440 and is consolidating above this level. An upward breakout could bring a correction to the upper boundary at 0.6623, while a downward exit would open the door for a move further to 0.6340.
Technical indicators for today’s AUDUSD forecast suggest a possible corrective rise towards 0.6623, then a decline towards 0.6340.
USDCAD forecast
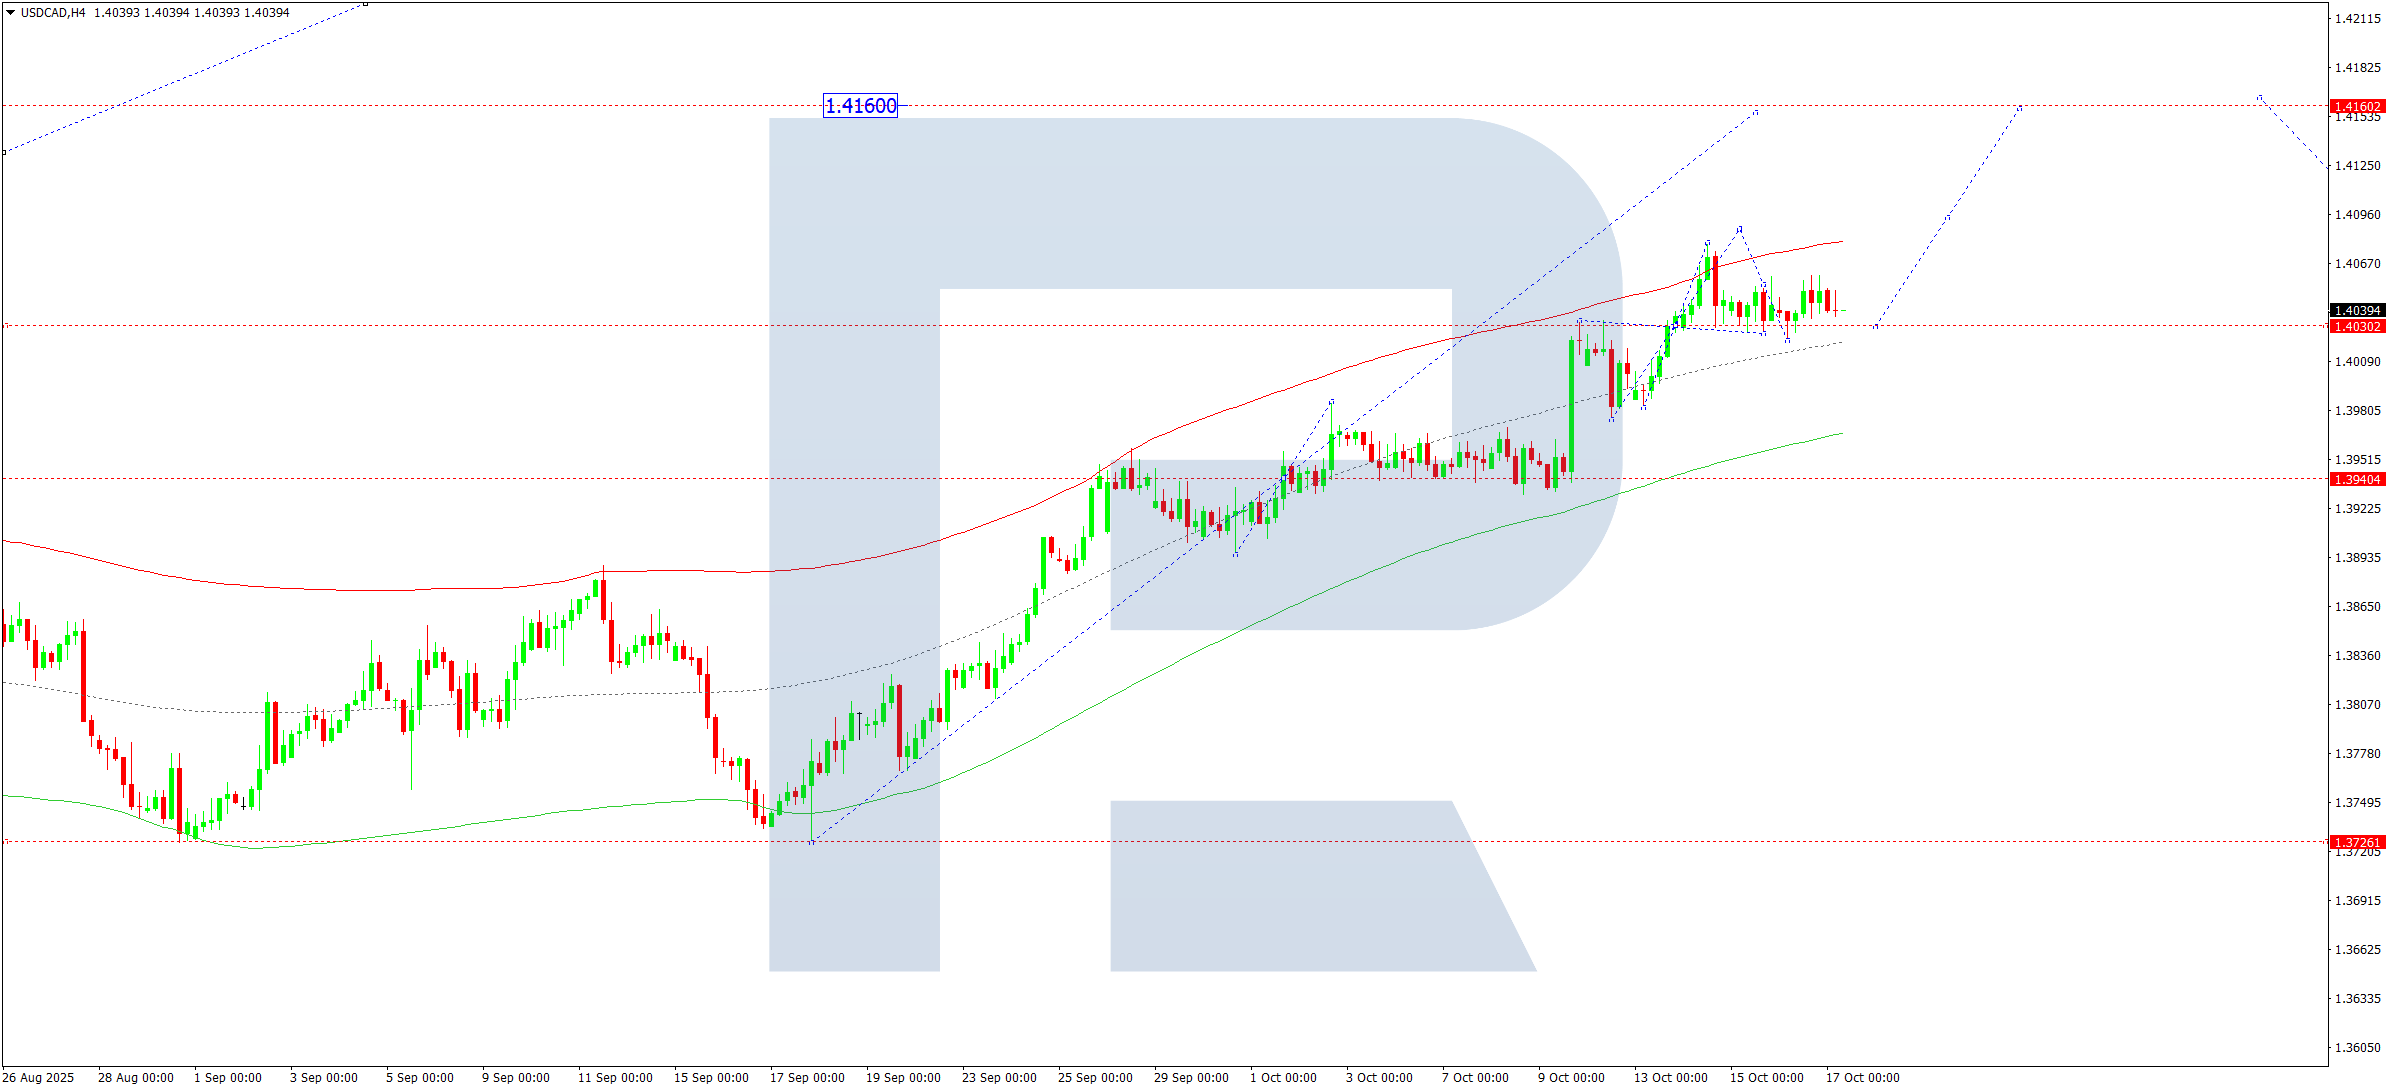
On the H4 chart of USDCAD, a consolidation range around 1.4030 continues without a clear trend. On 17 October 2025, a downside breakout would point to a correction towards 1.3940. An upside breakout would open the potential for the third upward wave towards 1.4160. After reaching this level, the pair could pull back to 1.3940.
Technically, the scenario is confirmed by the Elliott Wave structure and the bullish wave matrix with a pivot point at 1.3940, key for this USDCAD wave. The market is building an upward structure towards the upper boundary of the Price Envelope at 1.4160, with the price expected to reach this level today. Subsequently, the pair could correct towards the central line at 1.3940 (testing from above) before rising to 1.4330.
Technical indicators for today’s USDCAD forecast suggest a continued upward move towards 1.4080 and 1.4160.
XAUUSD forecast
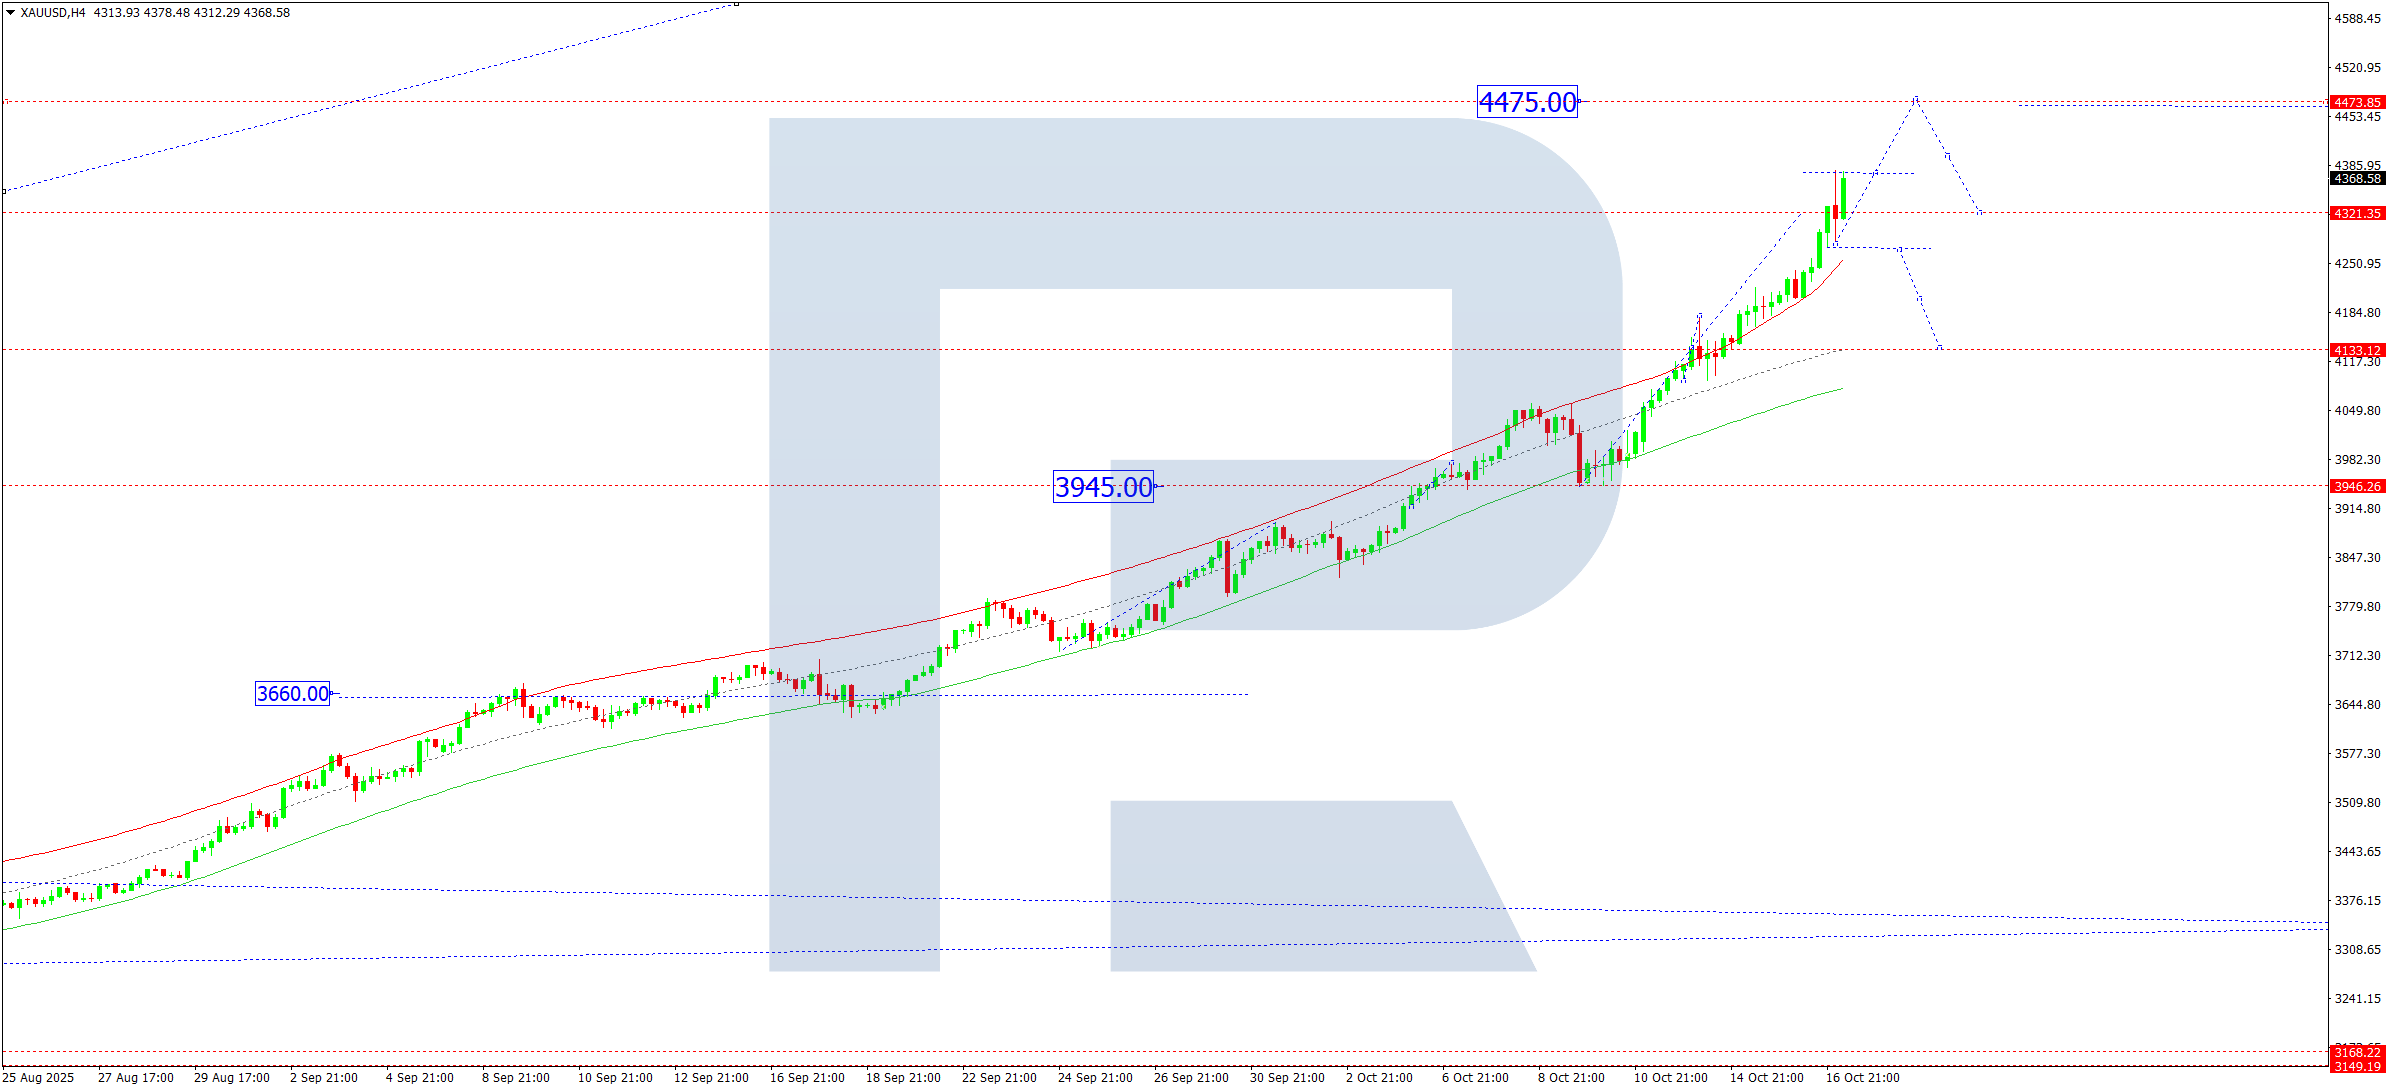
On the H4 chart of XAUUSD, the market advanced to 4,375. On 17 October 2025, a consolidation range is forming below this level. An upward breakout would extend the move to 4,475, while a downward breakout could trigger a correction towards 4,133.
Technically, the scenario is supported by the Elliott Wave structure and the bullish wave matrix with a pivot point at 3,660, the key level for this XAUUSD wave. The market is developing an upward structure towards the upper boundary of the Price Envelope at 4,475, followed by a correction towards the lower boundary at 4,133.
Technical indicators for today’s XAUUSD forecast suggest further growth towards 4,475.
Brent forecast
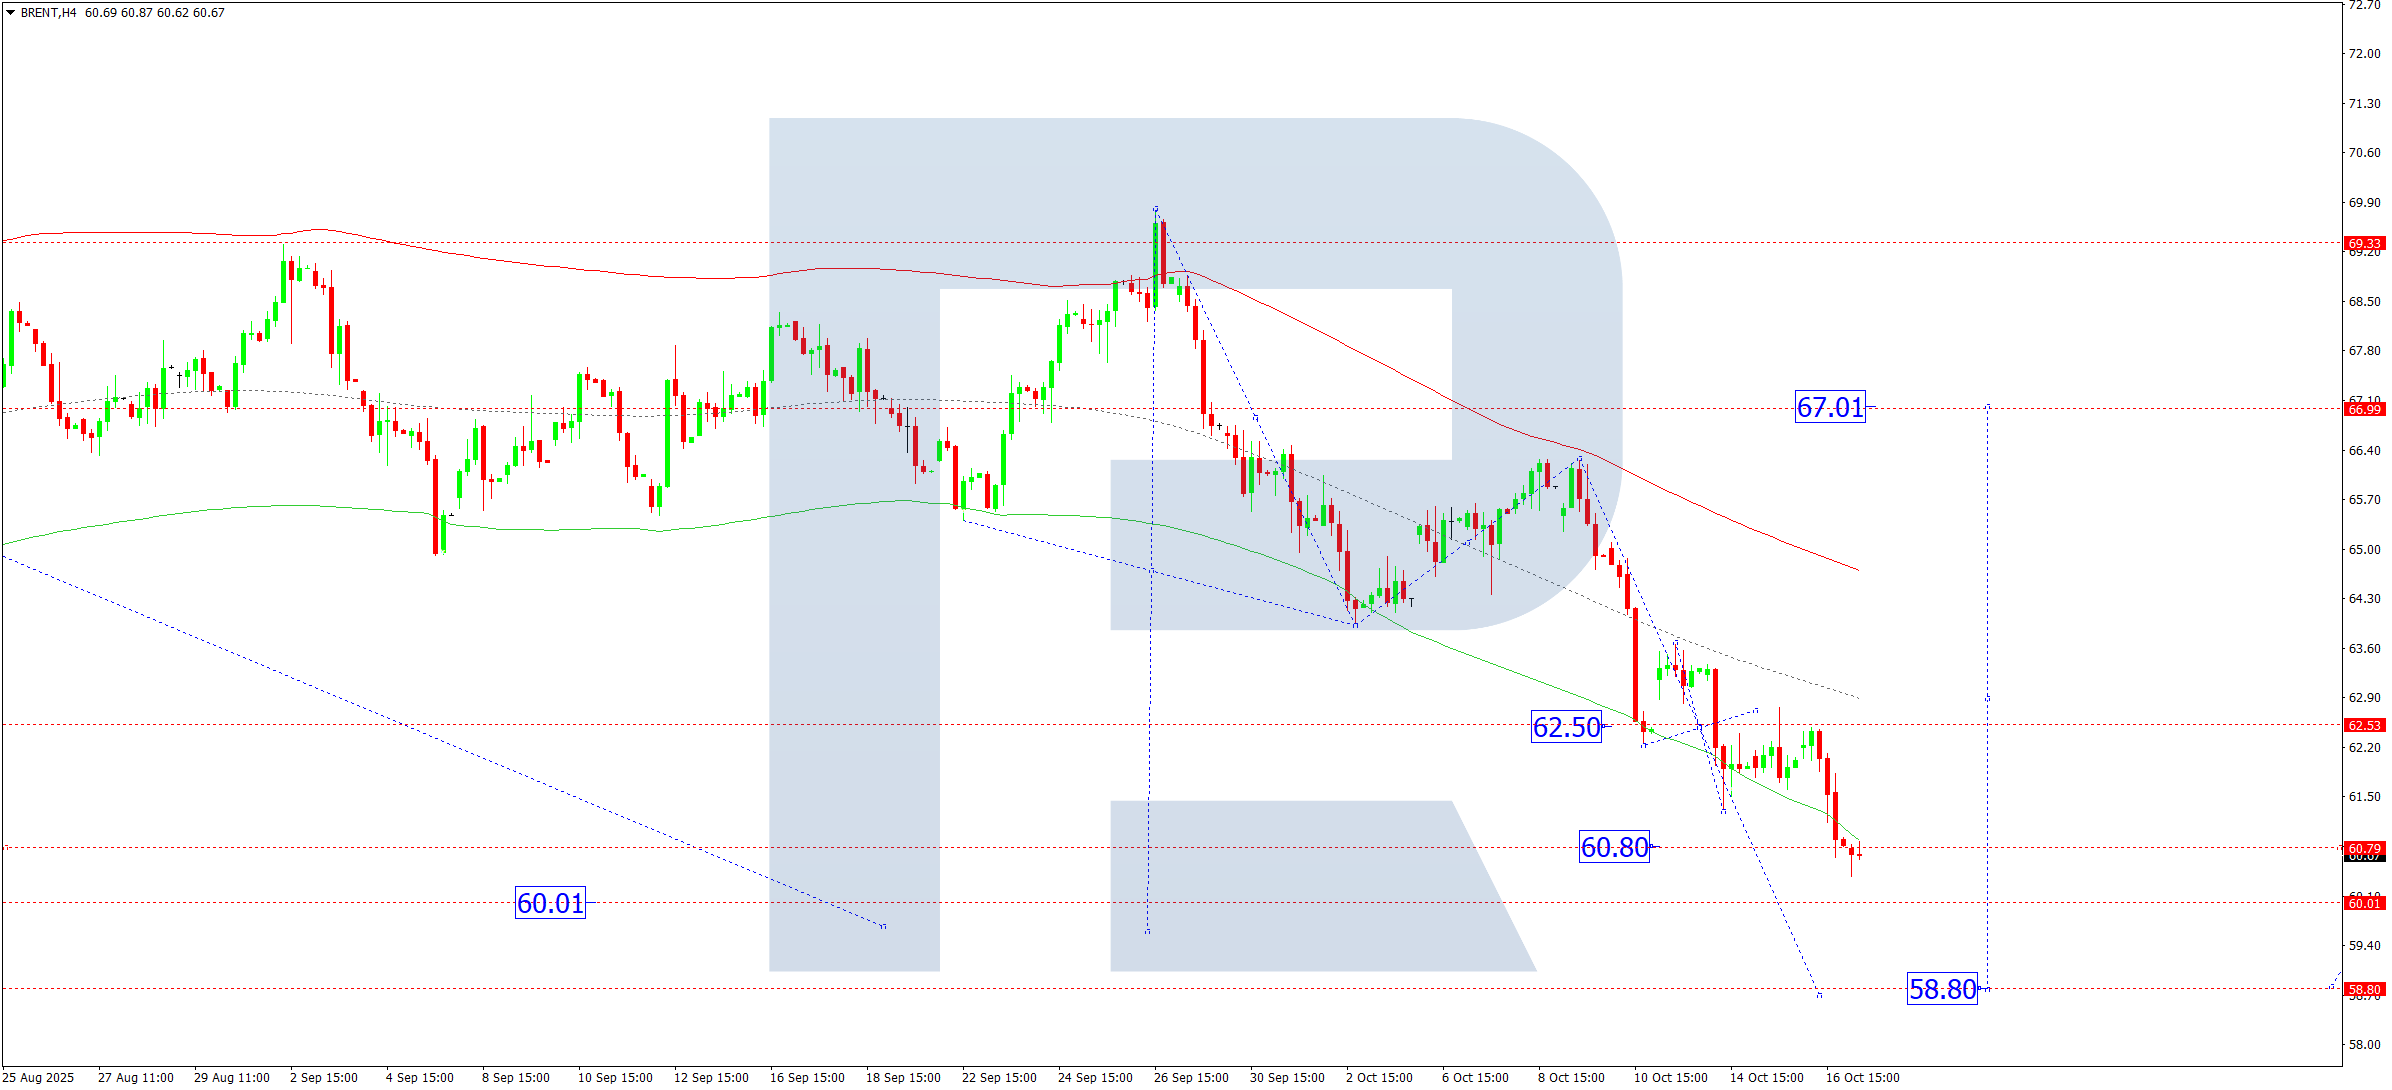
On the H4 chart of Brent crude, a decline to 60.80 was completed, and a consolidation range is forming around this level on 17 October 2025. A downside breakout would open the potential for a fall towards 60.00, with possible extension to 58.80. Later, a rise towards 63.00 may begin, with scope to extend to 67.00.
Technically, this scenario is backed by the Elliott Wave structure and the bearish wave matrix with a pivot point at 63.63, the key level for Brent in this wave. The market reached the lower boundary of the Price Envelope at 60.80. A correction towards the upper boundary at 63.00 is likely to be considered next, followed by a move back towards the lower boundary at 60.00.
Technical indicators for today’s Brent forecast suggest a potential decline towards 60.00.
Forecasts presented in this section only reflect the author’s private opinion and should not be considered as guidance for trading. RoboForex bears no responsibility for trading results based on trading recommendations described in these analytical reviews.