Daily technical analysis and forecast for 15 October 2025
Here is a detailed daily technical analysis and forecast for EURUSD, USDJPY, GBPUSD, AUDUSD, USDCAD, XAUUSD and Brent for 15 October 2025.
EURUSD forecast
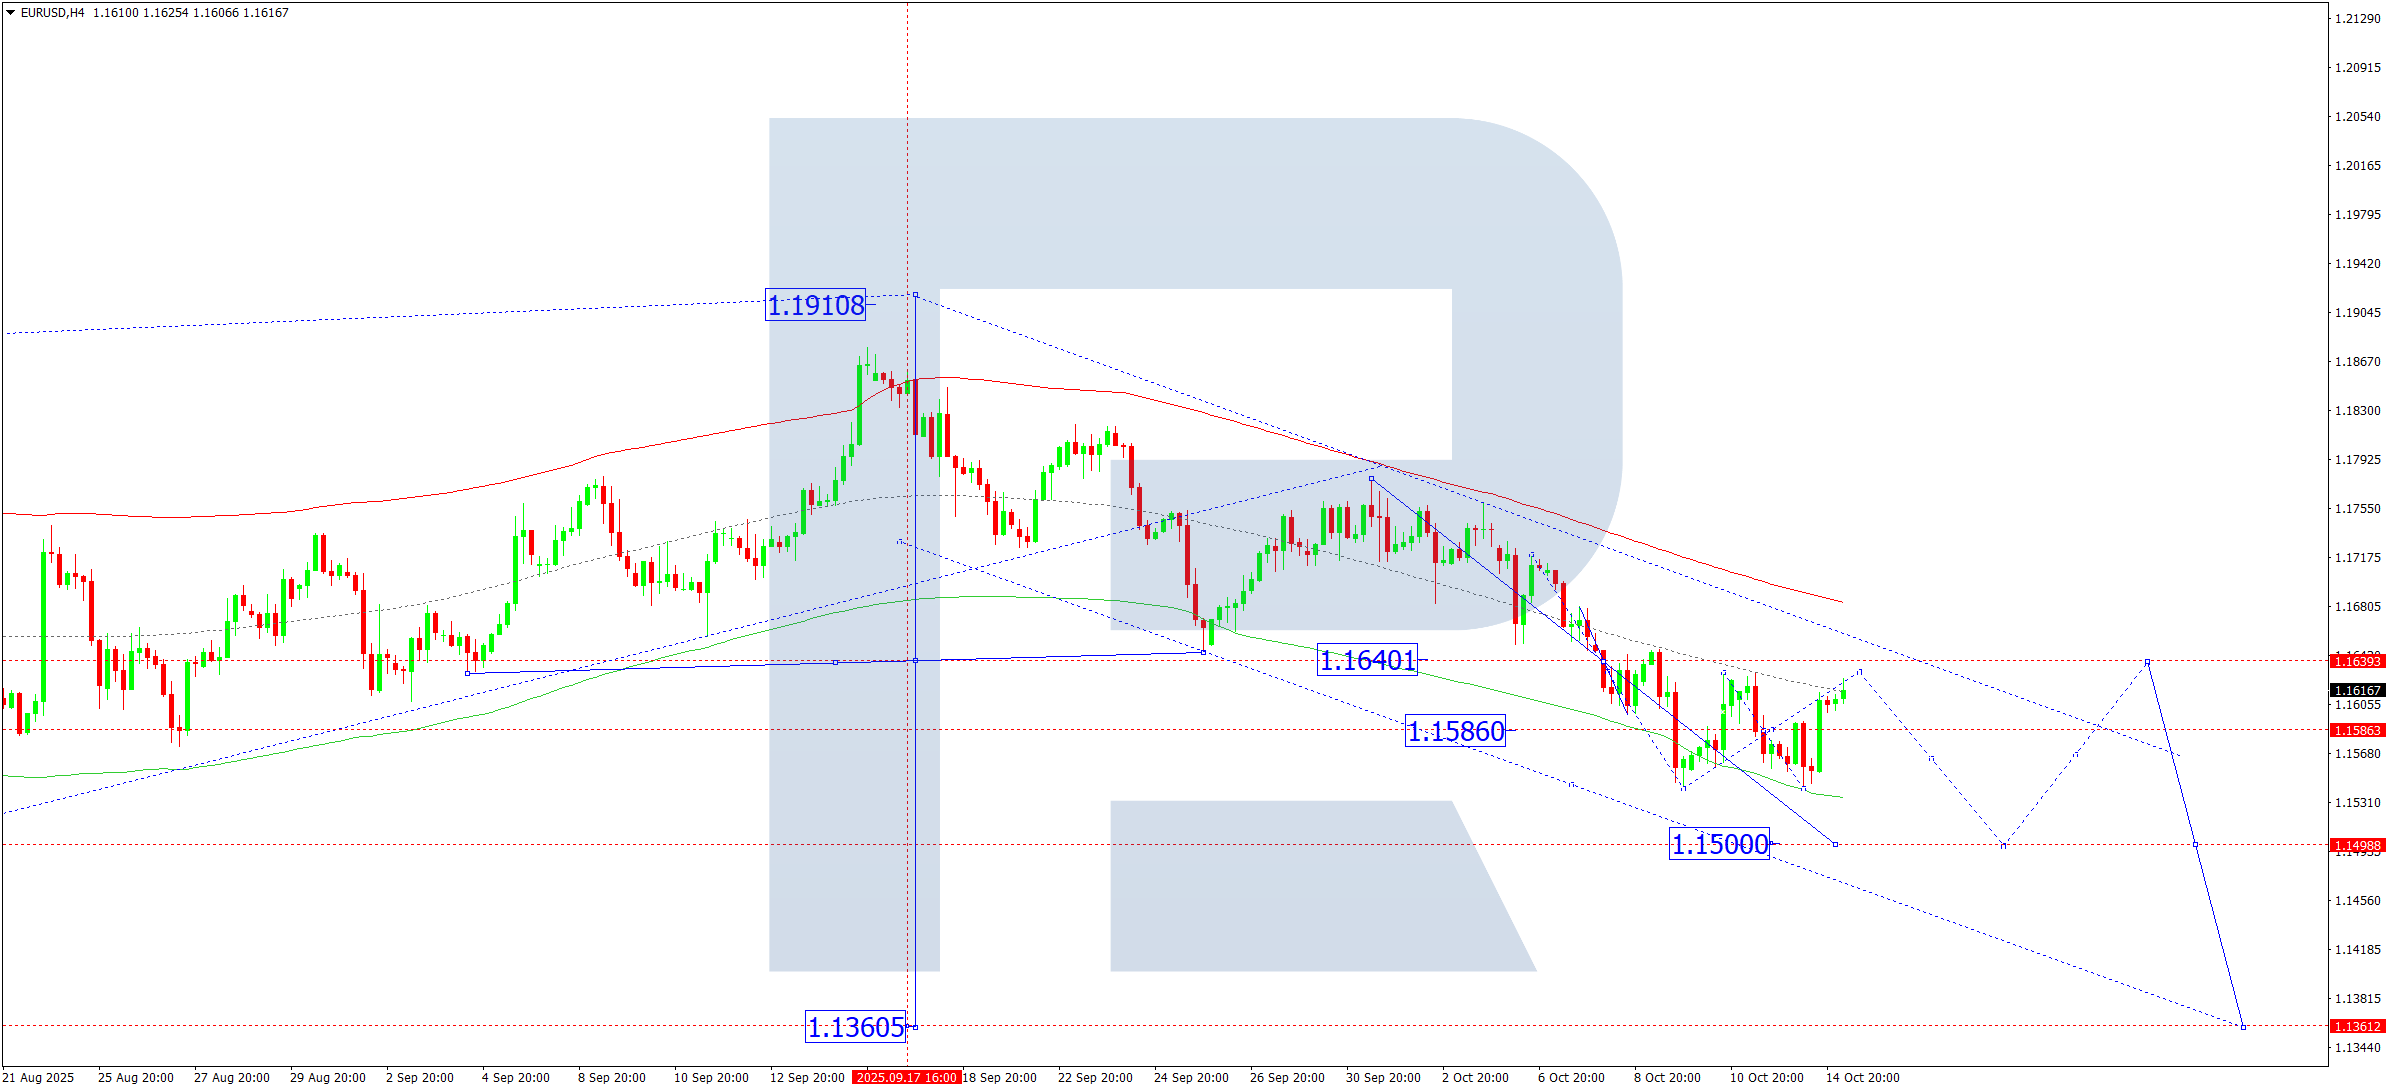
On the H4 chart of EURUSD, a broad consolidation range is forming around 1.1586. On 15 October 2025, a rise towards 1.1630 is expected, followed by a decline to 1.1586. A downside breakout from this range would open the potential for a move to 1.1500 at a minimum. If the range breaks upwards, a corrective leg towards 1.1640 cannot be ruled out.
Technically, this scenario is confirmed by the Elliott Wave structure and the bearish wave matrix with a pivot point at 1.1640, considered the key level in EURUSD’s wave structure. A decline towards the lower boundary of the Price Envelope at 1.1500 is anticipated, with potential trend continuation to 1.1466.
Technical indicators for today’s EURUSD forecast suggest a downside wave towards at least 1.1500.
USDJPY forecast
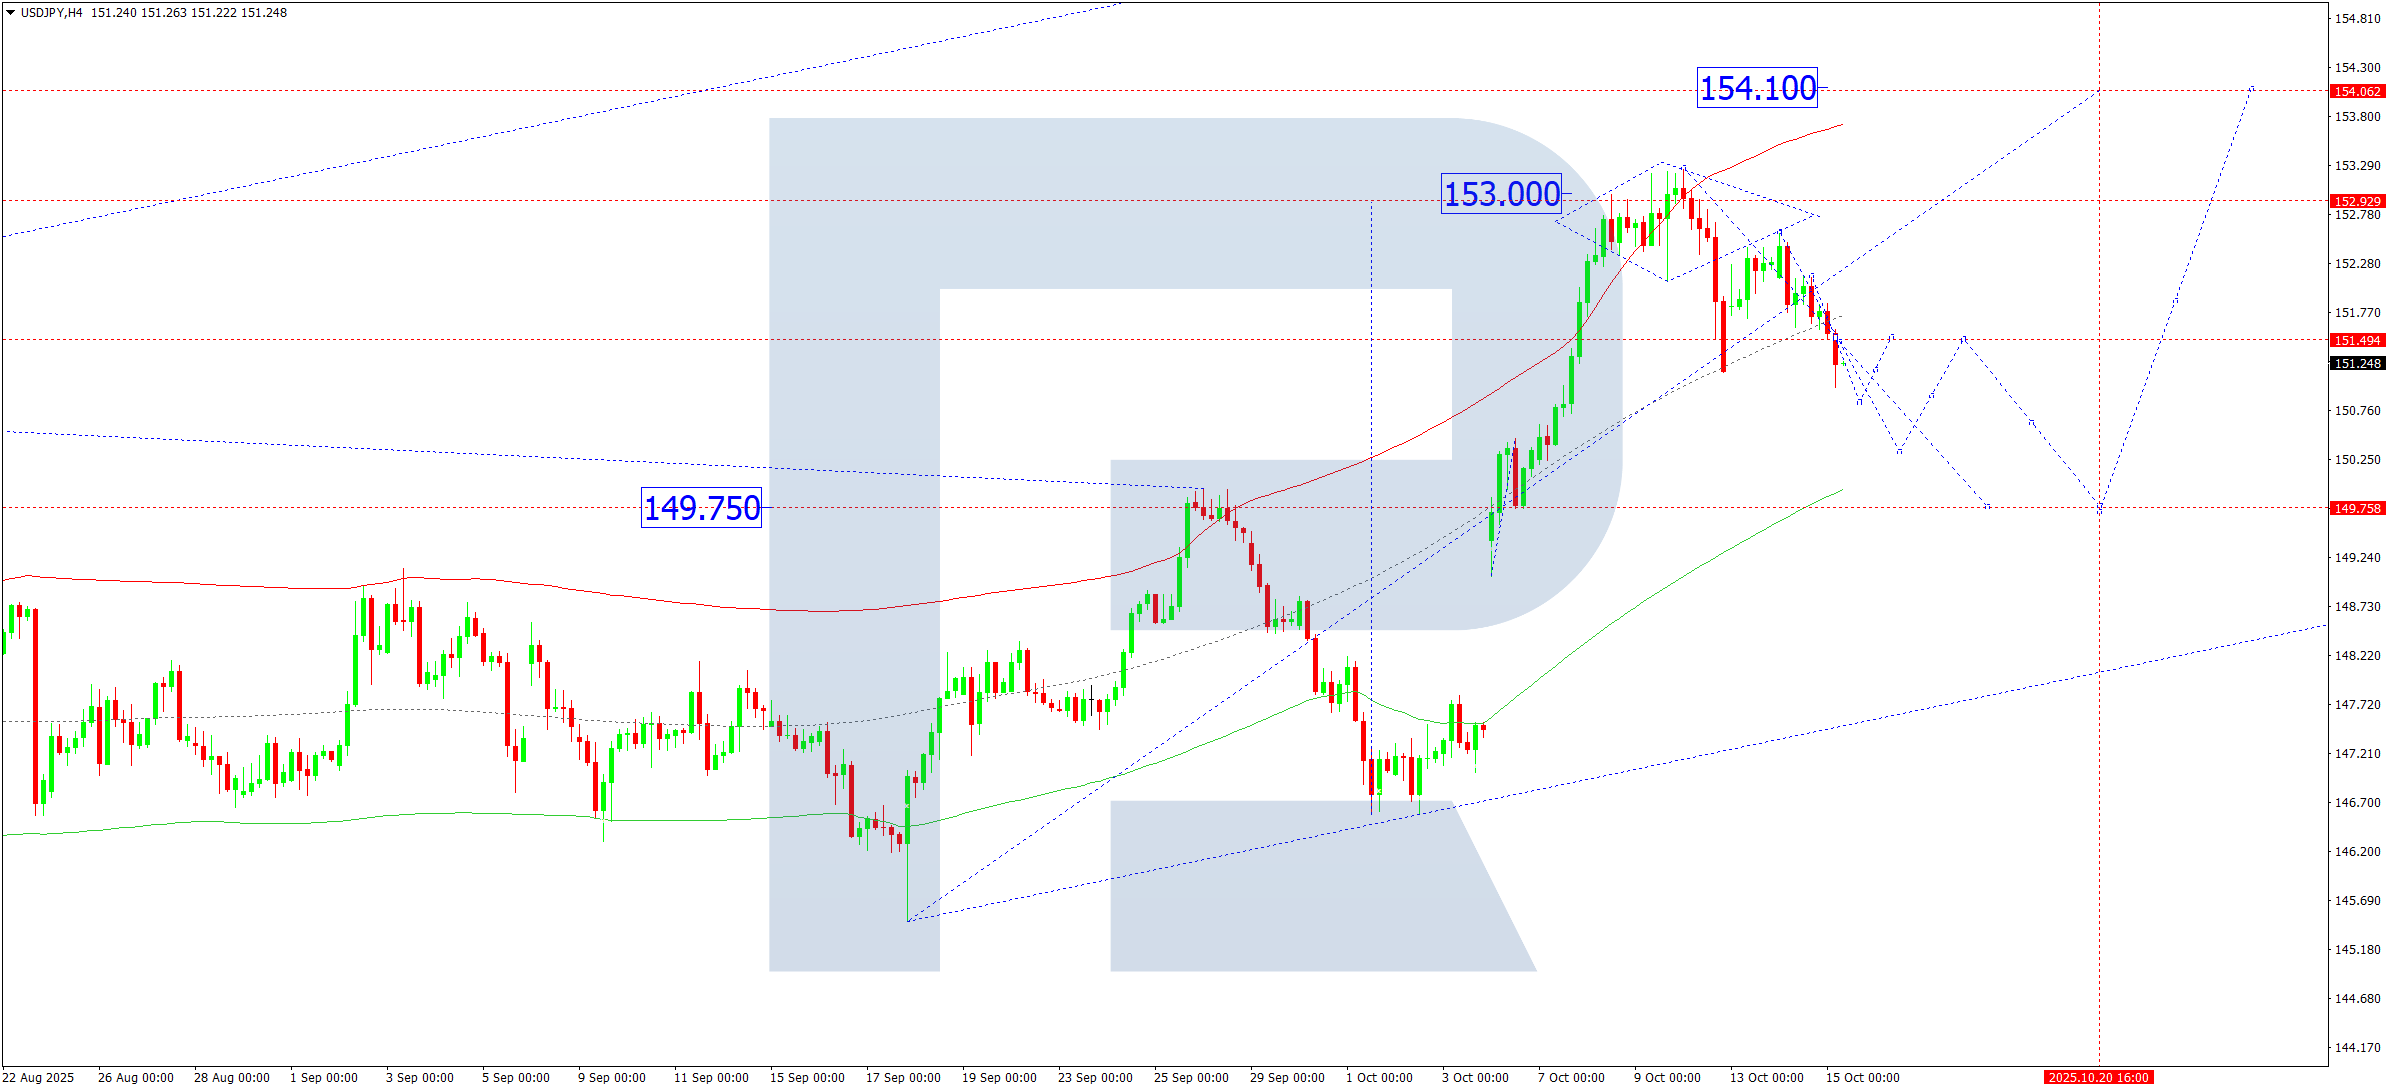
On the H4 chart of USDJPY, the market broke below 151.50, opening the potential for a correction towards 150.33. On 15 October 2025, a dip to 150.87 is expected, followed by a rebound to 151.50 (testing from below). After that, the pair could decline towards 150.33, a local target within the corrective wave.
Technically, the scenario is backed by the Elliott Wave structure and the bullish wave matrix with a pivot point at 149.75, the key level for this wave. The correction is developing towards the lower boundary of the Price Envelope at 150.33, with scope to extend the correction to 149.75.
Technical indicators for today’s USDJPY forecast suggest a continued correction towards 150.87 and 150.33.
GBPUSD forecast
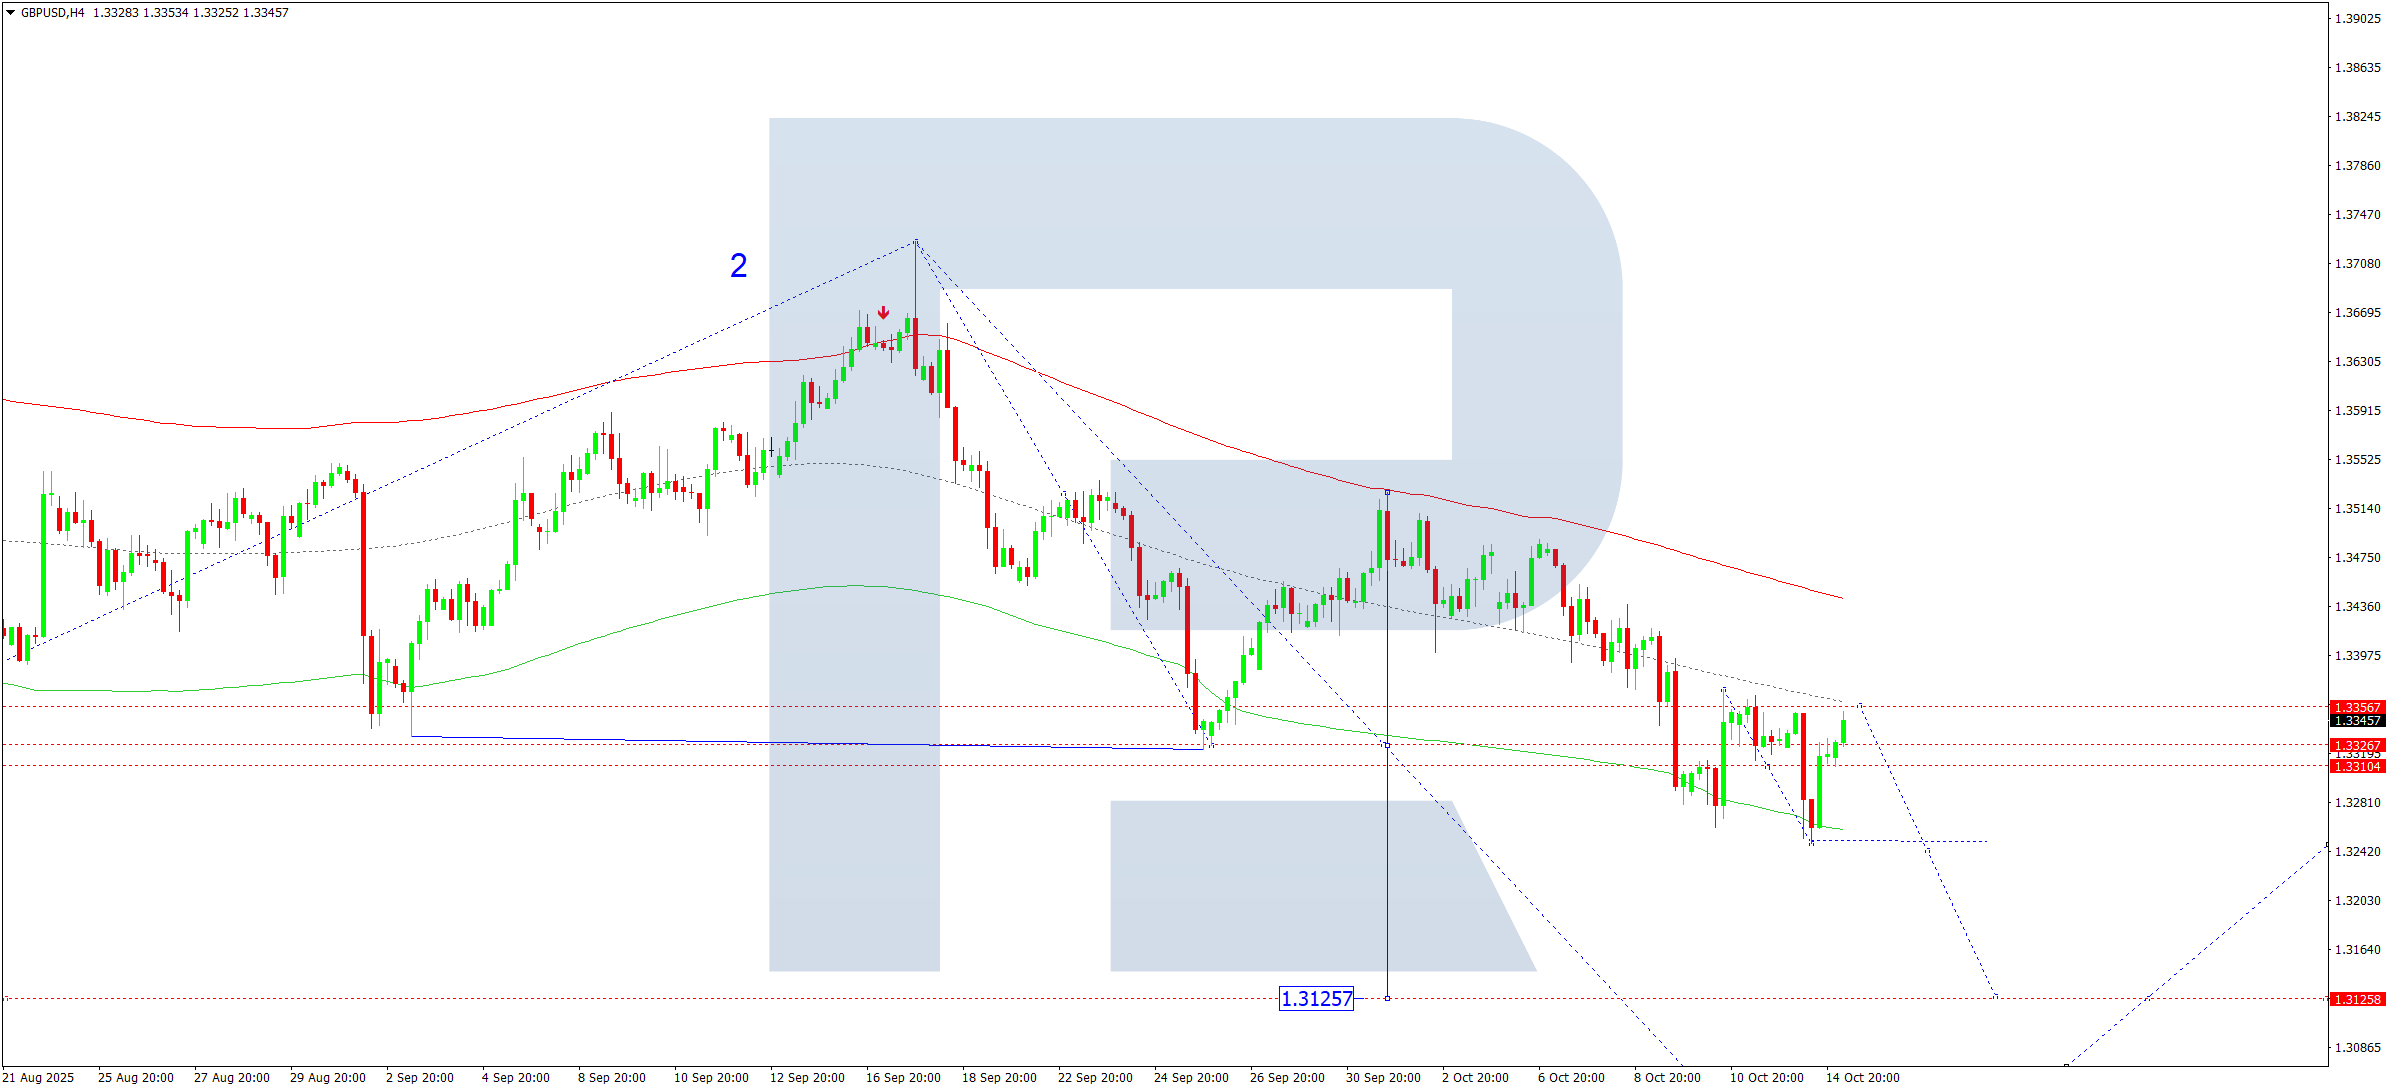
On the H4 chart of GBPUSD, a consolidation range formed around 1.3310, which could expand upwards to 1.3316 on 15 October 2025. Afterwards, a new downward wave is anticipated towards 1.3230, with potential continuation to 1.3125.
Technically, the scenario is confirmed by the Elliott Wave structure and the bearish wave matrix with a pivot point at 1.3310, the key level for this wave. The range is taking shape below the central line of the Price Envelope. A new downward wave towards the lower boundary at 1.3230 is possible, with the potential for the trend to continue towards 1.3125.
Technical indicators for today’s GBPUSD forecast suggest a decline towards 1.3230 and 1.3125.
AUDUSD forecast
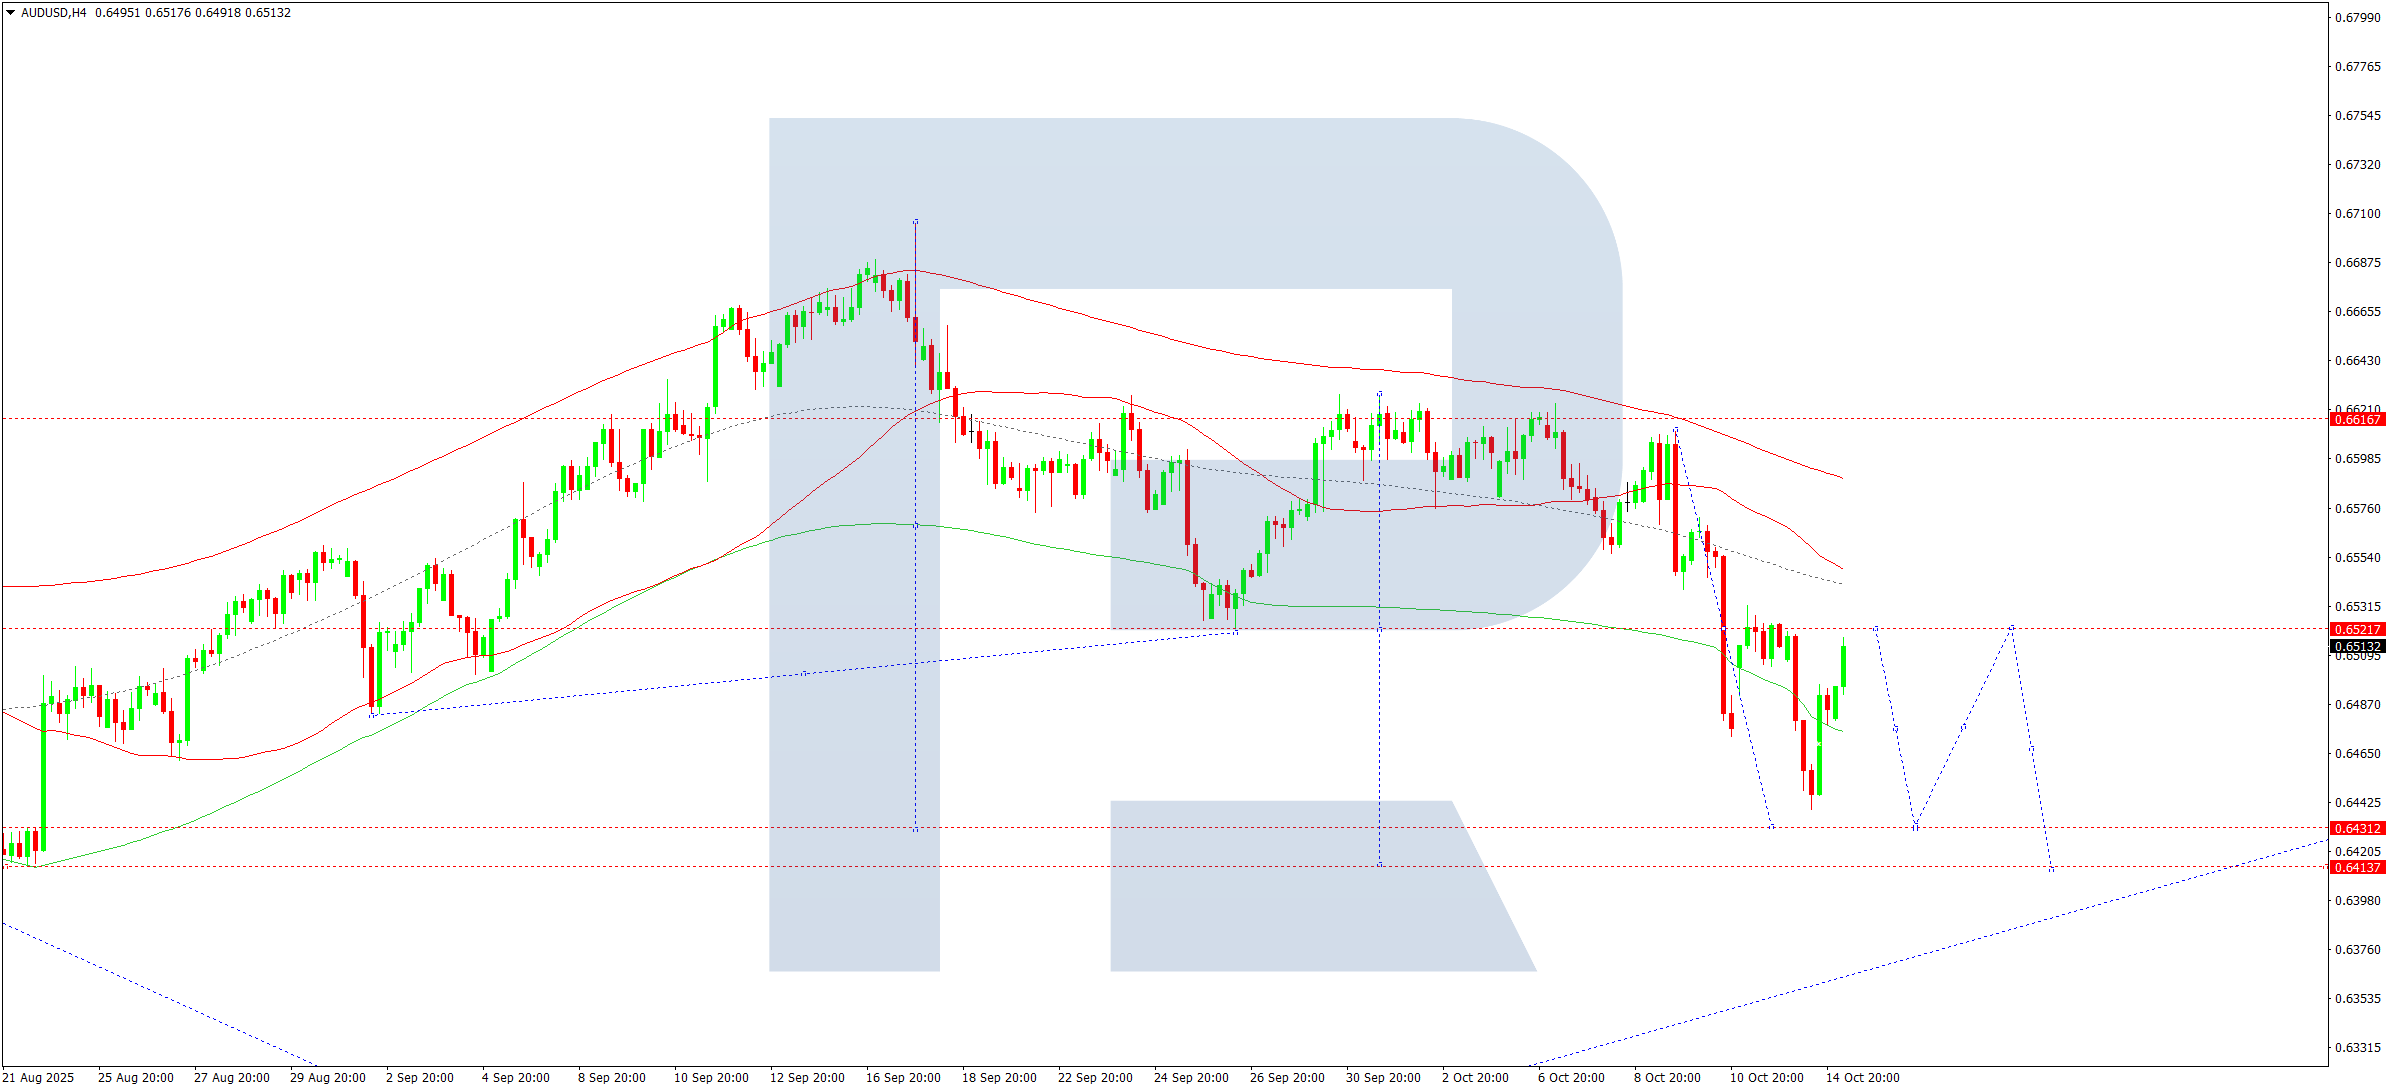
On the H4 chart of AUDUSD, the market continues to develop a downward wave towards 0.6414. On 15 October 2025, a corrective move to 0.6522 is expected, then continuation lower to reach the above target. Later, another corrective leg to 0.6520 is possible, followed by trend continuation to 0.6340 as the first target.
Technically, this view is supported by the Elliott Wave structure and the bearish wave matrix with a pivot point at 0.6525, the key level in this wave. The pair continues its downward momentum towards the lower boundary of the Price Envelope at 0.6414. A corrective bounce to 0.6520 cannot be ruled out today, followed by a decline towards the lower boundary at 0.6340.
Technical indicators for today’s AUDUSD forecast suggest a potential move down towards 0.6416.
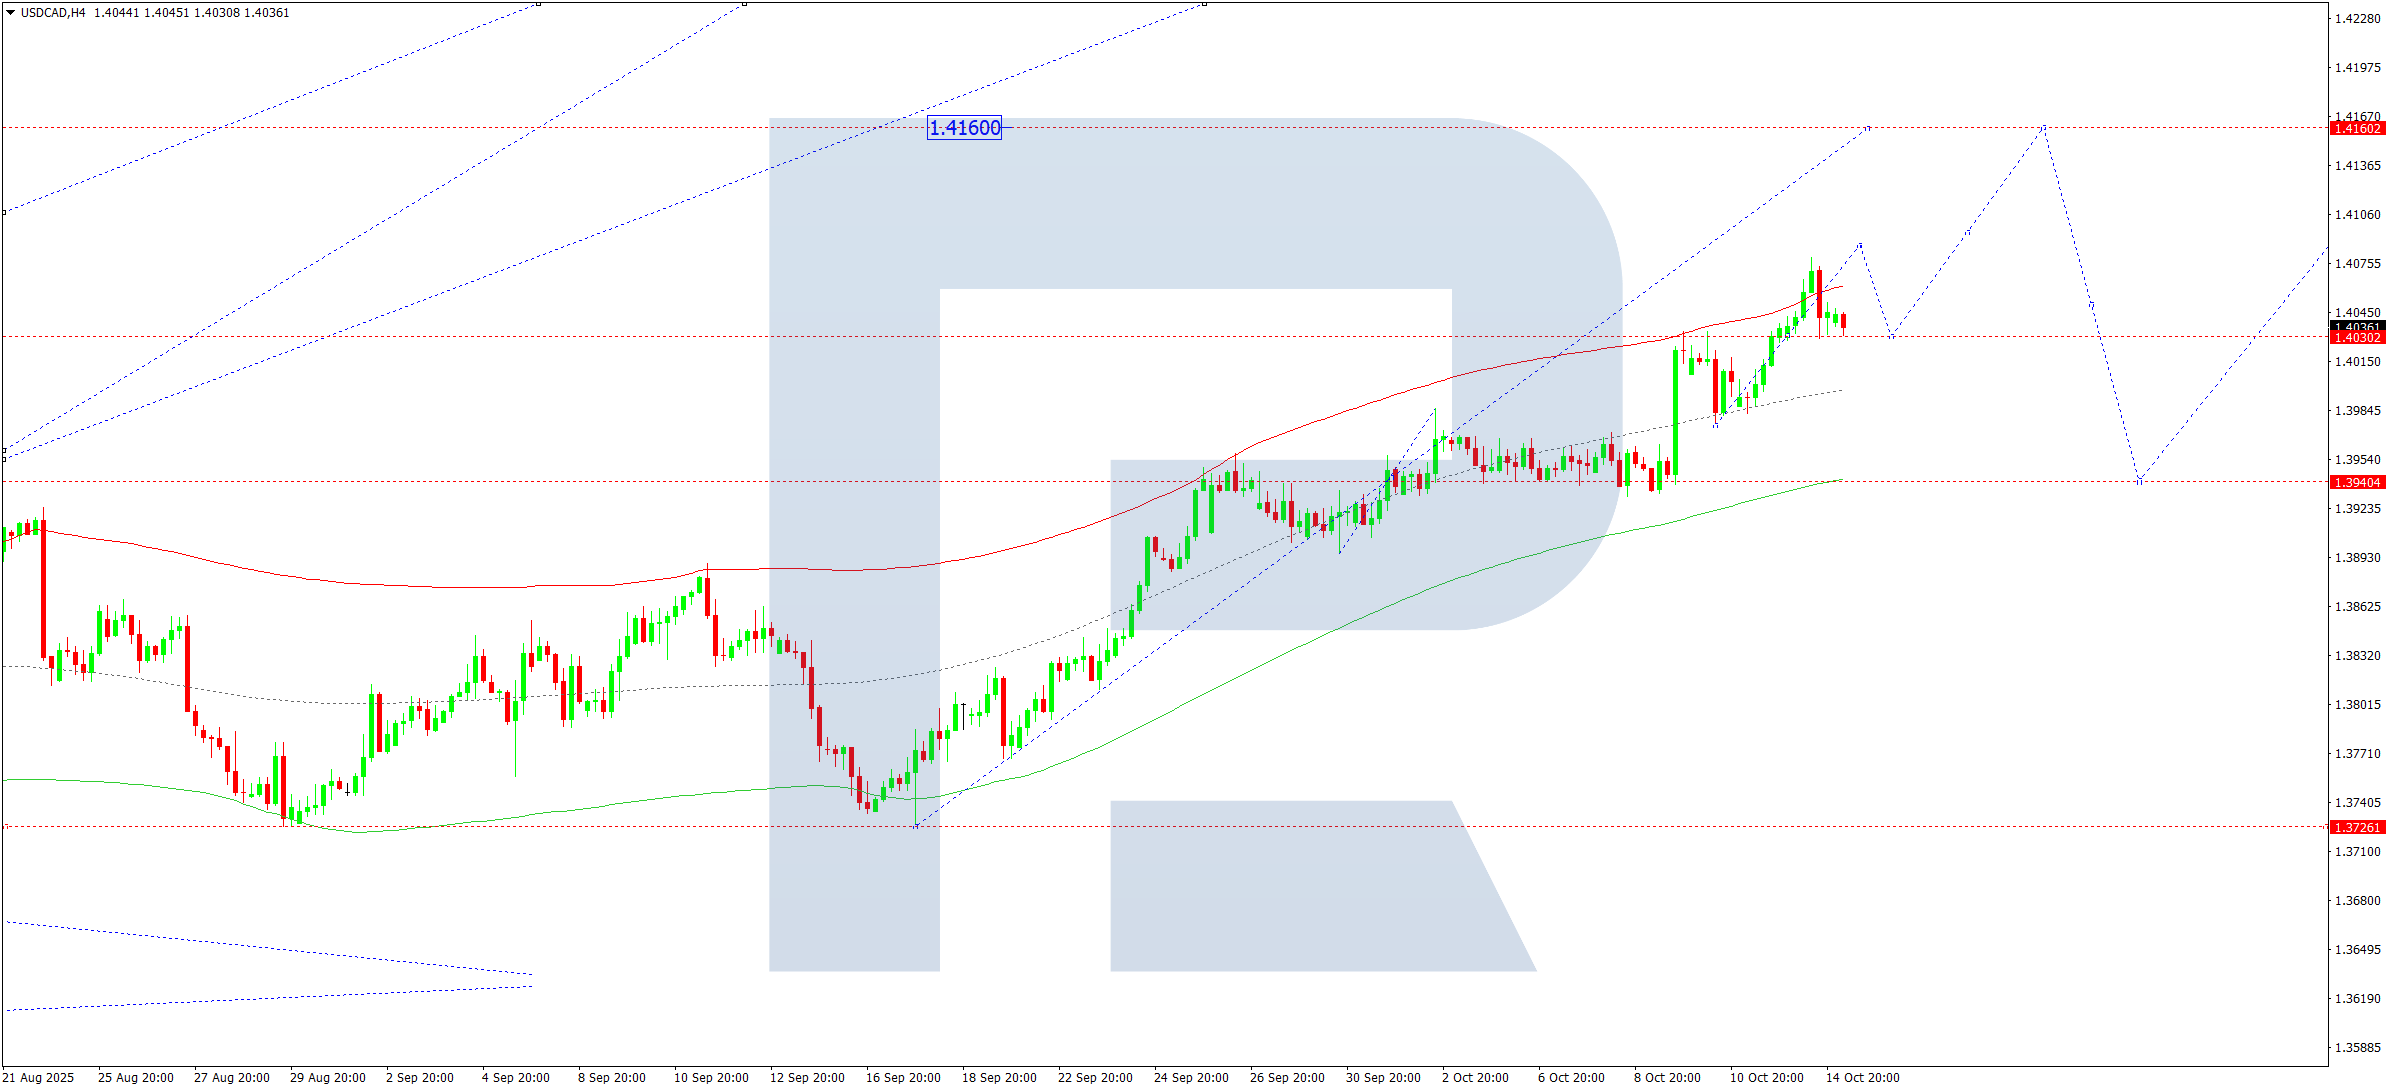
USDCAD forecast
On the H4 chart of USDCAD, consolidation continues around 1.4030. On 15 October 2025, a downside breakout from the range would point to a correction towards 1.3940. An upside breakout would open the potential for the third upward wave to 1.4160. After reaching that level, a correction to 1.3940 would be relevant.
Technically, the scenario is confirmed by the Elliott Wave structure and the bullish wave matrix with a pivot point at 1.3940, the key level for this wave. The market is currently forming an upward structure towards the upper boundary of the Price Envelope at 1.4160. Hitting this target could be followed by a pullback to the central line at 1.3940 (testing from above), then a rise up to 1.4330.
Technical indicators for today’s USDCAD forecast suggest continued growth towards 1.4080 and 1.4160.
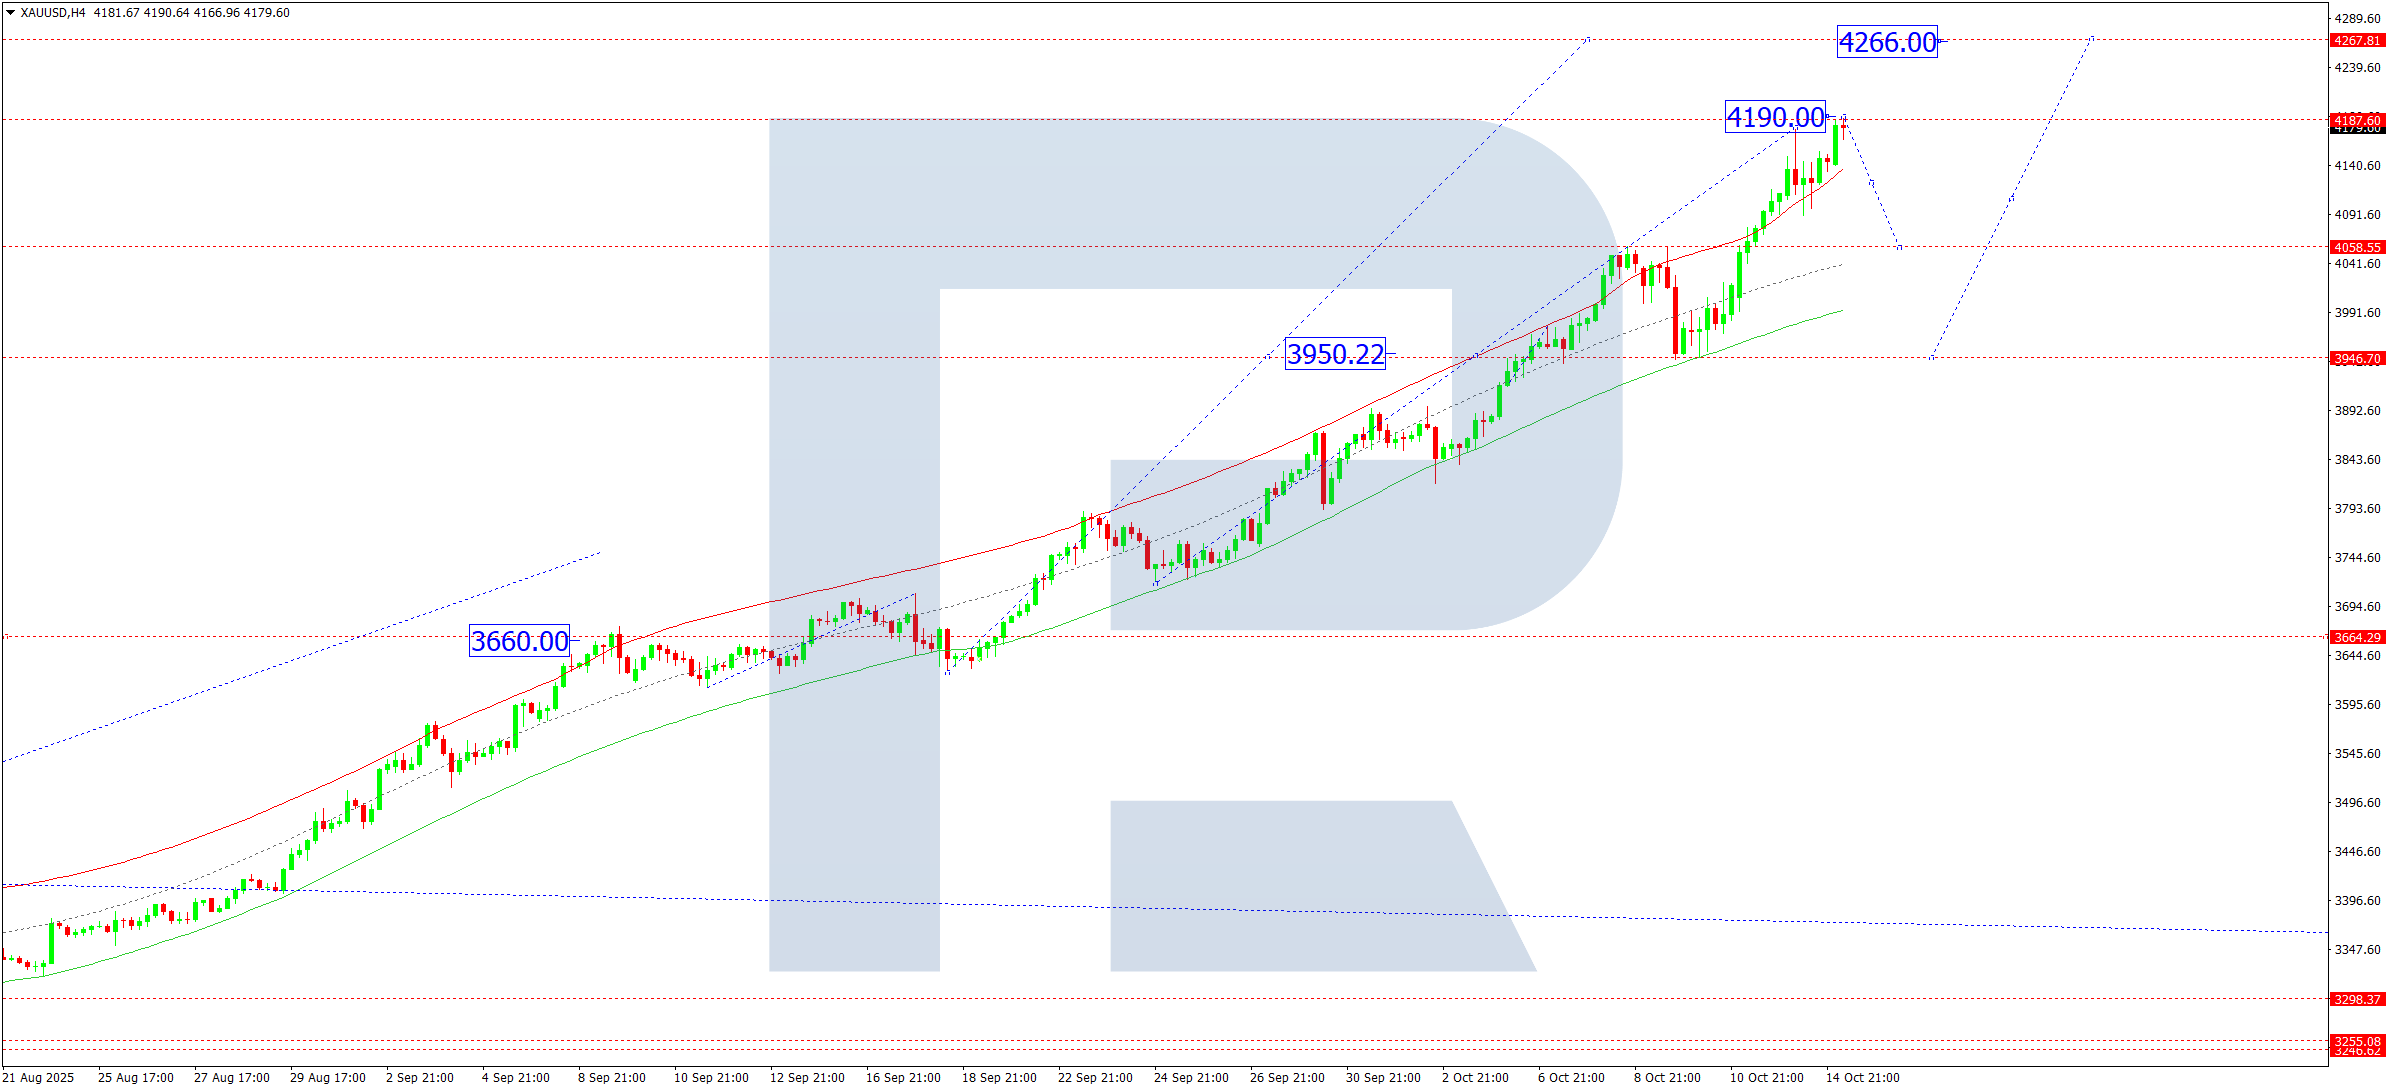
XAUUSD forecast
On the H4 chart of XAUUSD, an upward structure reached 4,190. On 15 October 2025, a corrective leg towards 4,060 cannot be ruled out. After this correction, a rise towards 4,266 is expected. A new consolidation range may form around 4,060. A breakout to the upside would open the potential for a continuation to 4,266; a downside breakout could extend the correction to 3,950.
Technically, this scenario is supported by the Elliott Wave structure and the bullish wave matrix with a pivot point at 3,660, the key level for this wave. Prices are moving towards the upper boundary of the Price Envelope at 4,266, with a subsequent correction towards the lower boundary at 4,060 anticipated.
Technical indicators for today’s XAUUSD forecast point to continued growth towards 4,210 and 4,266.
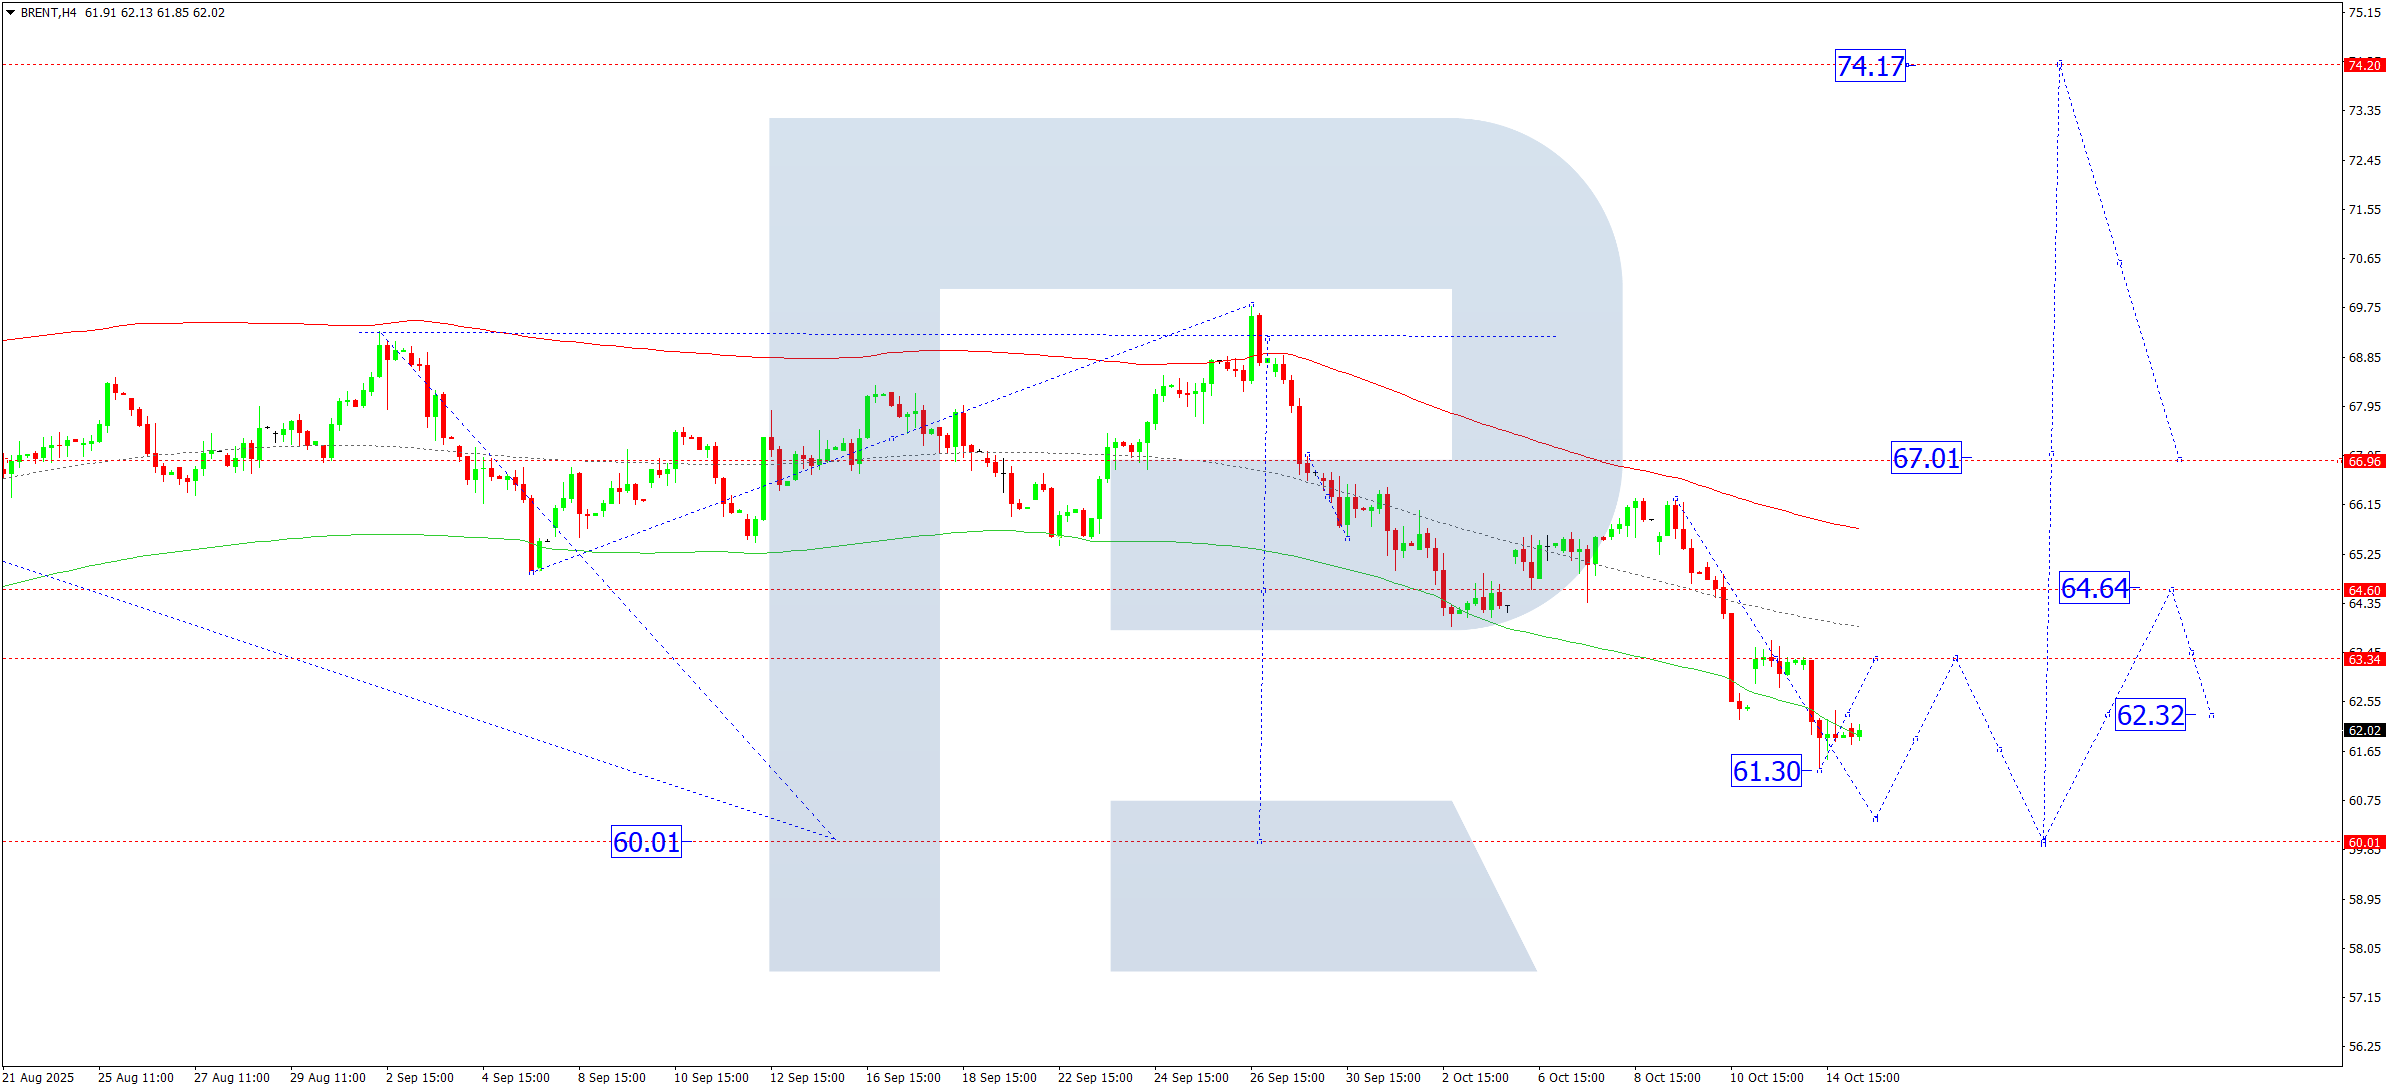
Brent forecast
On the H4 chart of Brent crude, a consolidation range is forming above 62.30. On 15 October 2025, a rise towards 63.30 (testing from below) is possible. A broader consolidation range is developing around 64.64. An upside breakout would open the potential for a move to 67.00; a downside breakout would suggest continuation of the trend to 61.61, with scope to extend towards 60.00.
Technically, this scenario is confirmed by the Elliott Wave structure and the bearish wave matrix with a pivot point at 64.64, the key level in Brent’s current wave. The market completed a move to the lower boundary of the Price Envelope at 62.30. A correction towards the upper boundary at 64.64 is possible, followed by a continuation towards the lower boundary at 61.61.
Technical indicators for today’s Brent forecast suggest a correction towards 63.30 and the start of a decline towards 61.61.
Forecasts presented in this section only reflect the author’s private opinion and should not be considered as guidance for trading. RoboForex bears no responsibility for trading results based on trading recommendations described in these analytical reviews.