Daily technical analysis and forecast for 13 October 2025
Here is a detailed daily technical analysis and forecast for EURUSD, USDJPY, GBPUSD, AUDUSD, USDCAD, XAUUSD and Brent for 13 October 2025.
EURUSD forecast
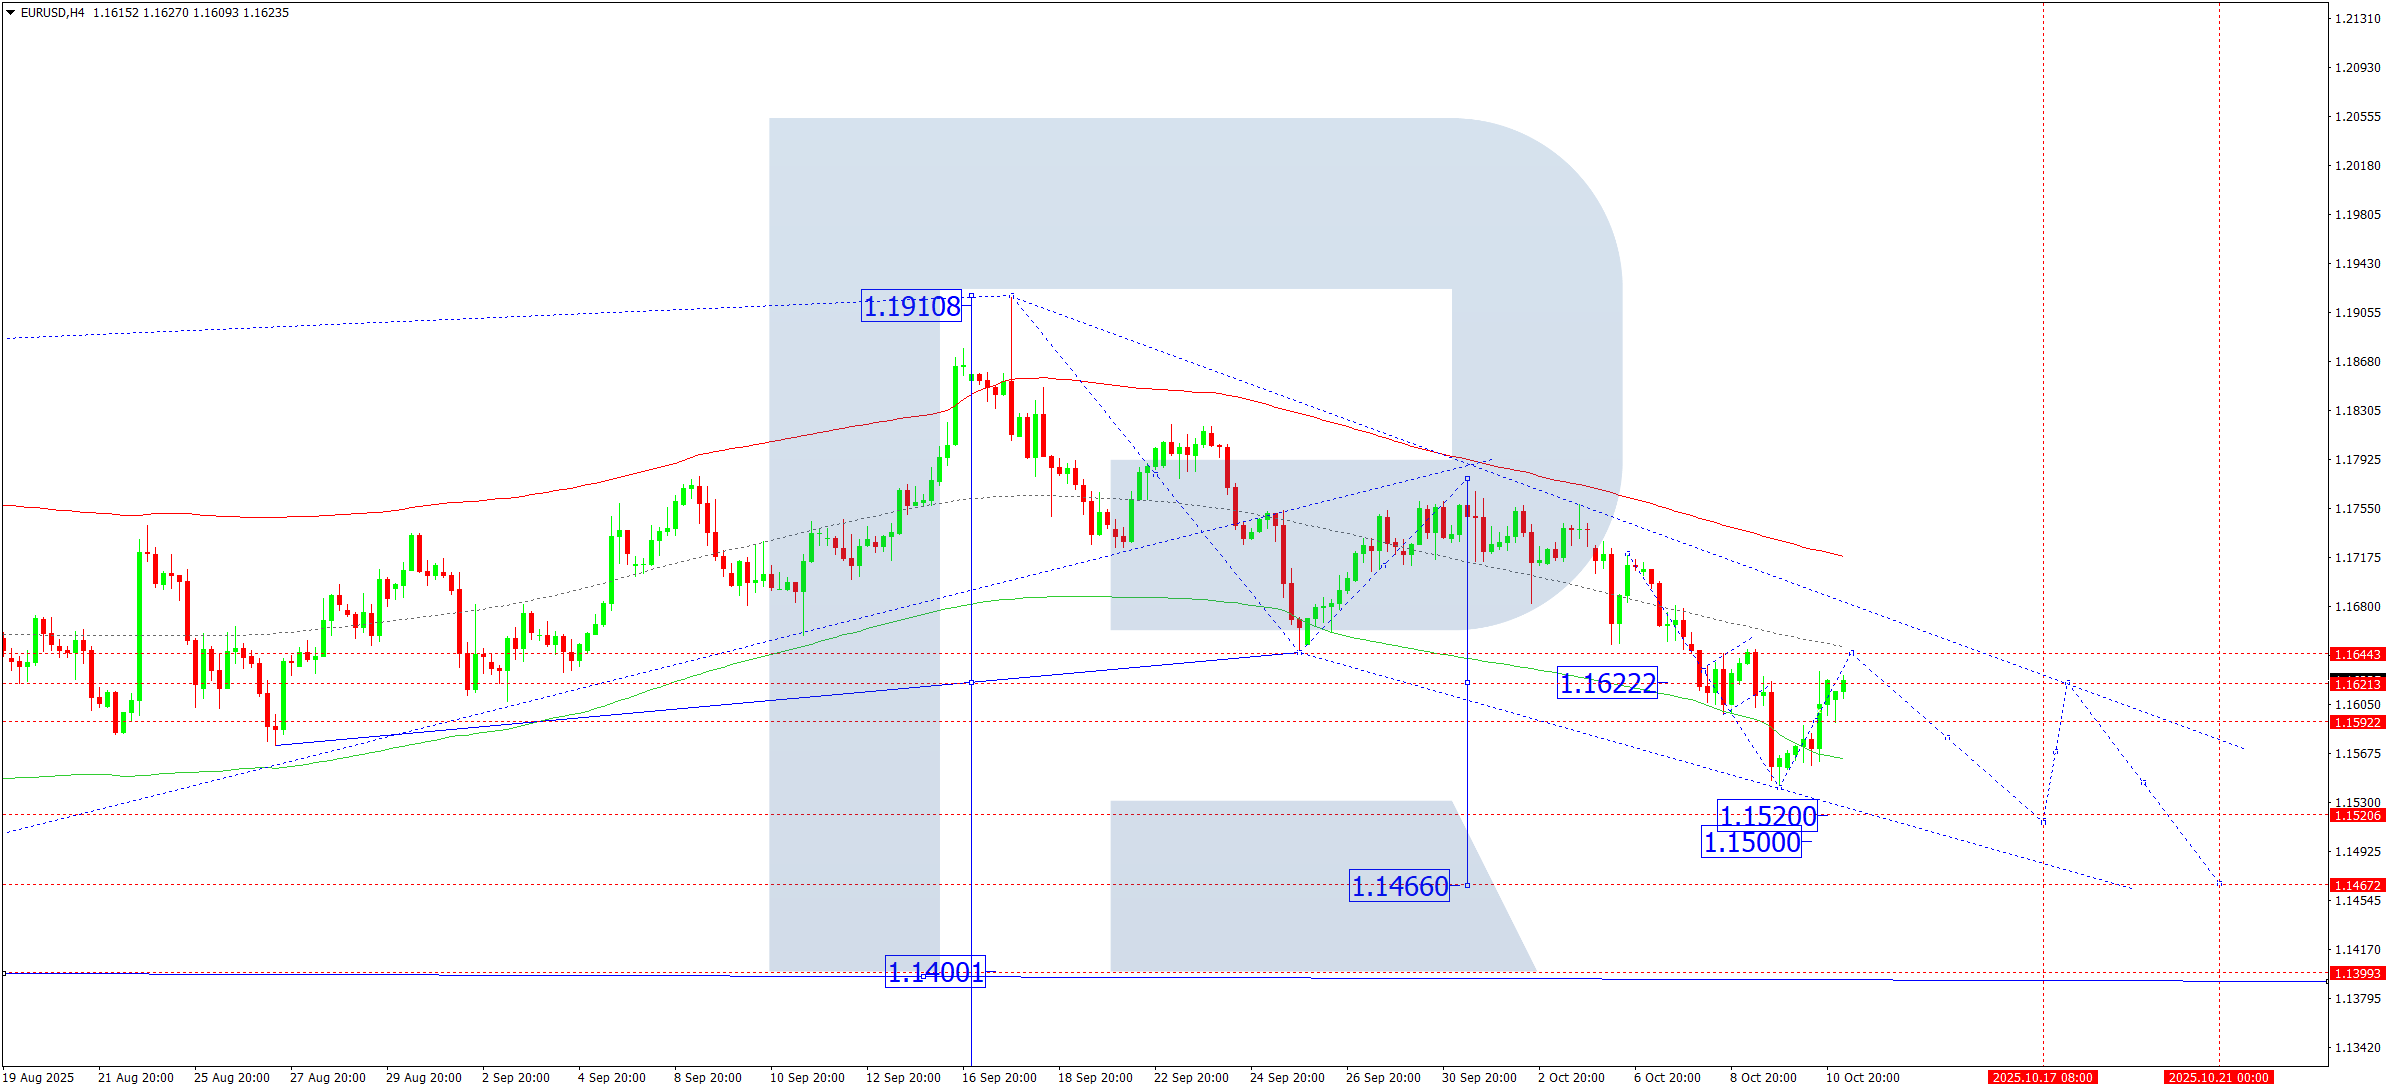
On the H4 chart of EURUSD, a decline to 1.1542 has been completed. A consolidation range has formed around 1.1592, which is expected to expand towards 1.1644 on 13 October 2025 as part of a correction. Afterwards, a downward wave is anticipated to continue towards 1.1520, with potential extensions to 1.1500 and 1.1466 as a local target.
Technically, this scenario is supported by the cited Elliott Wave structure and the bearish wave matrix with a pivot point at 1.1622, viewed as the key level in EURUSD’s wave structure. A move towards the lower boundary of the Price Envelope at 1.1520 is expected, with scope for the trend to continue towards 1.1466.
Technical indicators for today’s EURUSD forecast suggest a decline towards at least 1.1520.
USDJPY forecast
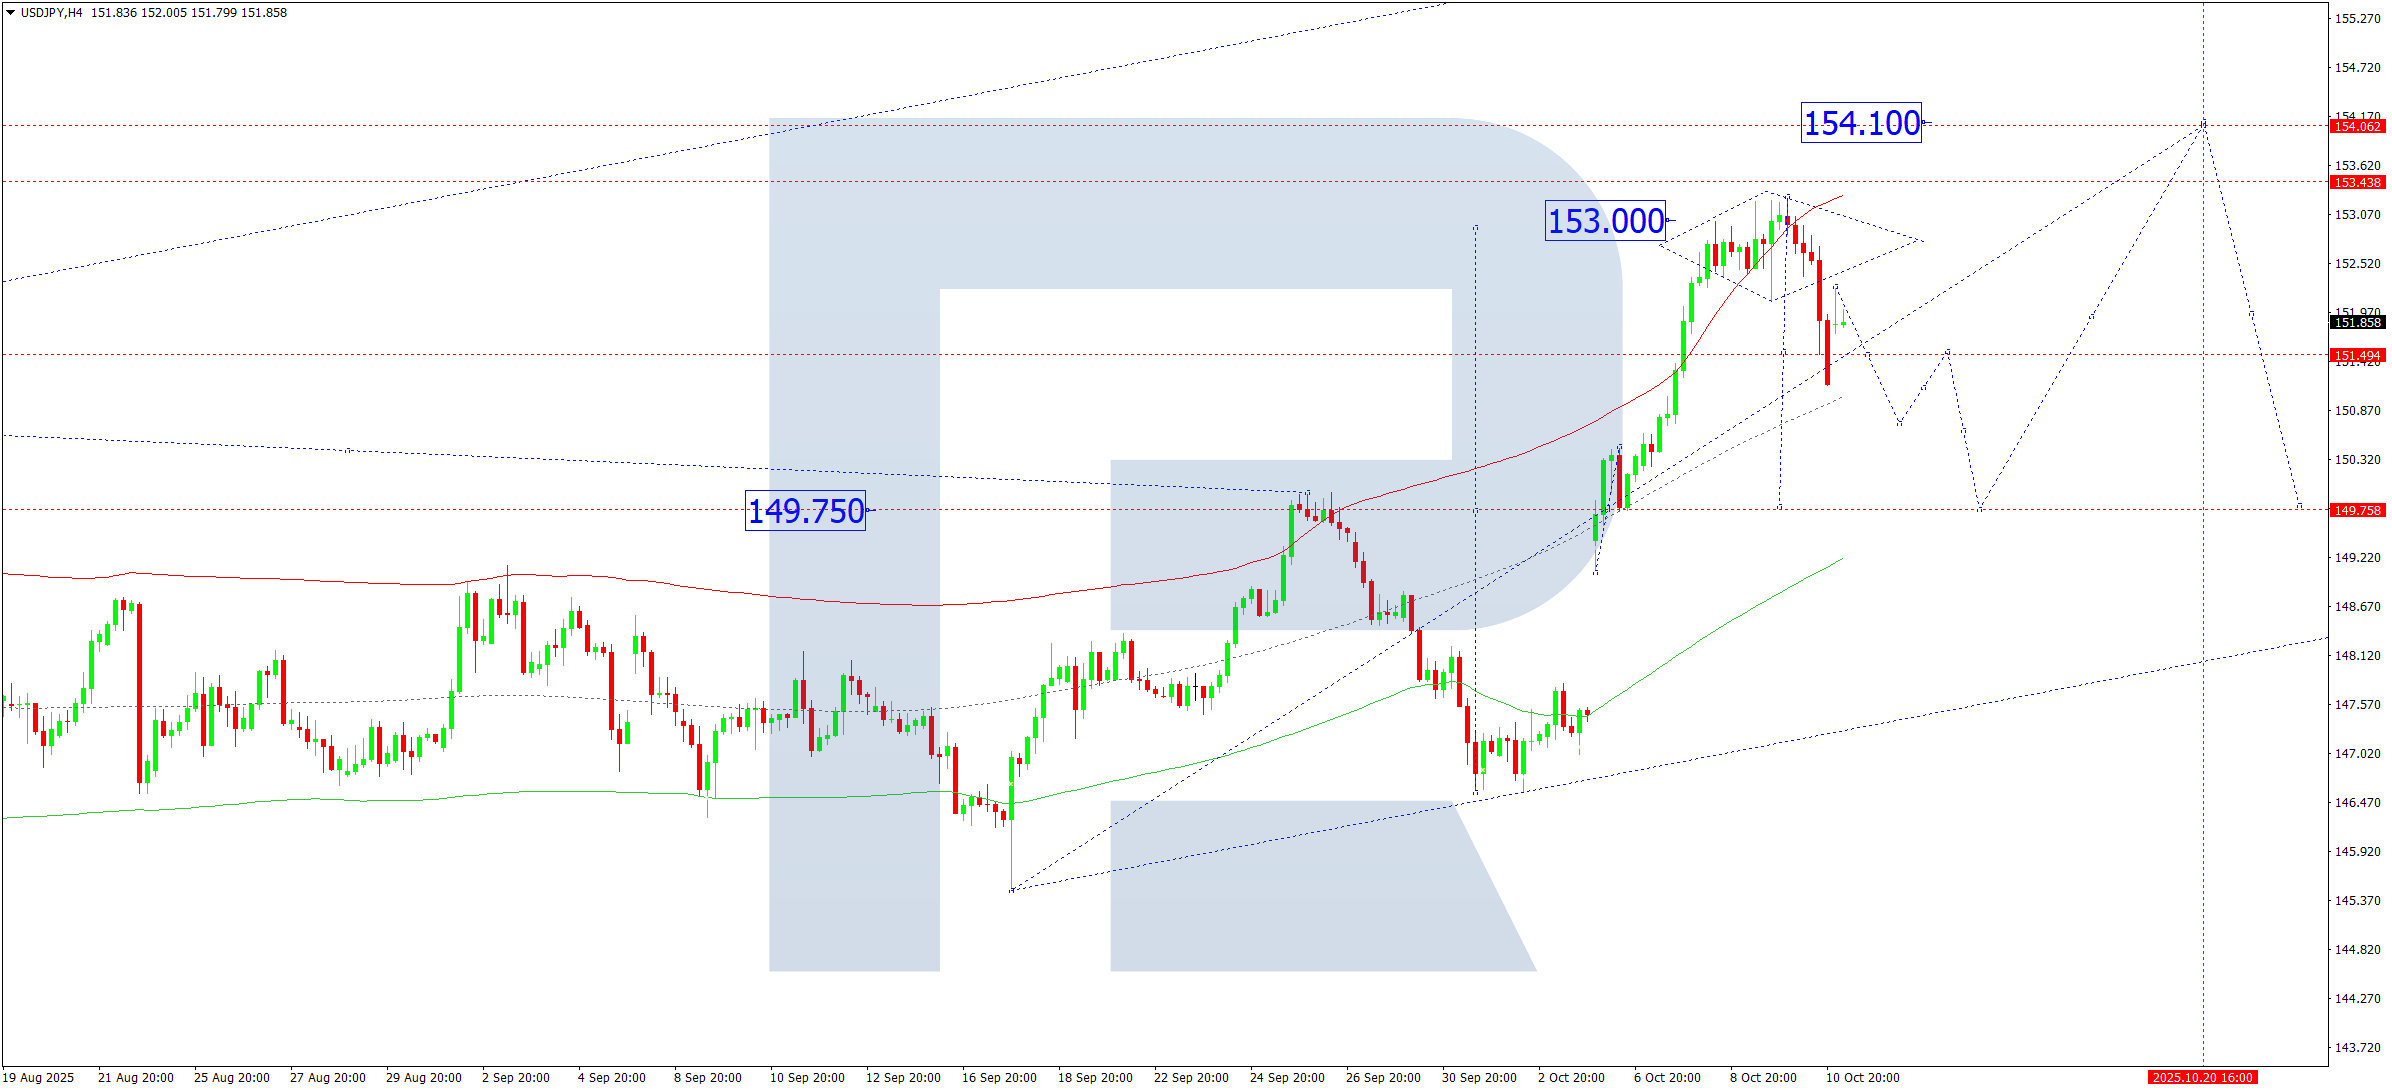
On the H4 chart of USDJPY, a corrective wave to 151.15 and a rise to 152.26 have been completed. On 13 October 2025, one more corrective leg towards 150.70 is expected, with potential continuation to 149.76 (testing from above). After this correction ends, a new upward wave towards 154.10 is anticipated.
Technically, this scenario is confirmed by the Elliott Wave structure and the bullish wave matrix with a pivot point at 149.76, the key level for this wave. At the moment, the market is extending the correction towards the central line of the Price Envelope at 150.70, with room to continue to its lower boundary at 149.76.
Technical indicators for today’s USDJPY forecast suggest a continued correction towards 150.70 and 149.76.
GBPUSD forecast
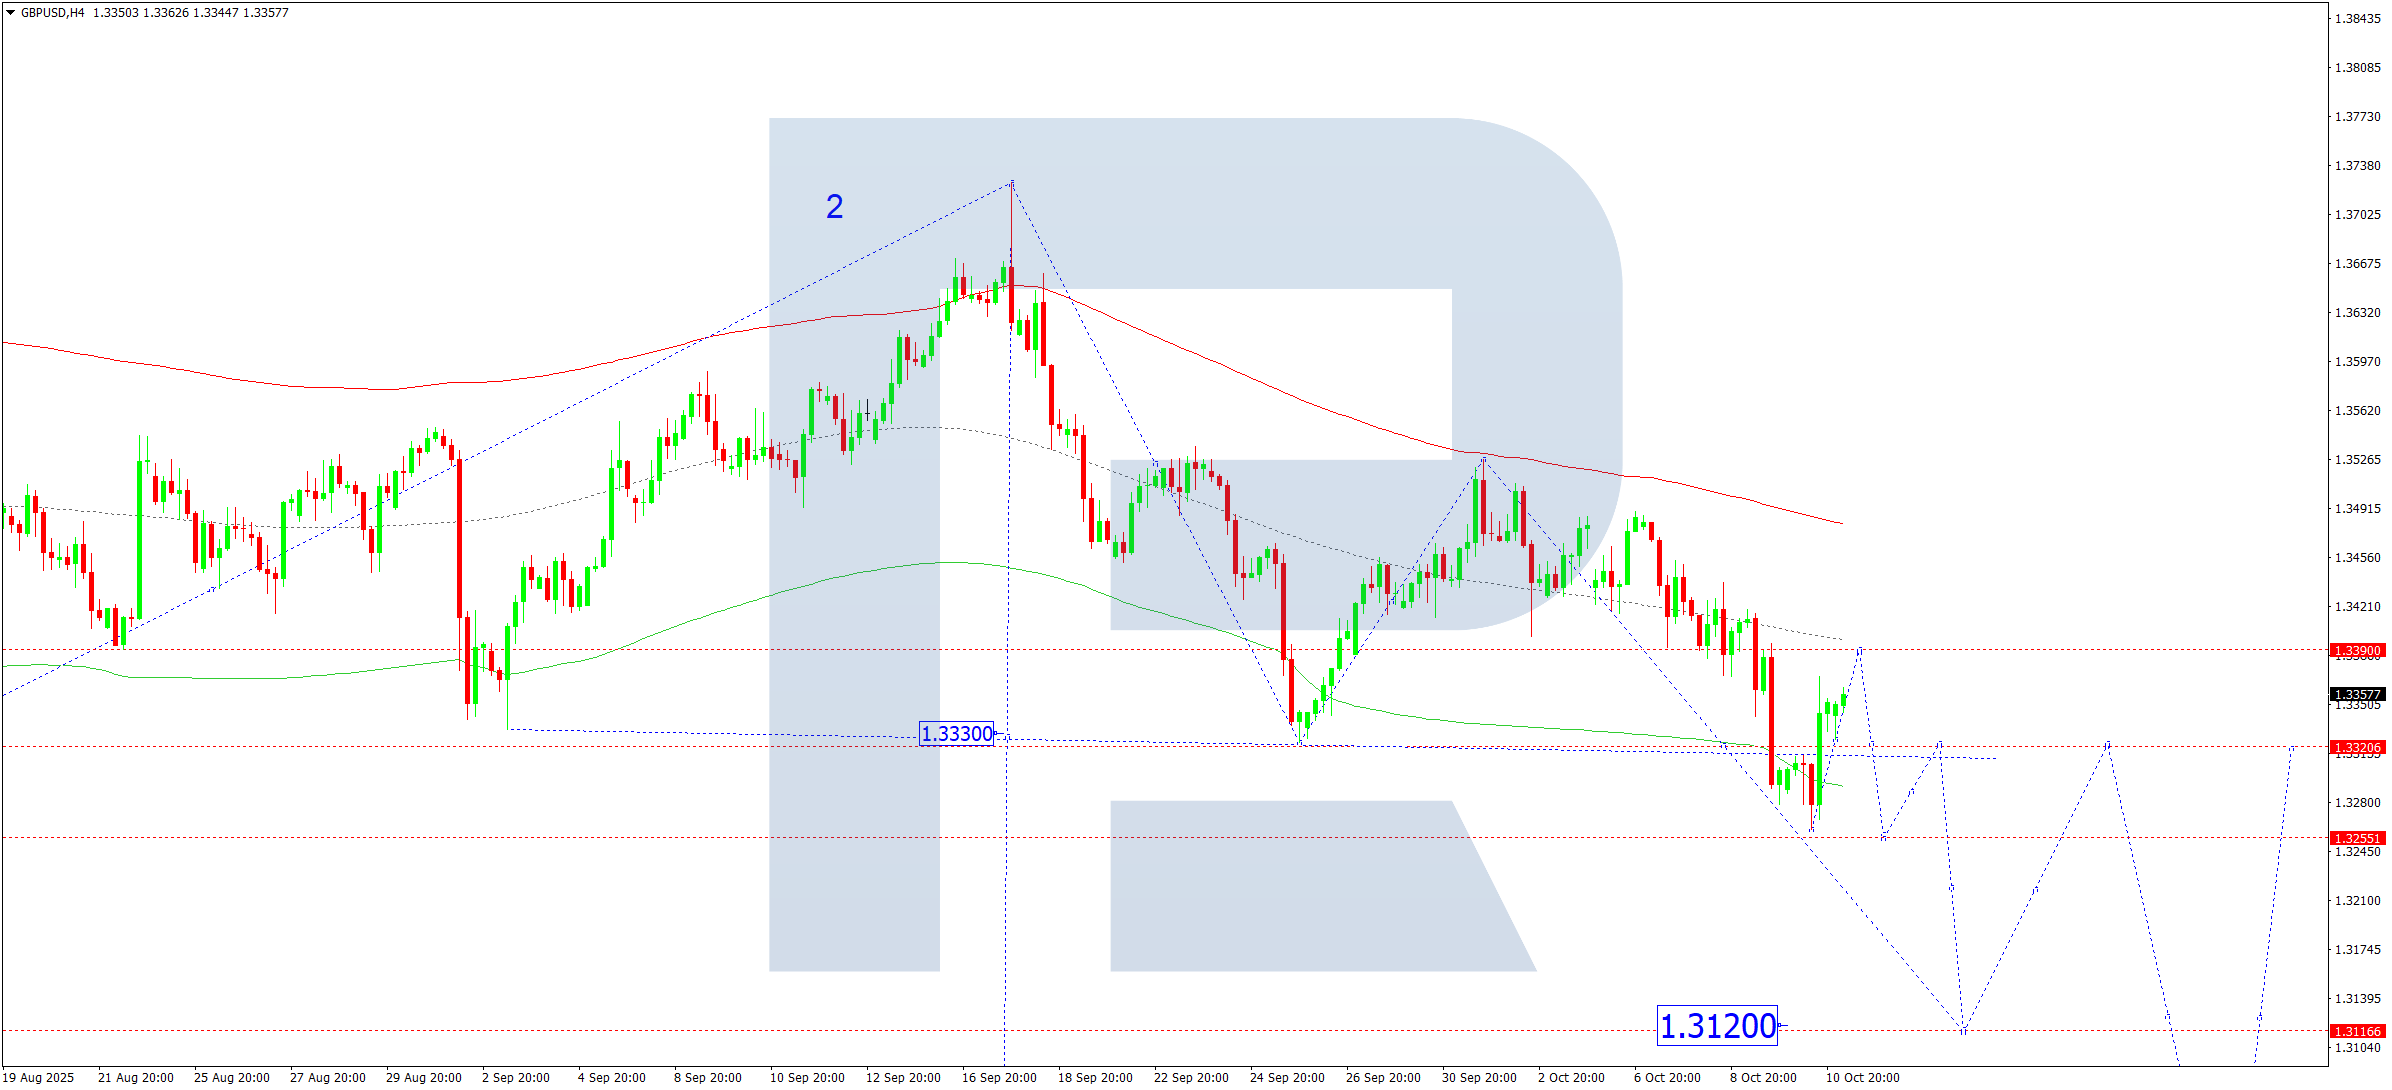
On the H4 chart of GBPUSD, a consolidation range formed around 1.3320, and the breakout upwards points to a potential correction towards 1.3390. On 13 October 2025, this correction is expected to end. Next, a decline towards 1.3250 is anticipated, with the wave potentially continuing to 1.3120.
Technically, this scenario is supported by the Elliott Wave structure and the bearish wave matrix with a pivot point at 1.3390, considered key in this wave. A consolidation range is developing above the lower boundary of the Price Envelope at 1.3260. An advance towards the central line at 1.3390 is expected today, followed by a new downward wave towards the lower boundary at 1.3255 and a potential continuation of the trend to 1.3120.
Technical indicators for today’s GBPUSD forecast suggest a further correction towards 1.3390 and the start of a decline towards 1.3255 and 1.3120.
AUDUSD forecast
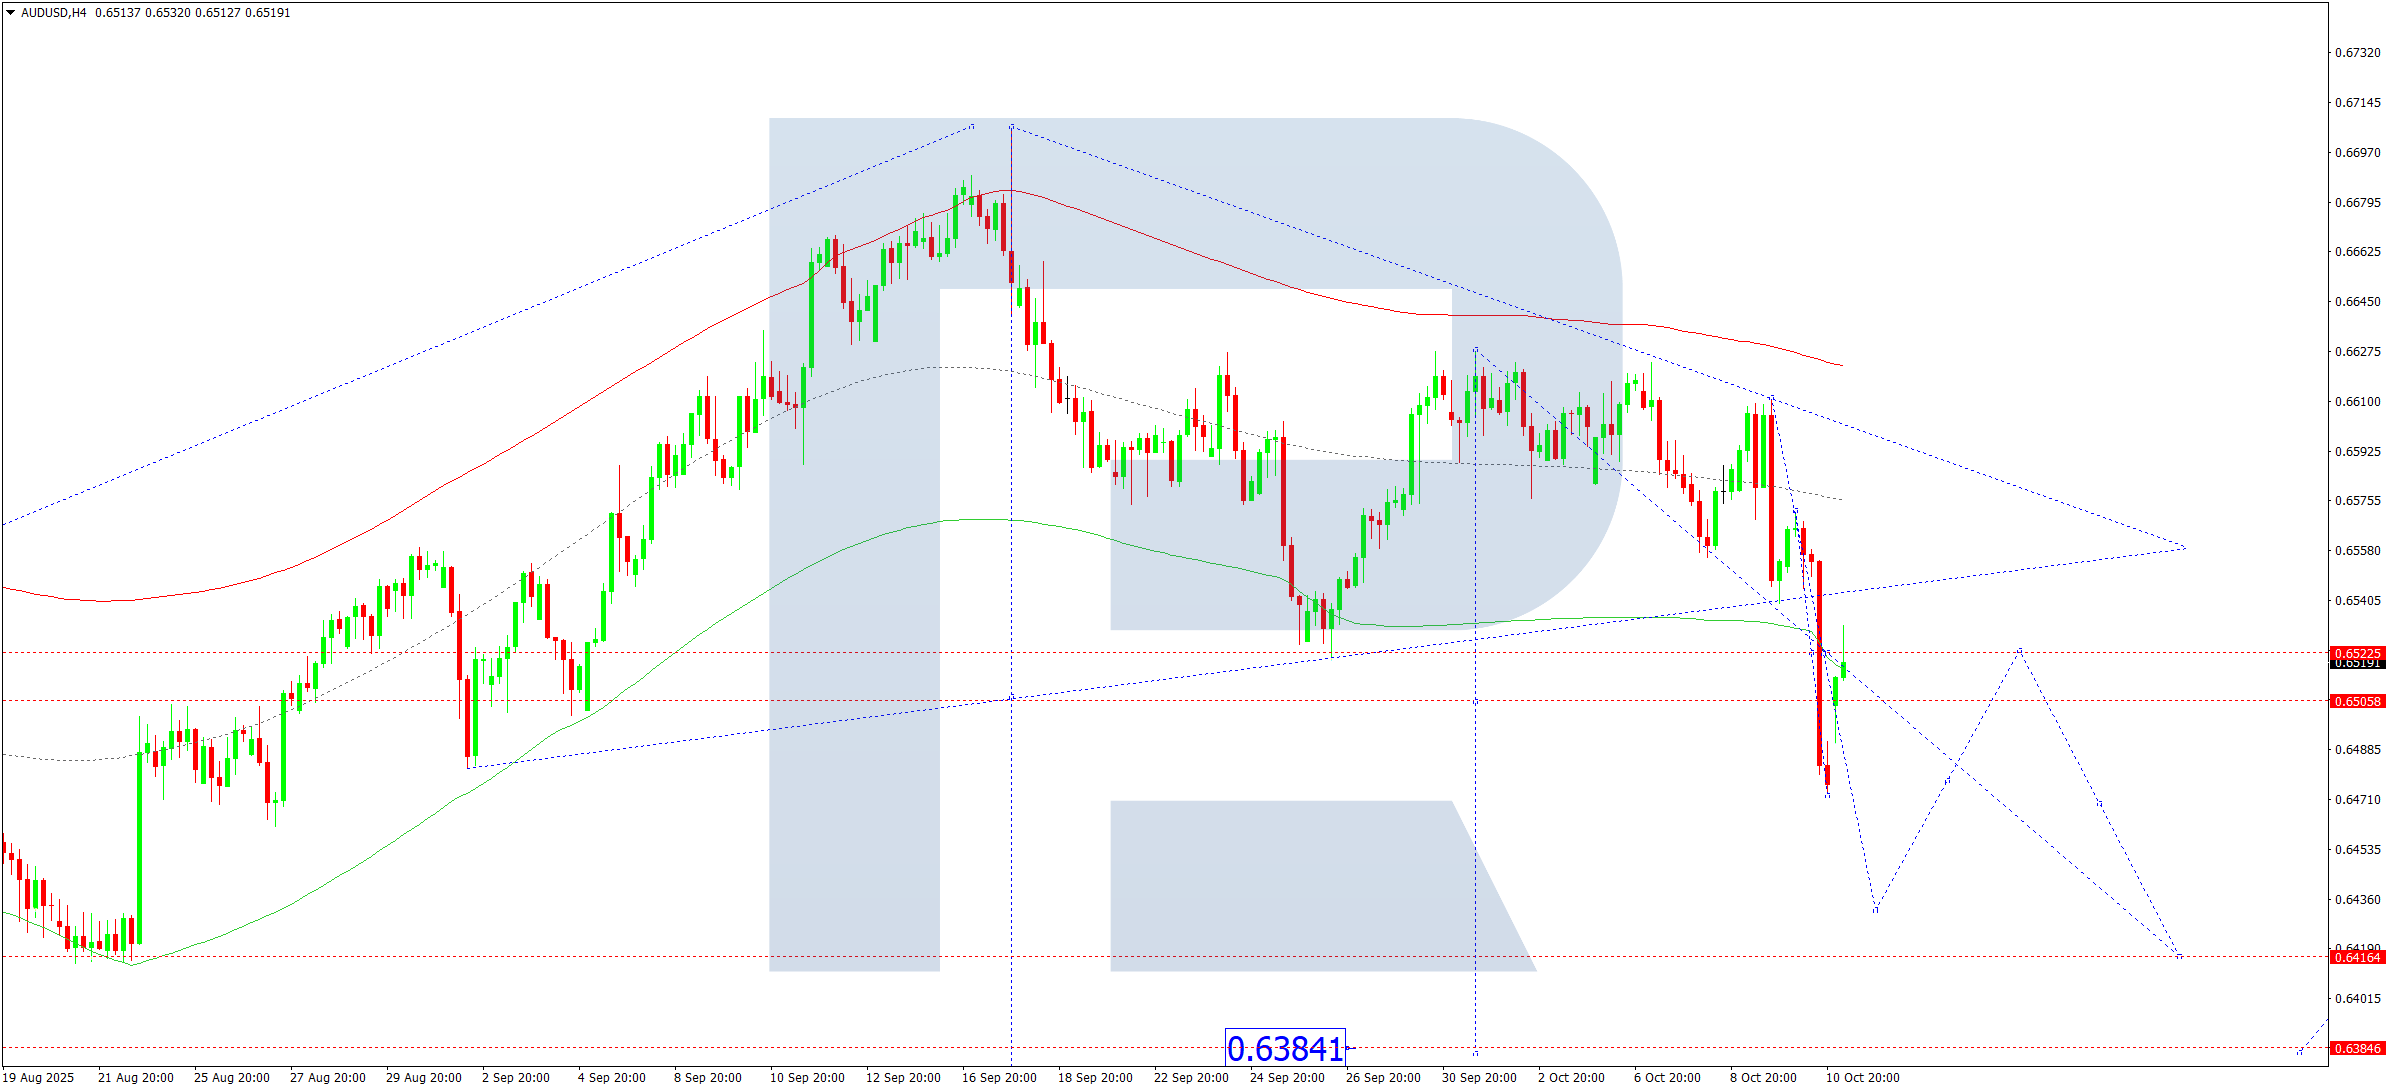
On the H4 chart of AUDUSD, a decline to 0.6473 and a correction to 0.6525 have been completed. On 13 October 2025, a move down to 0.6433 is expected, with development of the wave structure towards 0.6416. A breakout below 0.6416 would open the potential for the trend to continue towards 0.6384 as a local target.
Technically, this scenario is confirmed by the Elliott Wave structure and the bearish wave matrix with a pivot point at 0.6525, the key level for this wave. The market is extending the downward wave towards the lower boundary of the Price Envelope at 0.6416. A breakout there could extend the trend towards 0.6384.
Technical indicators for today’s AUDUSD forecast suggest a decline towards 0.6416.
USDCAD forecast
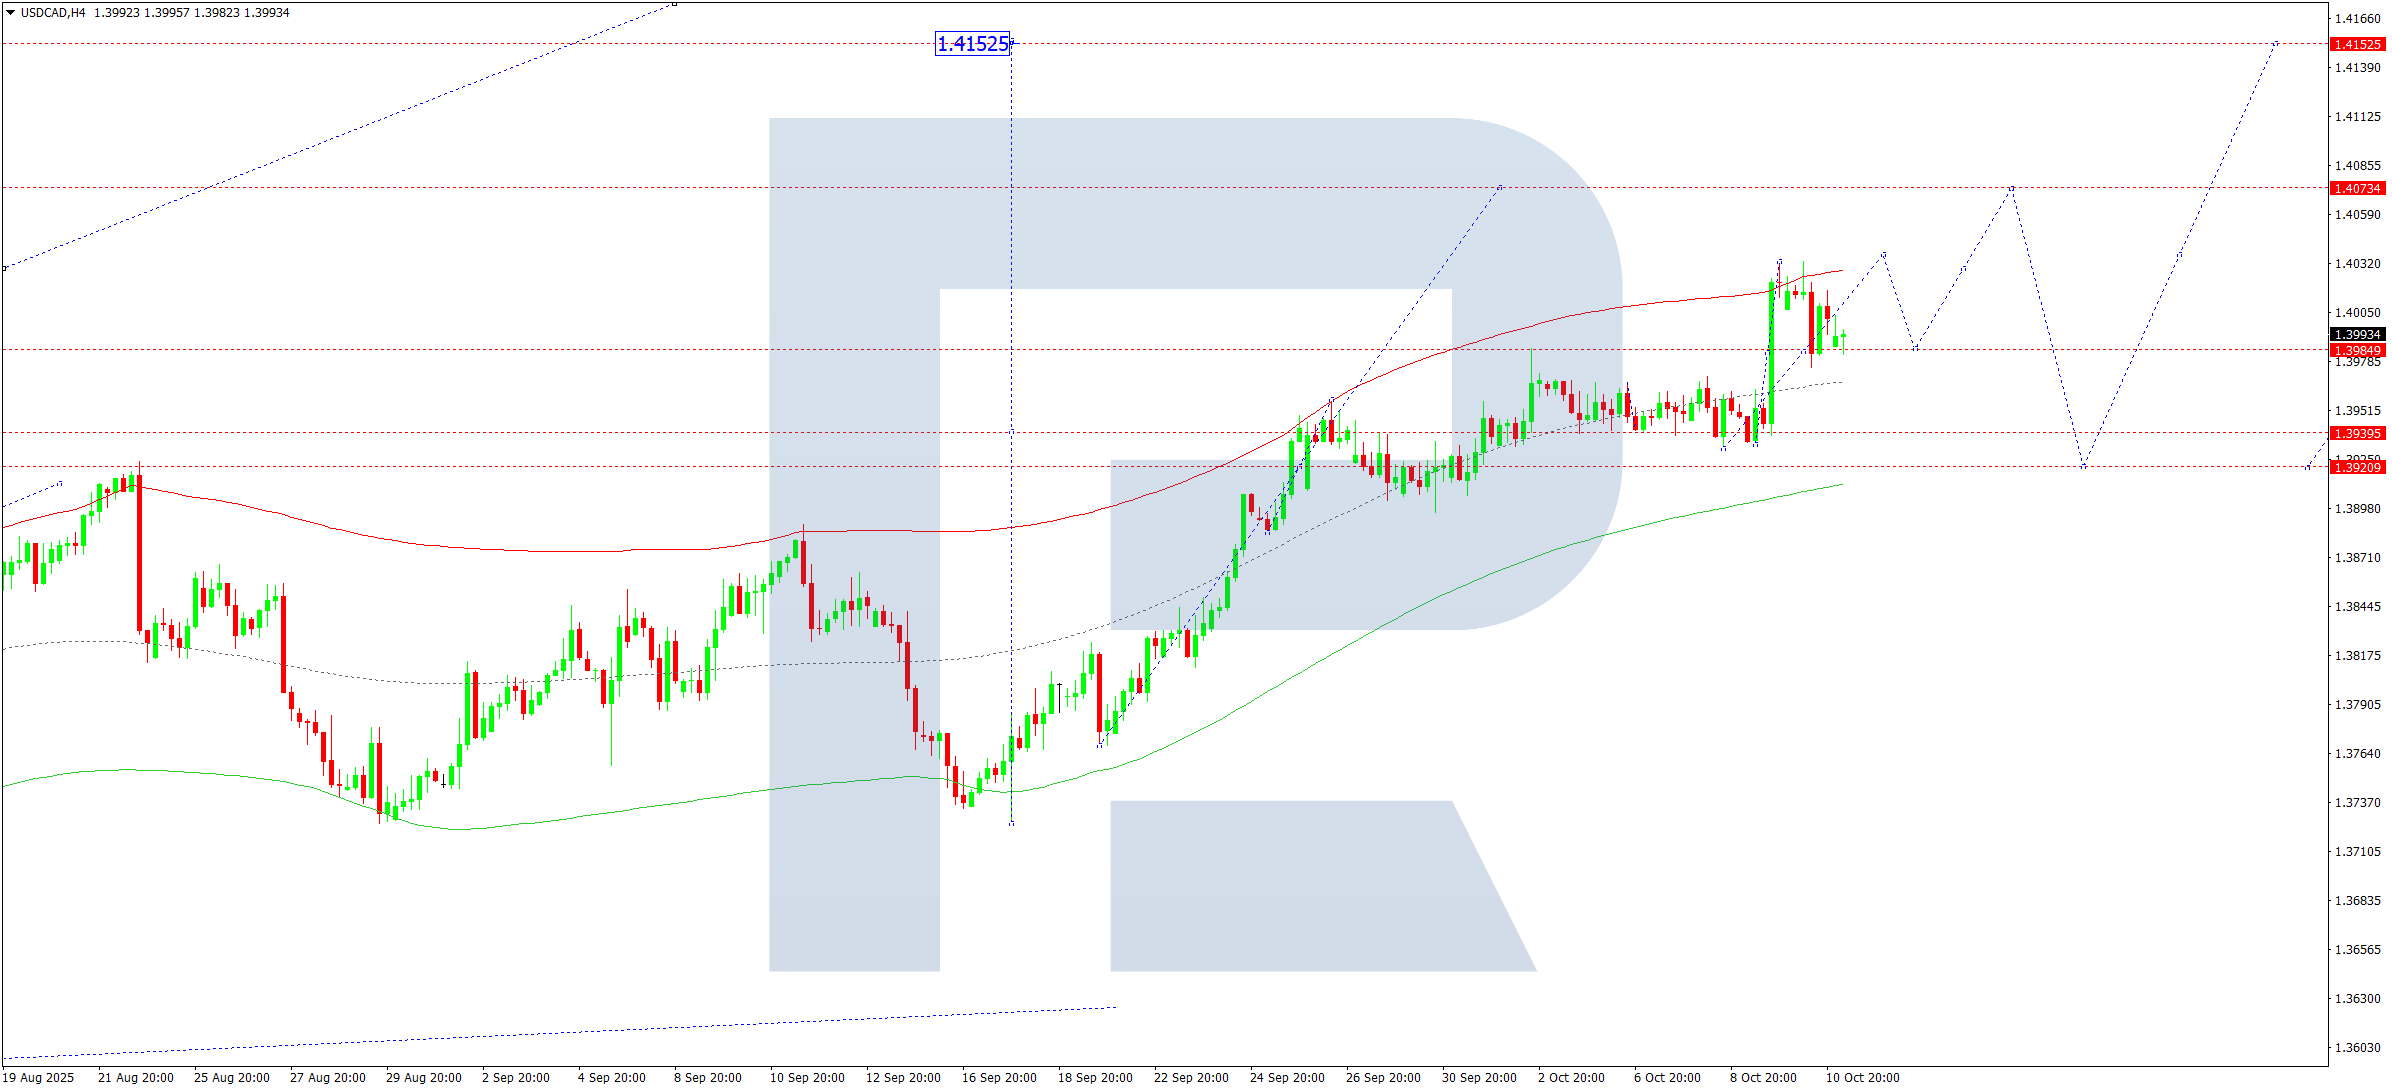
On the H4 chart of USDCAD, the market found support at 1.3985 and continues to advance towards 1.4037. On 13 October 2025, the price is expected to reach this level before undergoing a correction towards 1.3985. Next, an upward wave towards 1.4070 is expected, with potential continuation of the trend to 1.4111.
Technically, this scenario is supported by the Elliott Wave structure and the bullish wave matrix with a pivot point at 1.3920, the key level for USDCAD. The growth wave is developing towards the upper boundary of the Price Envelope at 1.4070. The pair could reach this level today before correcting towards the central line at 1.3985 (testing from above) and rising towards 1.4111.
Technical indicators for today’s USDCAD forecast suggest further growth towards 1.4070 and 1.4111.
XAUUSD forecast
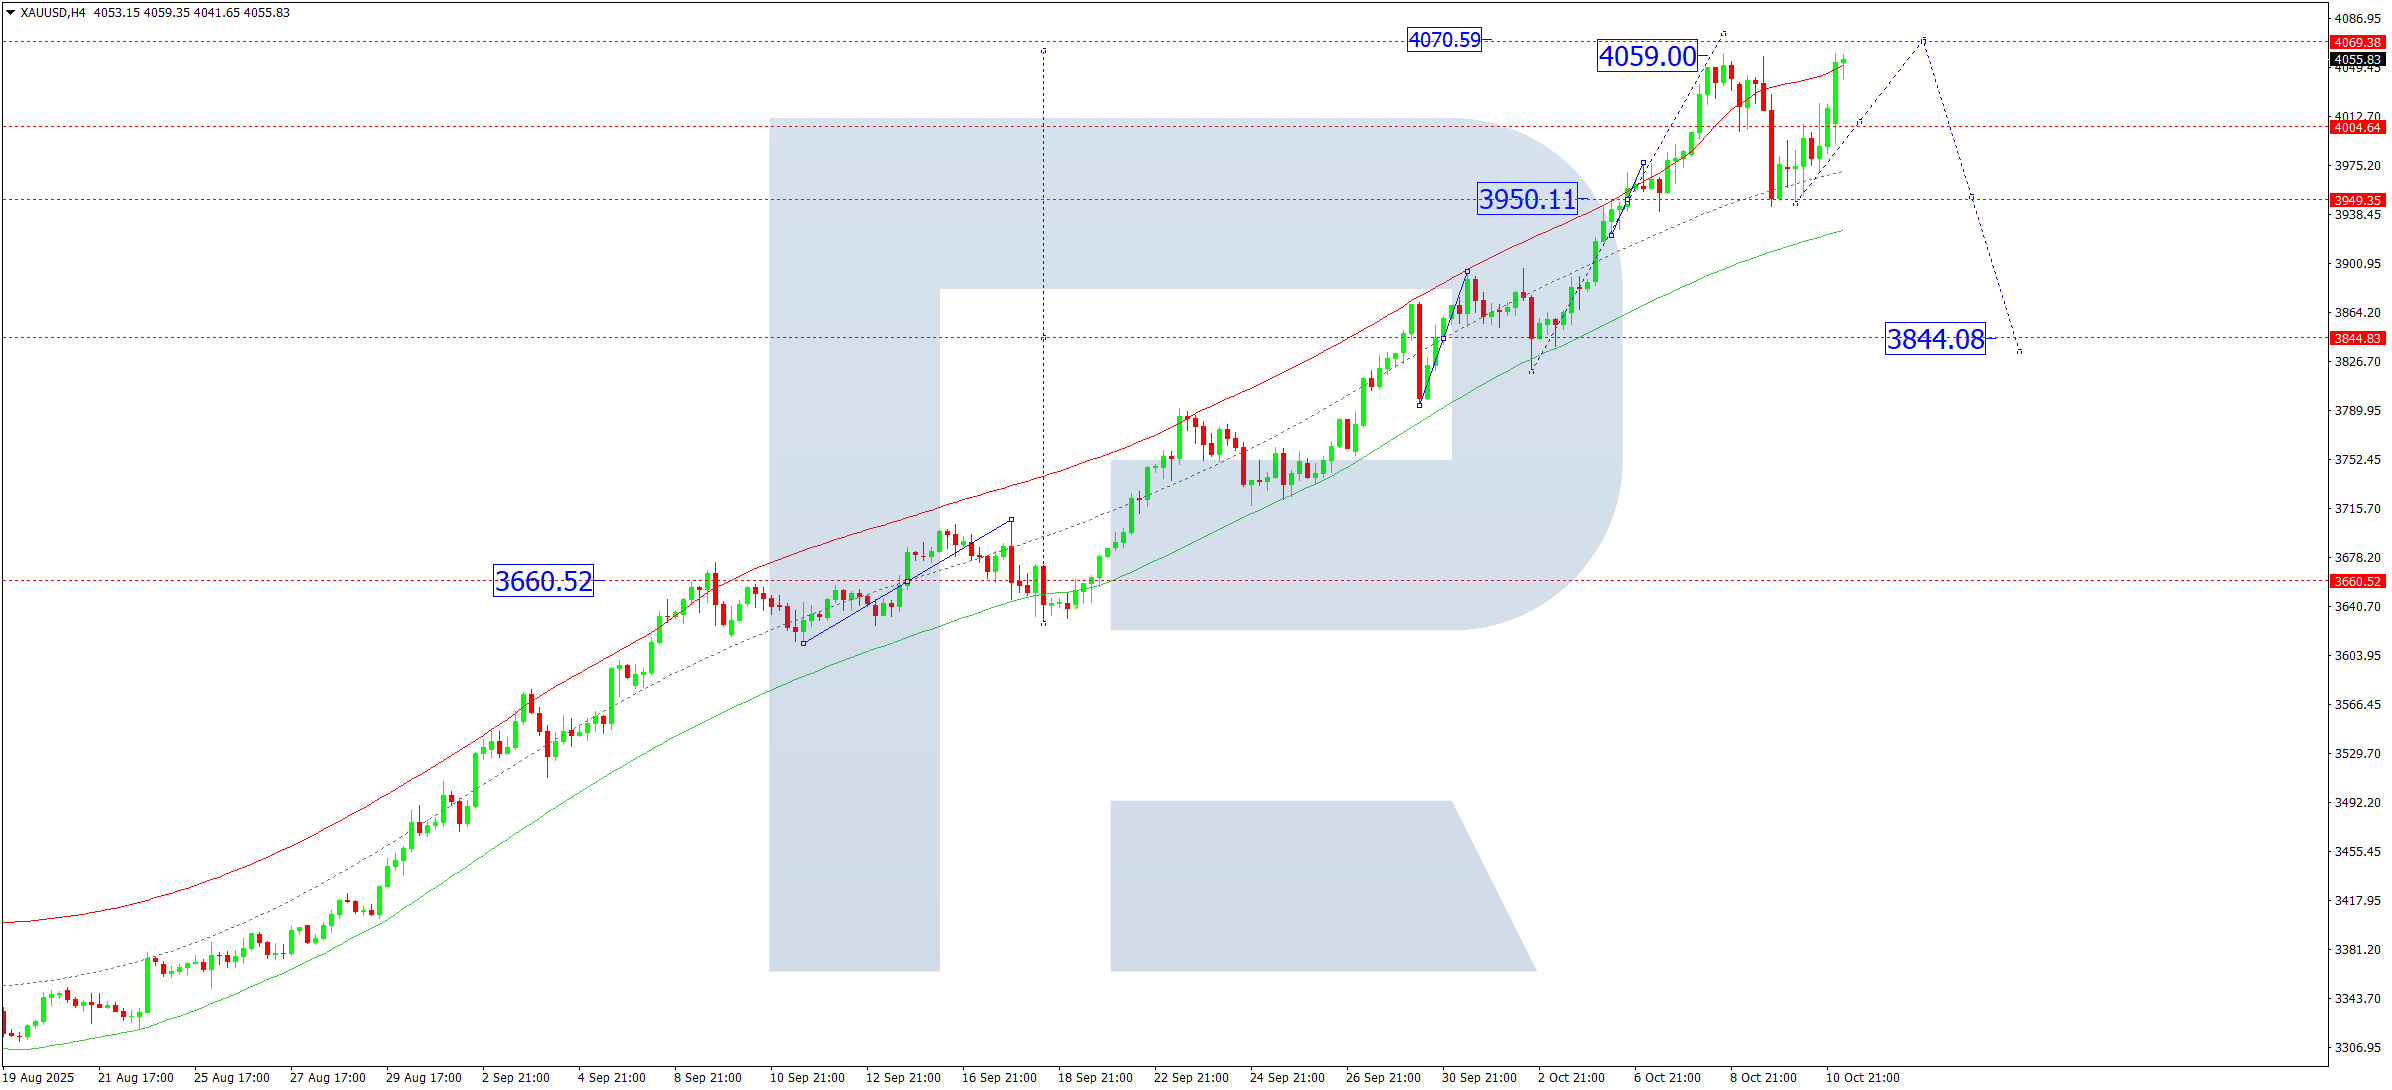
On the H4 chart of XAUUSD, a rise towards 4,078 is unfolding. On 13 October 2025, this target is expected to be reached. Then a corrective move towards 3,950 is likely. After the correction, a rise towards 4,004 is anticipated. A new consolidation range may develop around 4,004. An upside breakout would open the potential for continuation towards 4,170; a downside breakout could lead to a correction towards 3,844.
Technically, this scenario is confirmed by the Elliott Wave structure and the bullish wave matrix with a pivot point at 3,660, the key level for this wave. The market is advancing towards the upper boundary of the Price Envelope at 4,078, with an expected corrective move later towards its lower boundary at 3,950.
Technical indicators for today’s XAUUSD forecast suggest the completion of the rise and the start of a correction towards 3,950.
Brent forecast
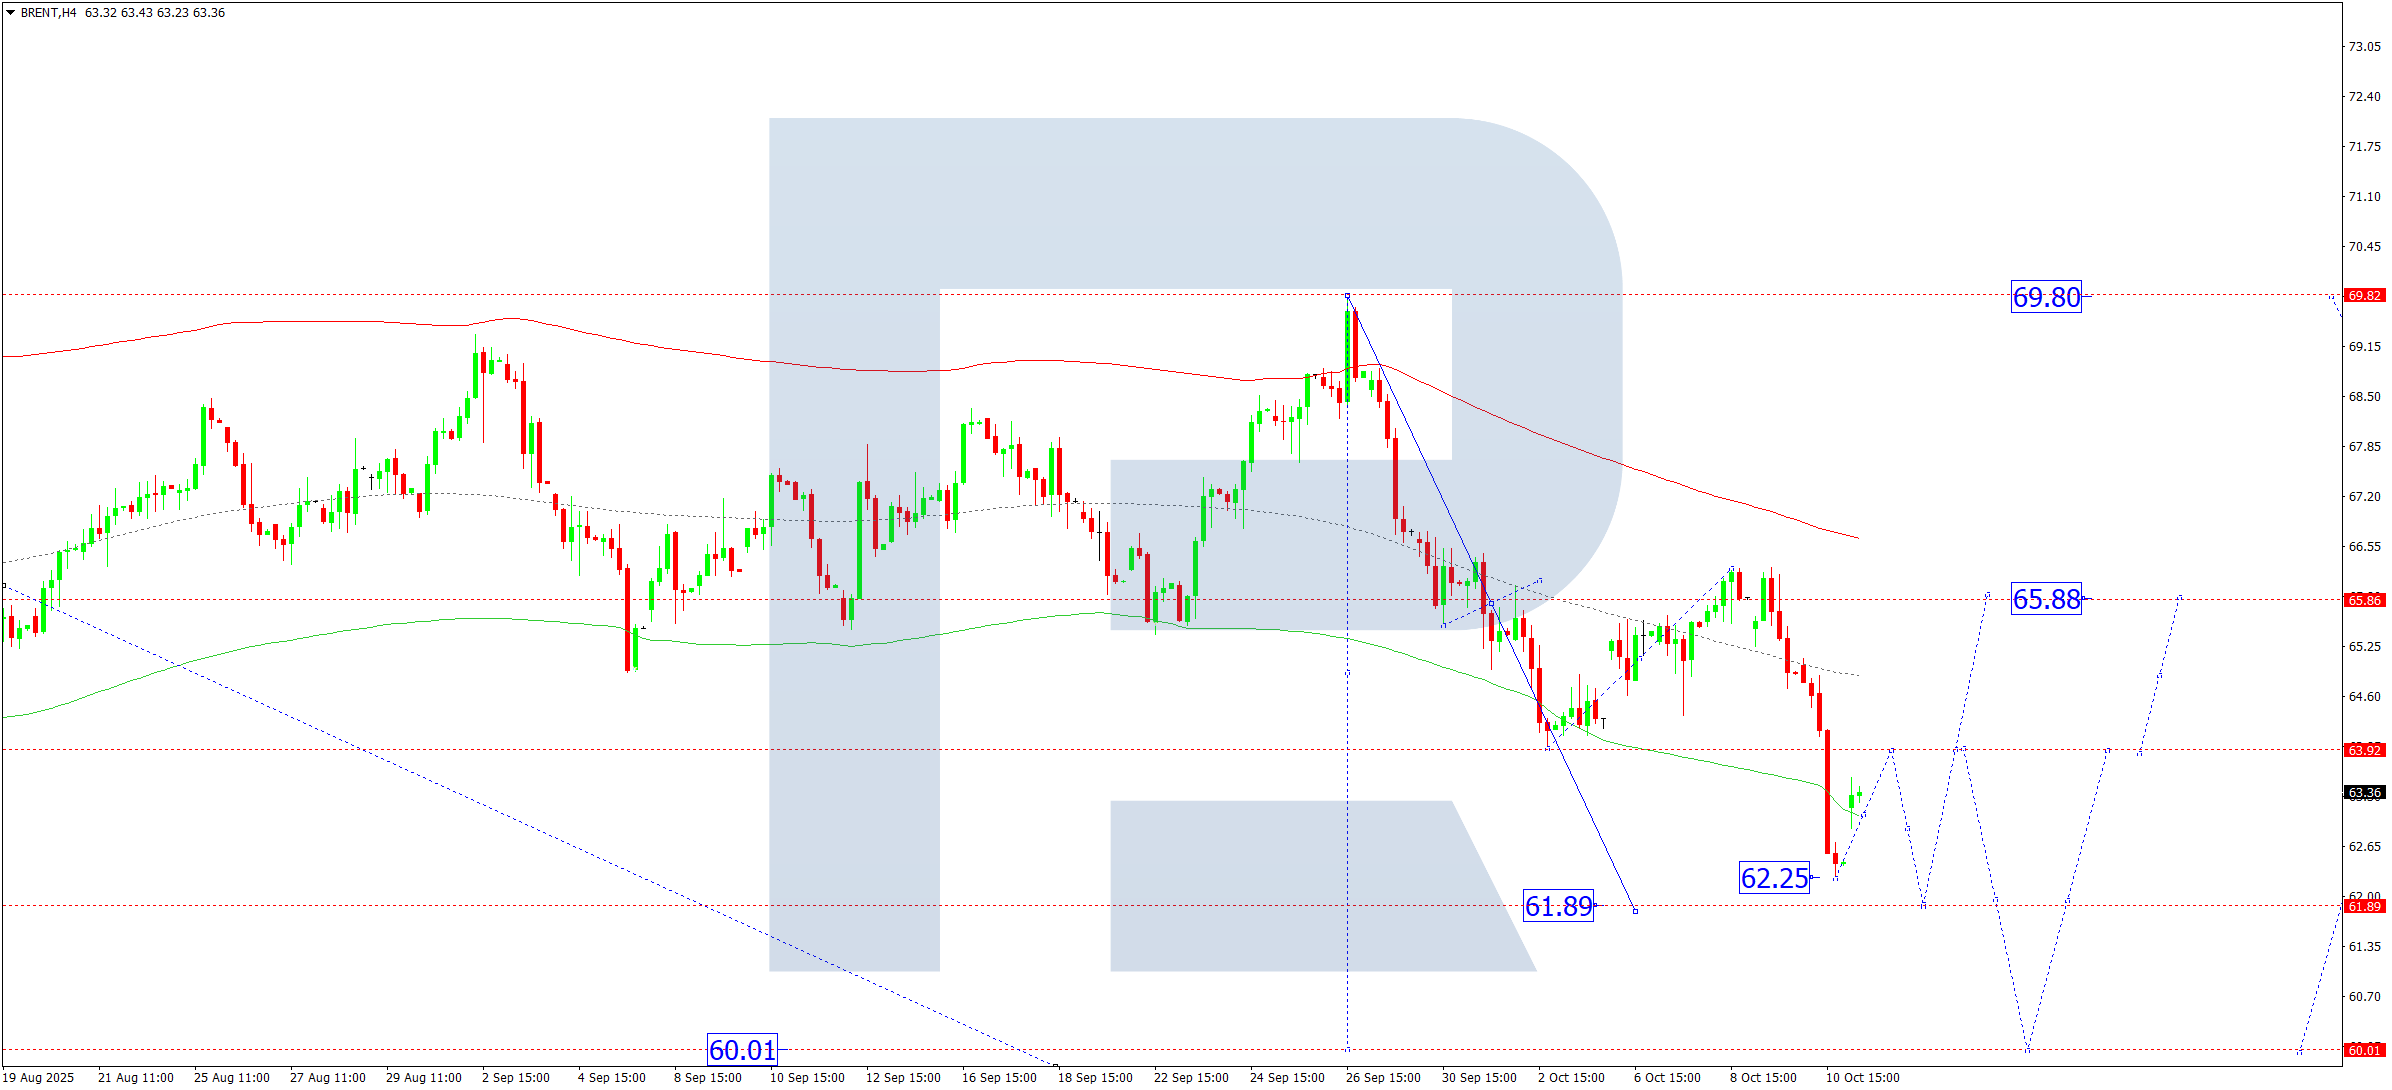
On the H4 chart of Brent crude, a decline to 62.25 has been completed. On 13 October 2025, a rebound towards 63.90 (testing from below) is expected. A broader consolidation range is forming around 65.88. A breakout above this range would open the potential for a move to 69.80. A downward breakout would imply continuation of the trend to 61.61 with scope to extend towards 60.00.
Technically, this scenario is supported by the Elliott Wave structure and the bearish wave matrix with a pivot point at 65.88, the key level for this wave. The market has reached the lower boundary of the Price Envelope at 62.25. A correction towards the upper boundary at 65.88 remains likely, followed by a continuation towards the lower boundary at 61.61.
Technical indicators for today’s Brent forecast suggest a correction towards 63.90 and the start of a decline towards 61.61.
Forecasts presented in this section only reflect the author’s private opinion and should not be considered as guidance for trading. RoboForex bears no responsibility for trading results based on trading recommendations described in these analytical reviews.