Daily technical analysis and forecast for 10 October 2025
Here is a detailed daily technical analysis and forecast for EURUSD, USDJPY, GBPUSD, AUDUSD, USDCAD, XAUUSD and Brent for 10 October 2025.
EURUSD forecast
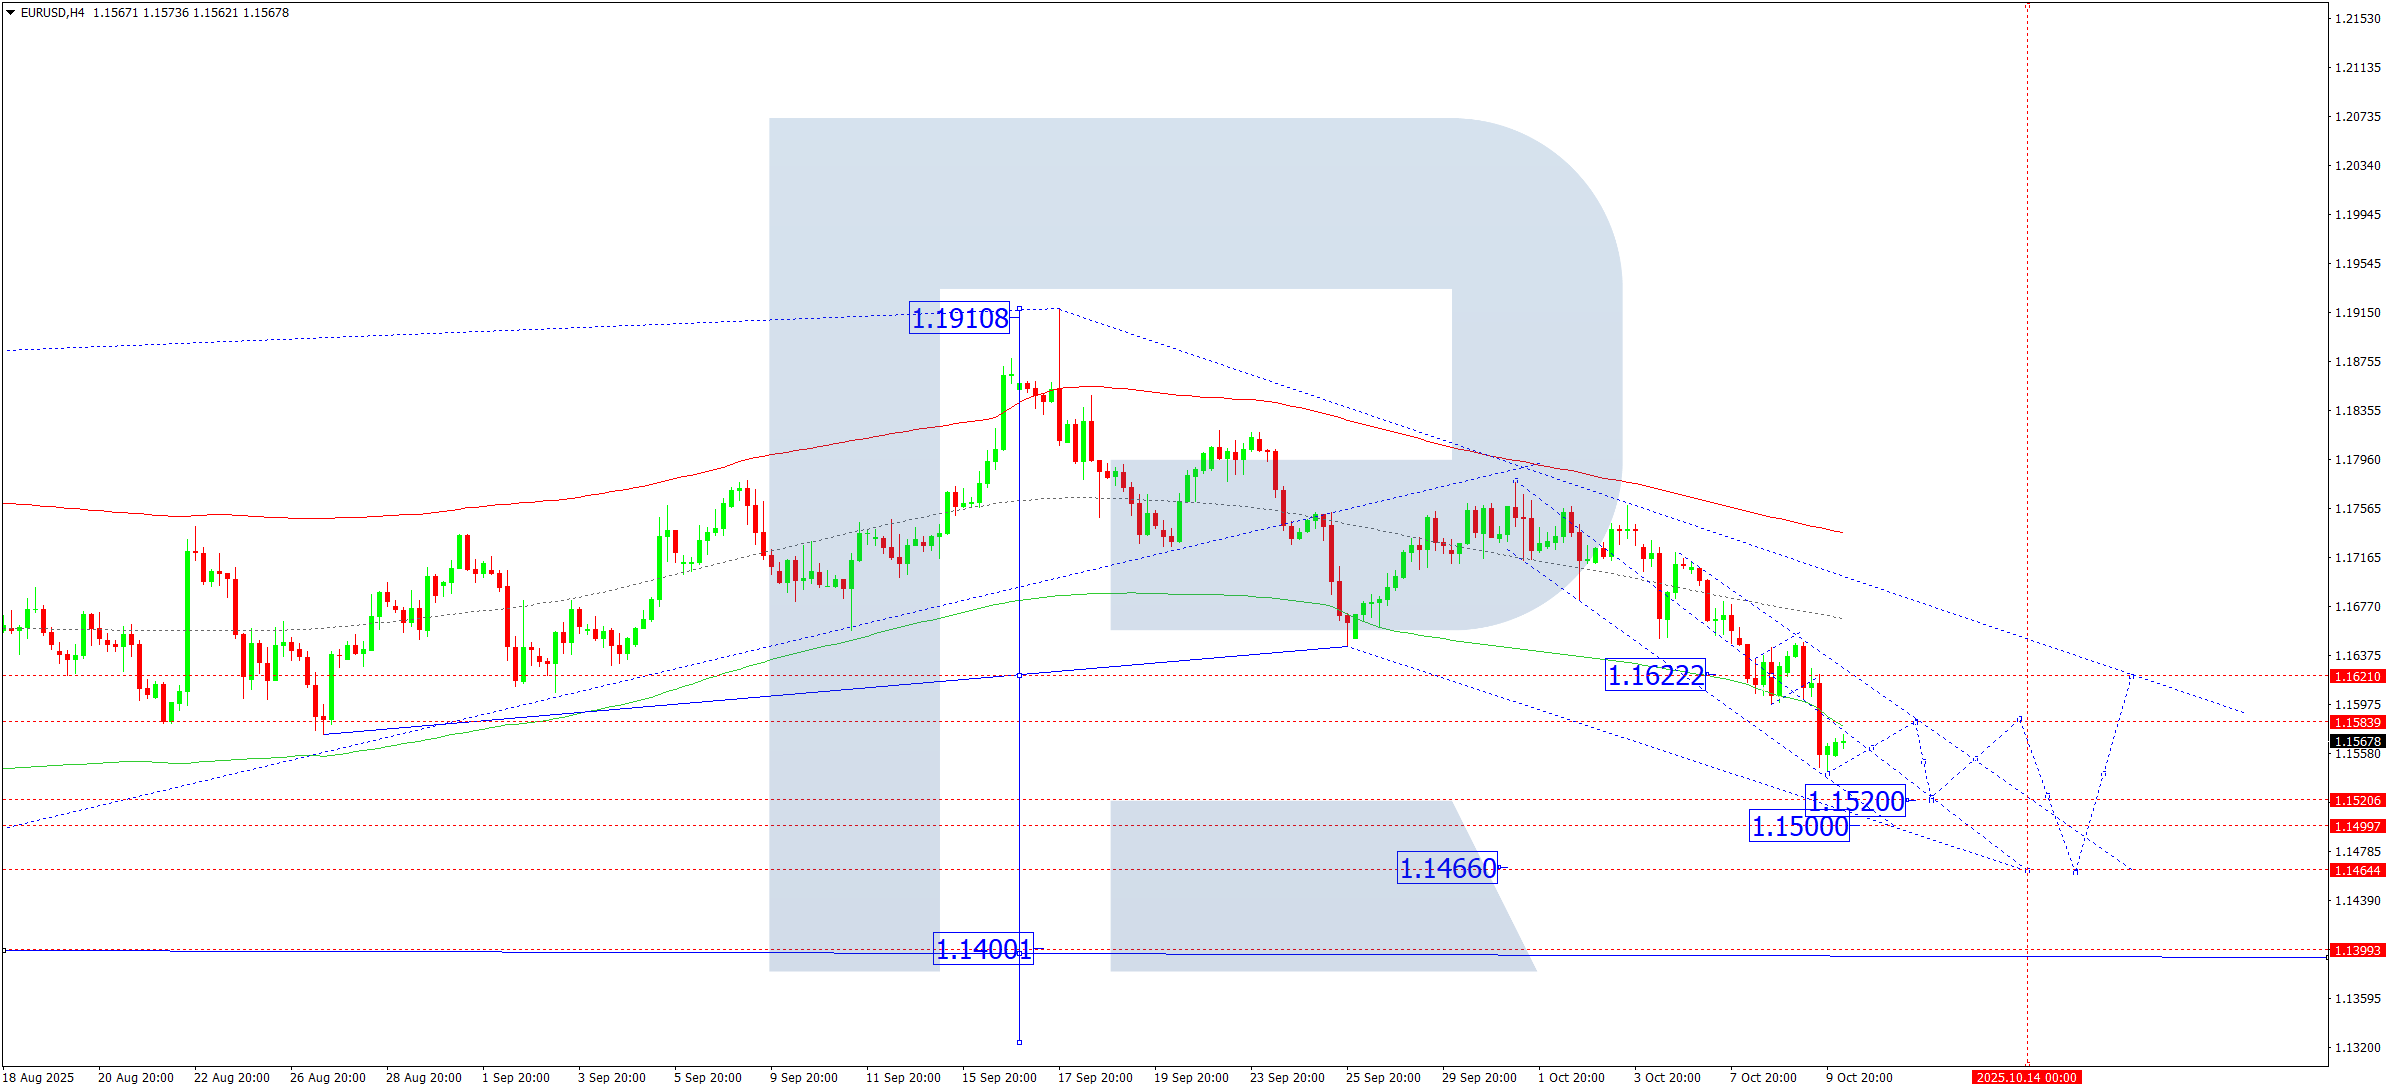
On the H4 chart of EURUSD, the market completed a downward wave towards 1.1542. A correction towards 1.1580 is currently forming. On 10 October 2025, the correction is expected to end, followed by a continuation of the downward movement towards 1.1520, with potential extensions to 1.1500 and 1.1466 as a local target.
Technically, this scenario is confirmed by the Elliott Wave structure and the downward wave matrix with the pivot point at 1.1622, which is viewed as the key level in the EURUSD structure. The market is expected to move towards the lower boundary of the Price Envelope at 1.1520, with further potential for continuation of the downtrend towards 1.1466.
Technical indicators for today’s EURUSD forecast suggest the third downward wave could develop towards 1.1520, at a minimum.
USDJPY forecast
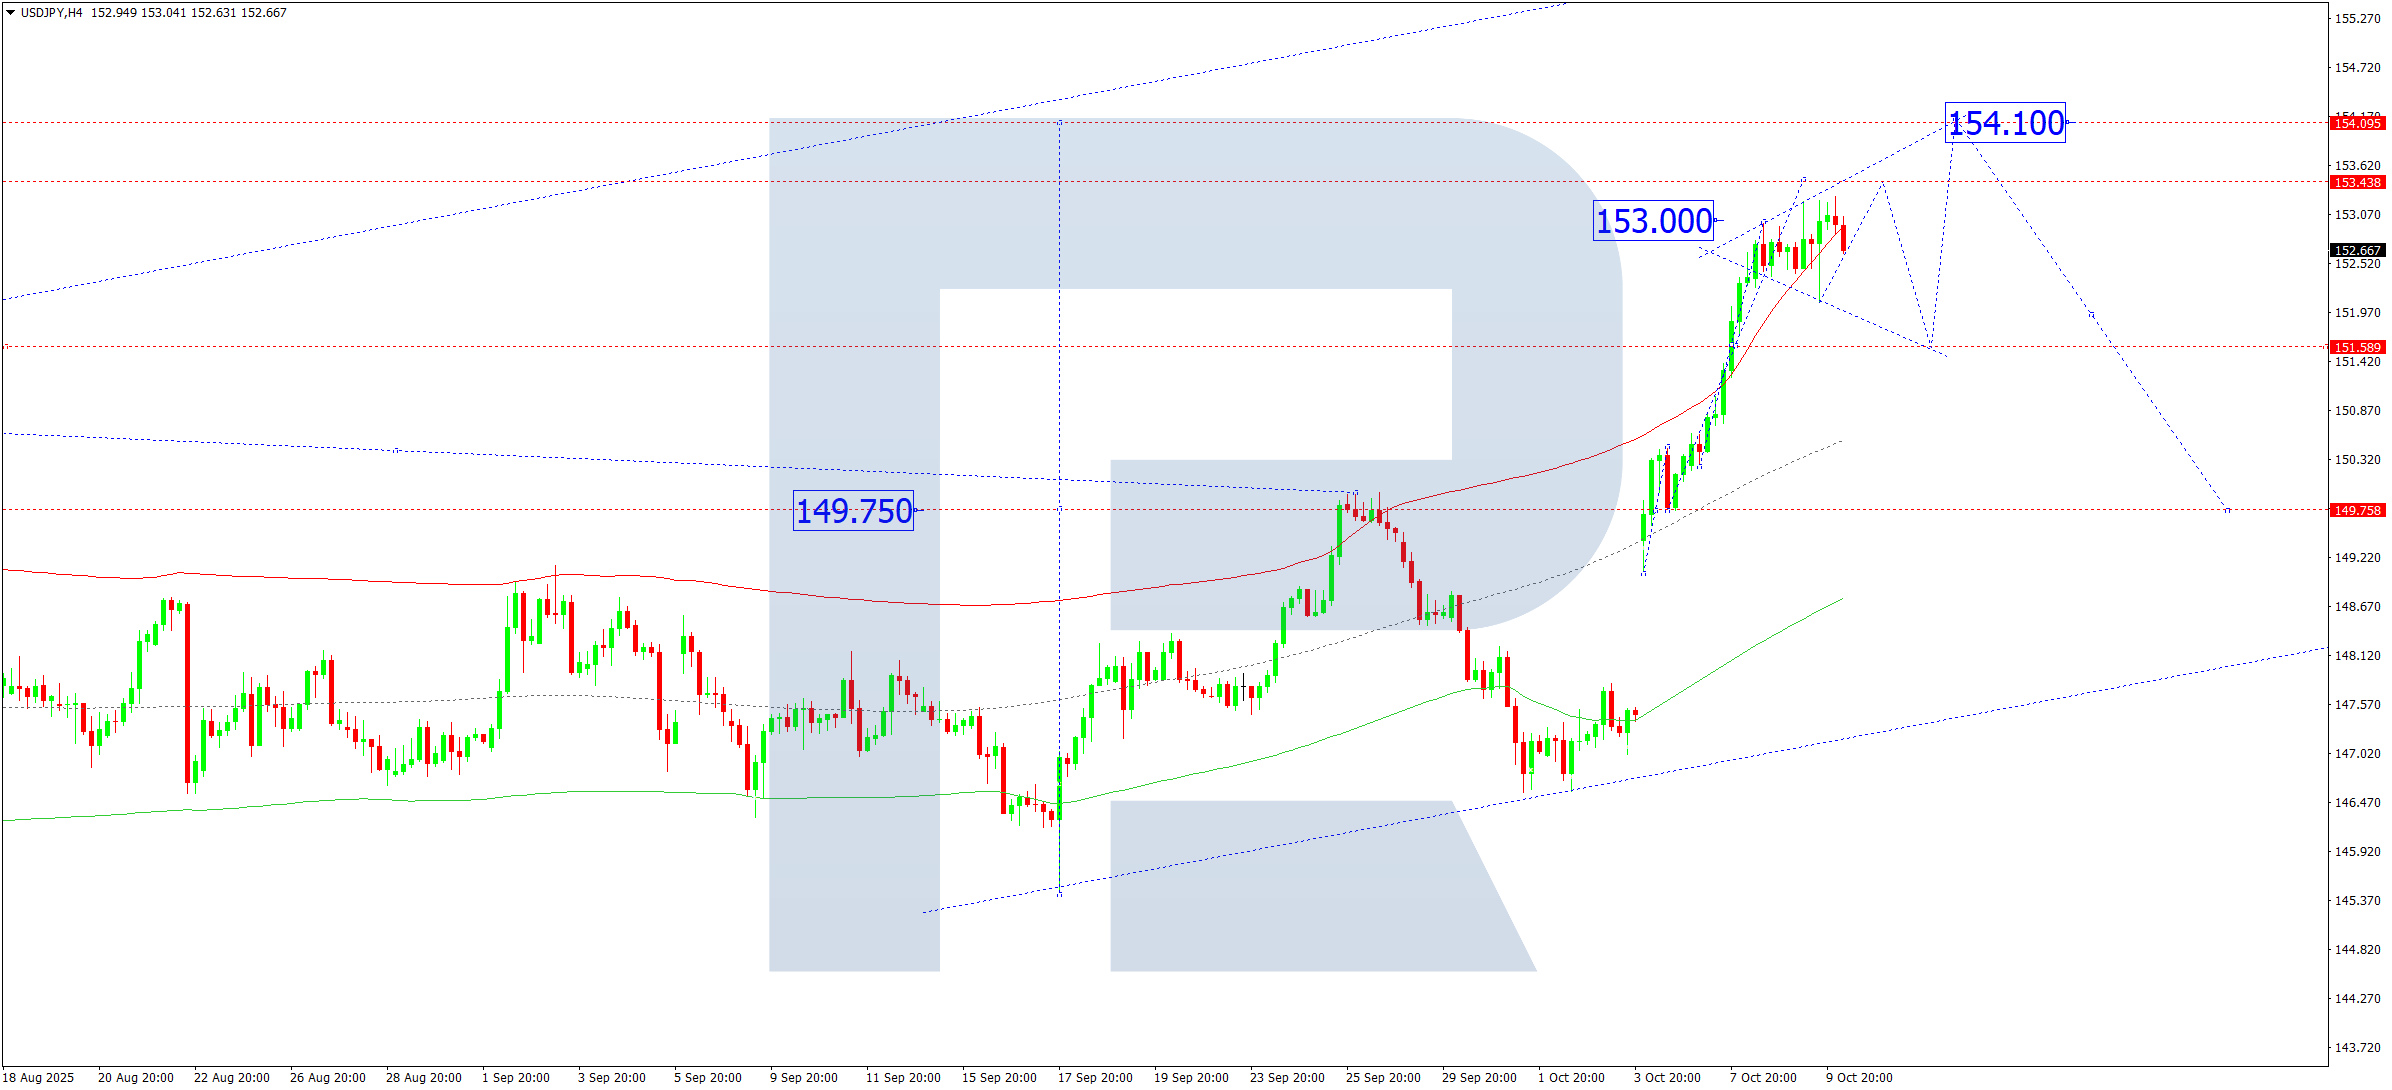
On the H4 chart of USDJPY, the market completed an upward wave to 153.25. On 10 October 2025, a consolidation range is expected to form below this level. A downward extension to 151.60 is possible before growth towards 152.75. A breakout from the range downwards could trigger a correction towards 149.76, while an upward breakout would suggest a continuation of the trend towards 154.10.
Technically, this scenario is confirmed by the Elliott Wave structure and the upward wave matrix with the pivot point at 149.76, which is the key level for this wave. The market continues to develop an upward wave towards the upper boundary of the Price Envelope at 154.10, with prospects for the trend continuation towards 156.90.
Technical indicators for today’s USDJPY forecast suggest possible growth towards 154.10 and 156.90.
GBPUSD forecast
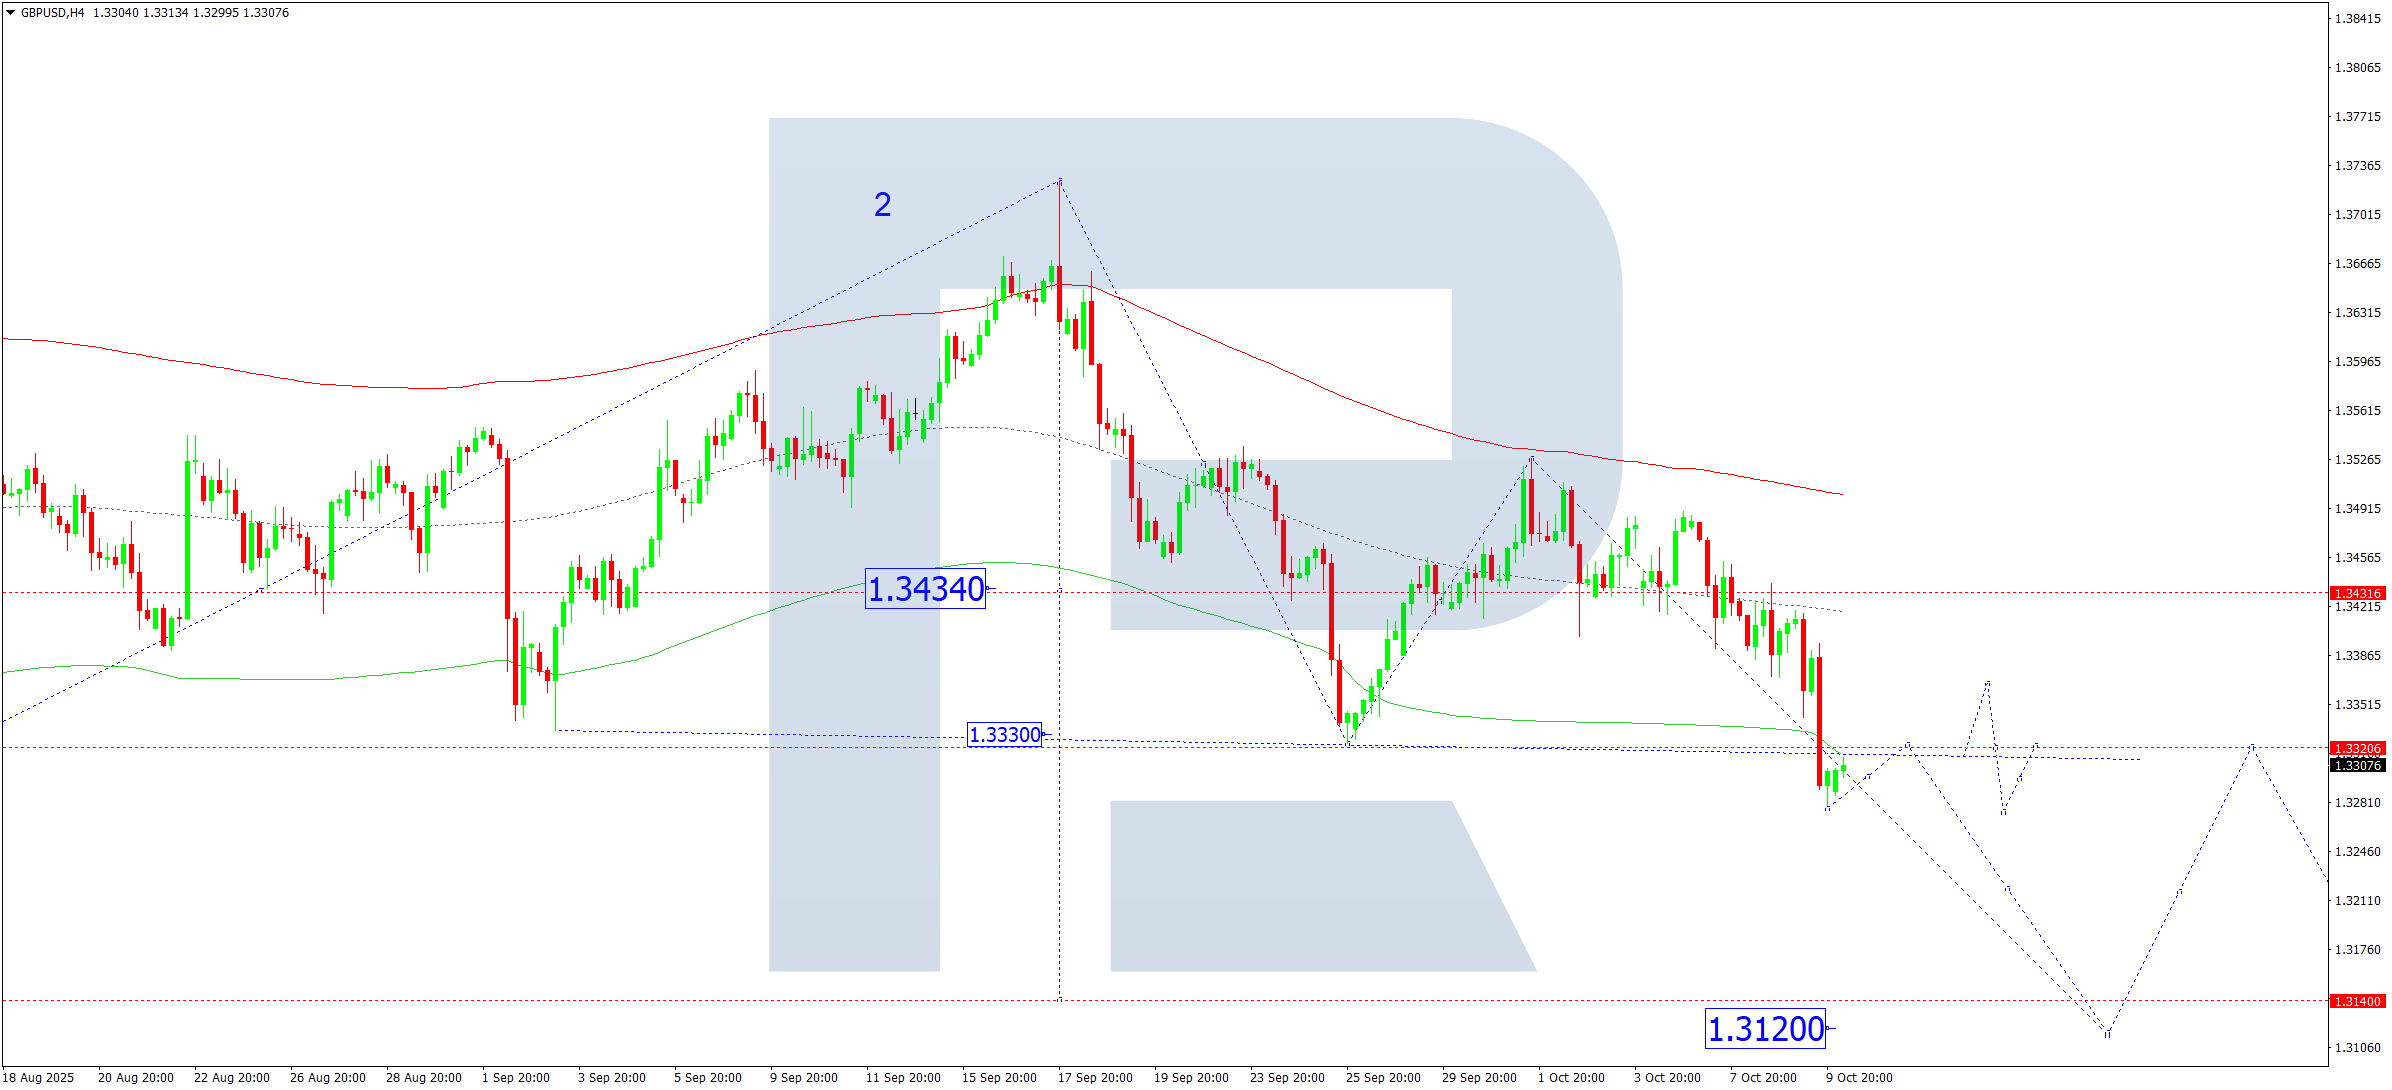
On the H4 chart of GBPUSD, the market formed a consolidation range around 1.3434 and, after breaking downwards, extended the wave to 1.3278. On 10 October 2025, a retest of 1.3320 from below is expected. Afterwards, a new downward wave may begin, targeting 1.3140 and potentially extending to 1.3120.
Technically, this scenario is confirmed by the Elliott Wave structure and the downward wave matrix with the pivot point at 1.3330, which acts as a key level in the GBPUSD structure. The market is currently consolidating around the central line of the Price Envelope at 1.3330. A downward breakout would open the potential for the wave to continue towards the lower boundary at 1.3140 and then to 1.3120.
Technical indicators for today’s GBPUSD forecast point to a continued downward movement towards 1.3140 and 1.3120.
AUDUSD forecast
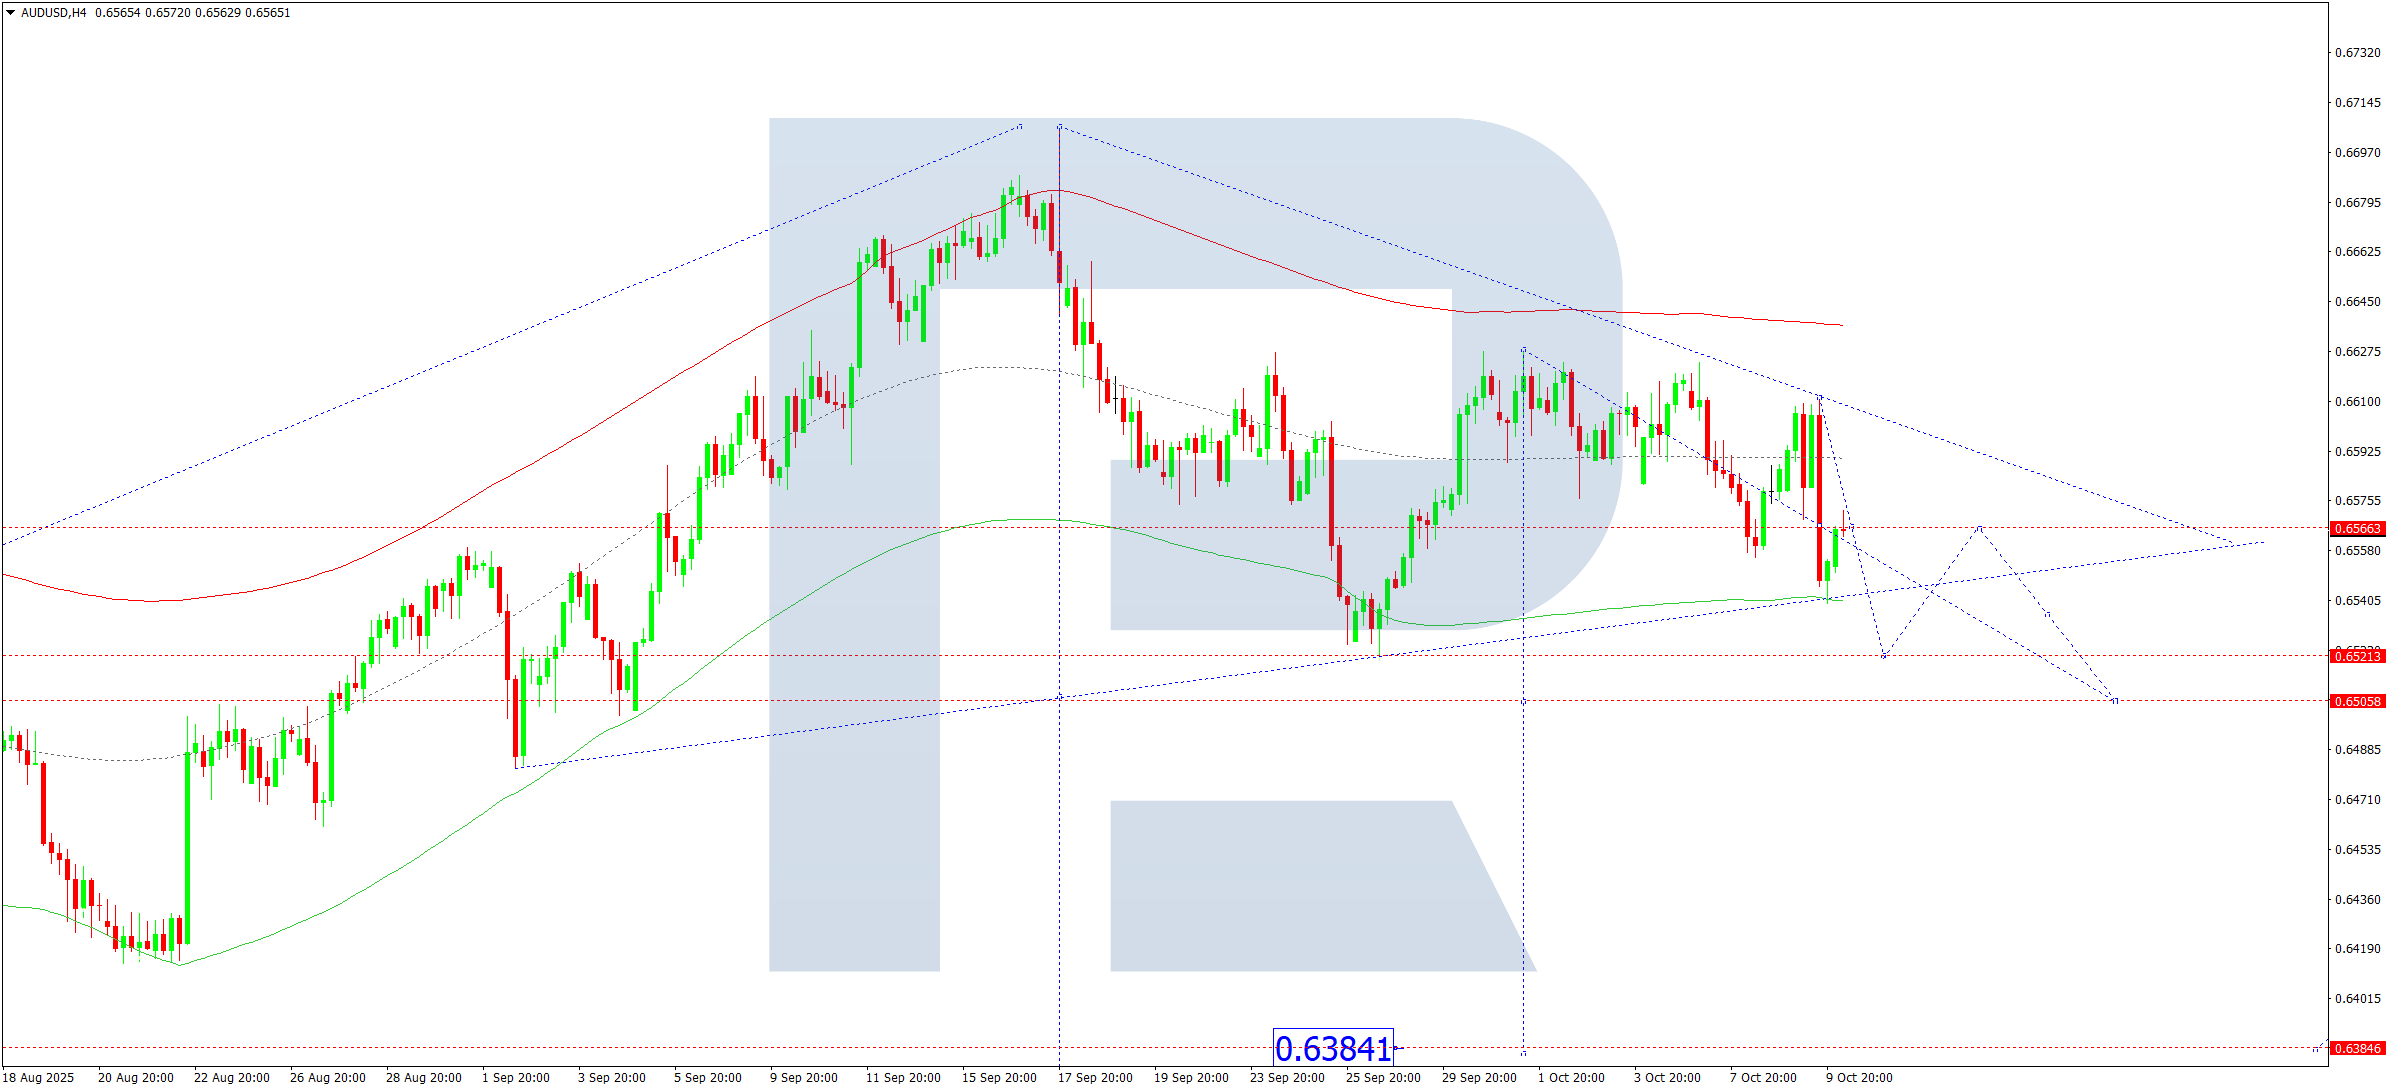
On the H4 chart of AUDUSD, the market completed a downward wave to 0.6539 and corrected towards 0.6565. On 10 October 2025, the price is expected to decline to 0.6521, with the wave structure possibly extending down to 0.6505. A breakout below this level would open the potential for further continuation of the trend towards 0.6384 as a local target.
Technically, this scenario is confirmed by the Elliott Wave structure and the downward wave matrix with the pivot point at 0.6565, the key level for this wave. The market continues developing a downward wave towards the lower boundary of the Price Envelope at 0.6505. A breakout of this level could extend the decline to 0.6384.
Technical indicators for today’s AUDUSD forecast suggest a downward wave towards 0.6505.
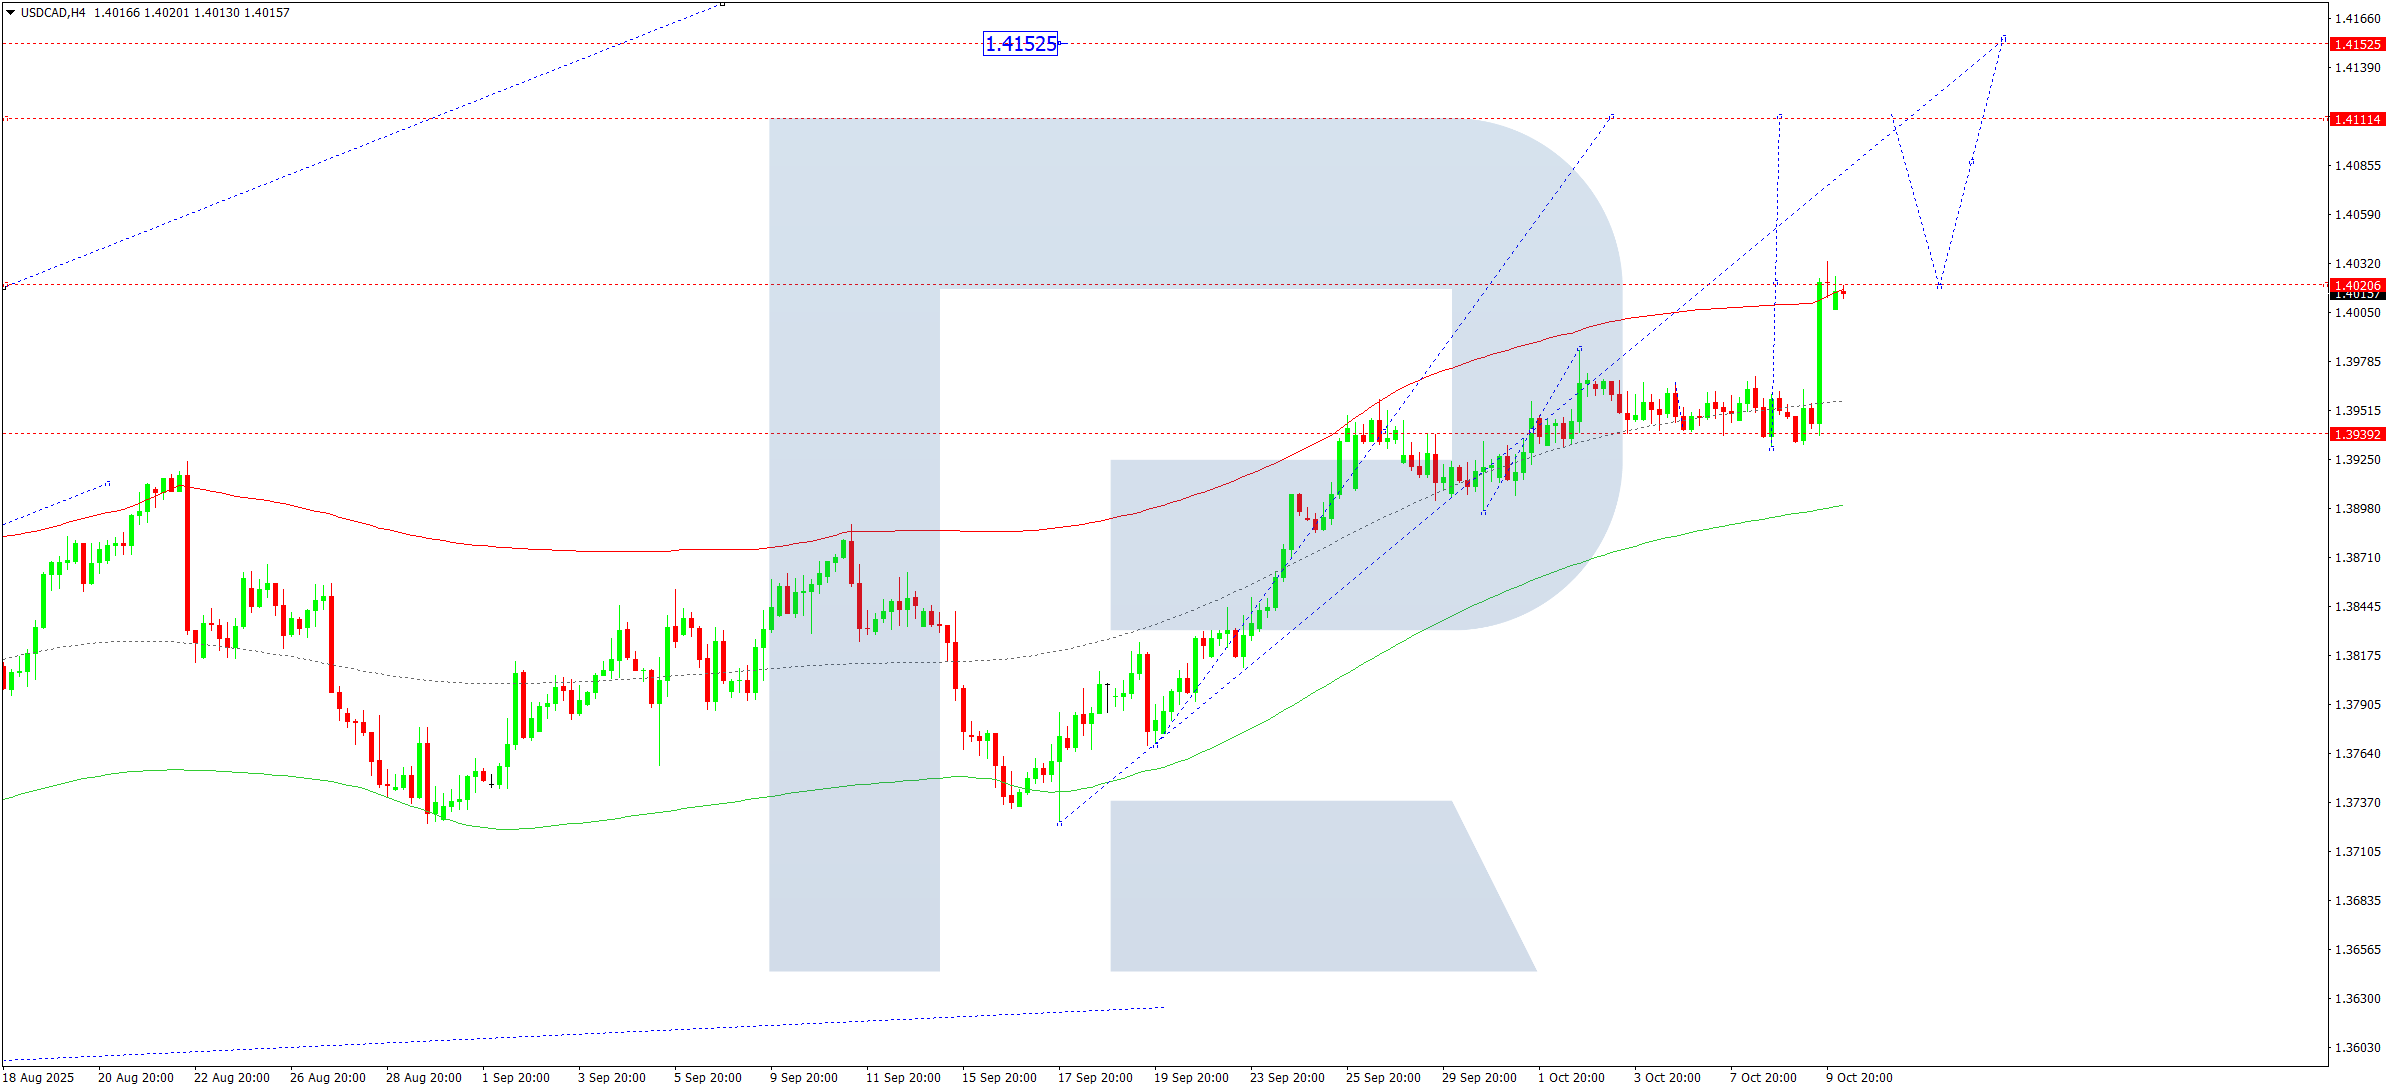
USDCAD forecast
On the H4 chart of USDCAD, the market completed an upward wave to 1.4033 and is forming a consolidation range below this level. On 10 October 2025, a downward move towards 1.3986 is expected, followed by the beginning of a new upward wave towards 1.4111, with potential continuation of the trend towards 1.4152.
Technically, this scenario is confirmed by the Elliott Wave structure and the upward wave matrix with the pivot point at 1.3939, considered the key level for the USDCAD structure. The market is forming an upward wave towards the upper boundary of the Price Envelope at 1.4111. After reaching this level, a correction towards the central line at 1.4020 (testing from above) may occur, followed by growth towards 1.4152.
Technical indicators for today’s USDCAD forecast suggest continued growth towards 1.4111 and 1.4152.
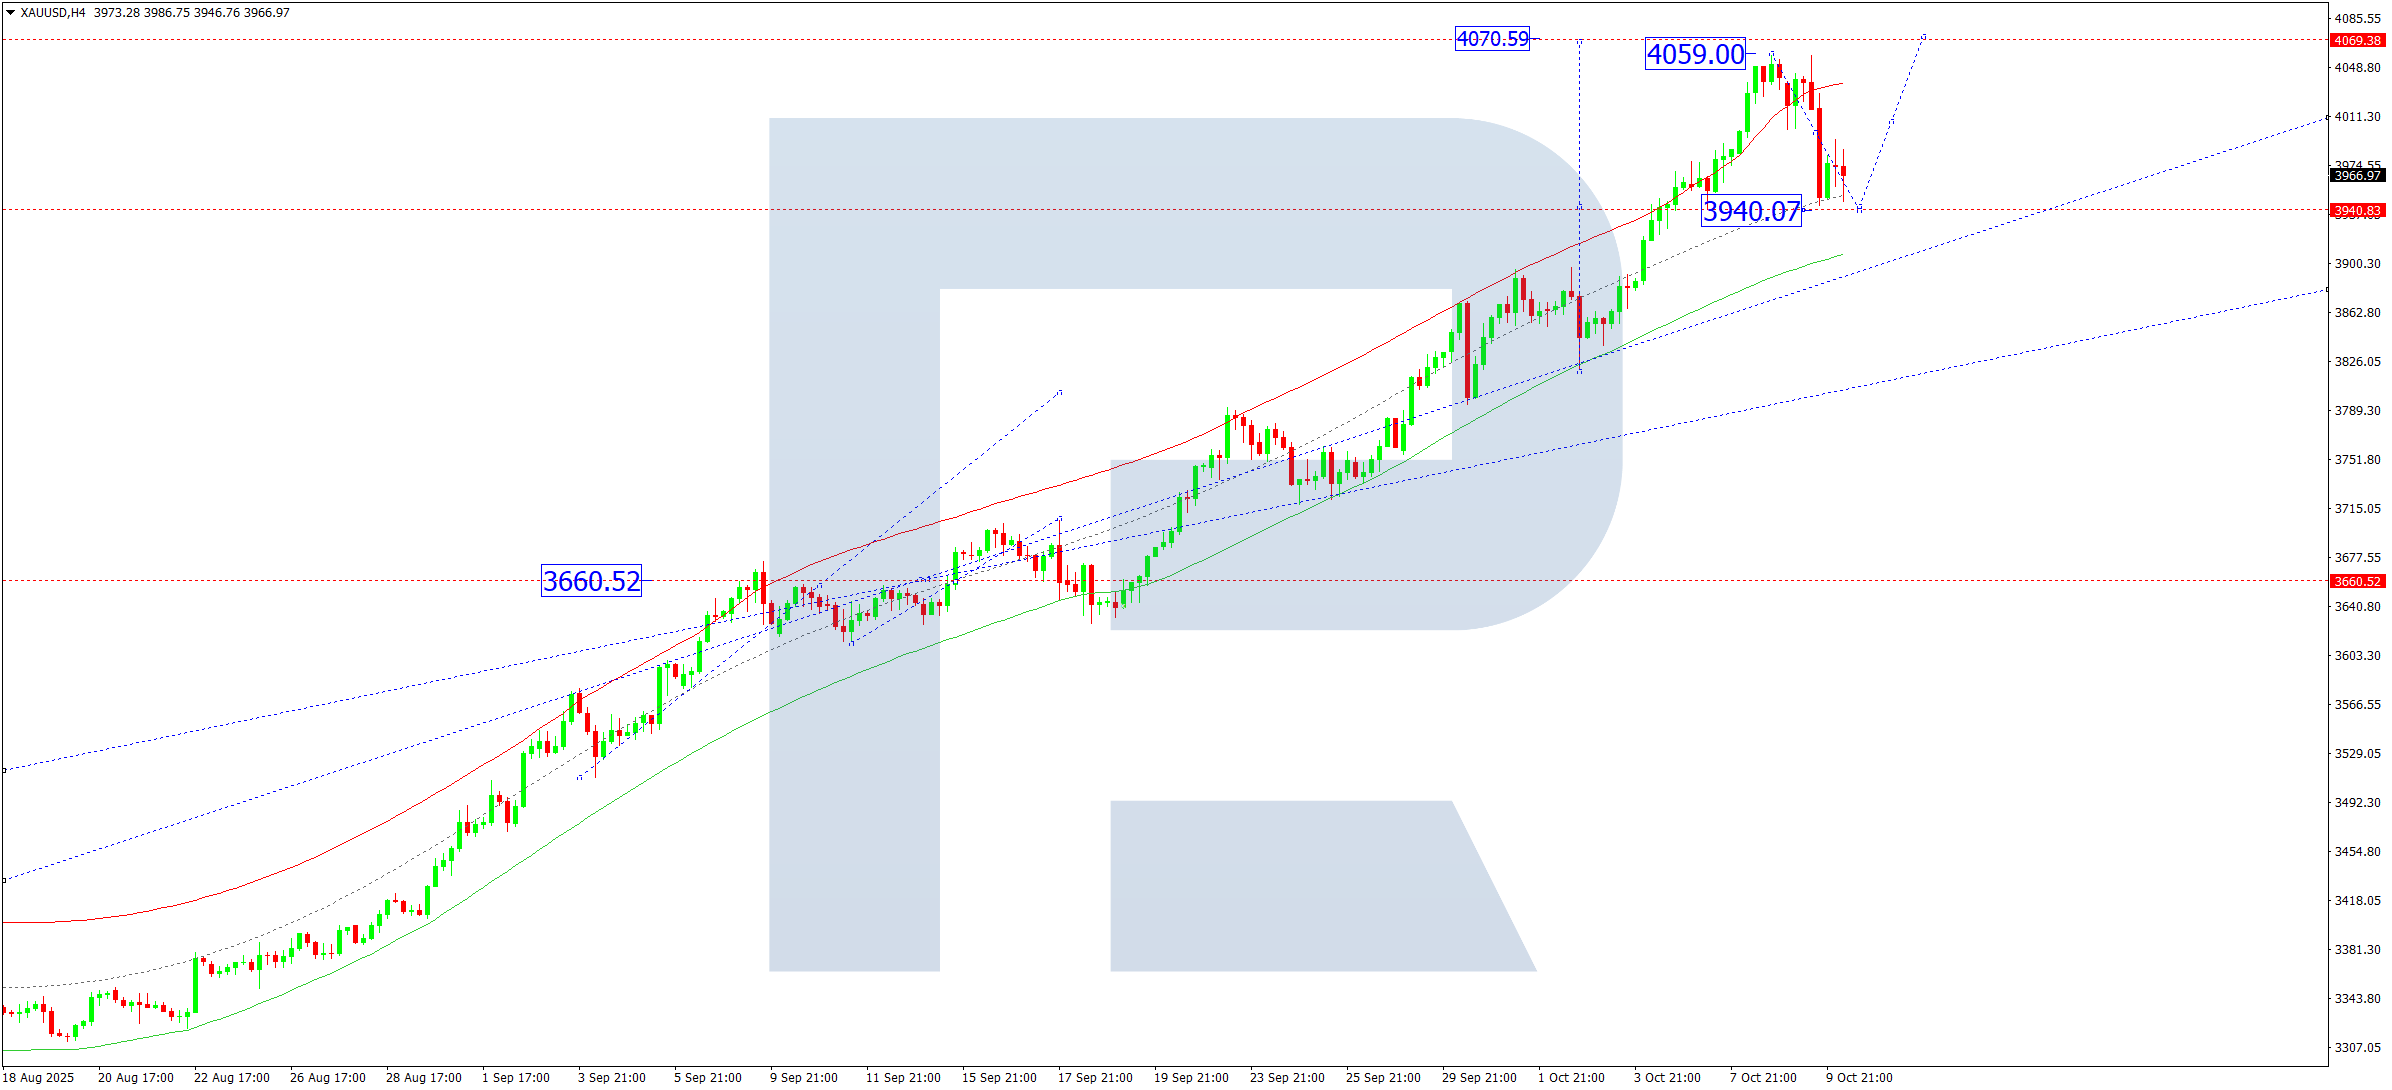
XAUUSD forecast
On the H4 chart of XAUUSD, the market completed a correction towards 3,945. On 10 October 2025, the price is expected to rise towards 4,000, followed by another corrective wave towards 3,940. After this correction ends, another upward wave towards 4,000 may start. A new consolidation range may form around 4,000. A breakout upwards would open the potential for an extension towards 4,070, while a downward breakout could trigger a correction towards 3,890.
Technically, this scenario is confirmed by the Elliott Wave structure and the upward wave matrix with the pivot point at 3,660, which is viewed as the key level in the XAUUSD structure. The market is forming an upward wave towards the upper boundary of the Price Envelope at 4,070, with a possible correction afterwards to the lower boundary at 3,890.
Technical indicators for today’s XAUUSD forecast indicate continued growth towards 4,070.
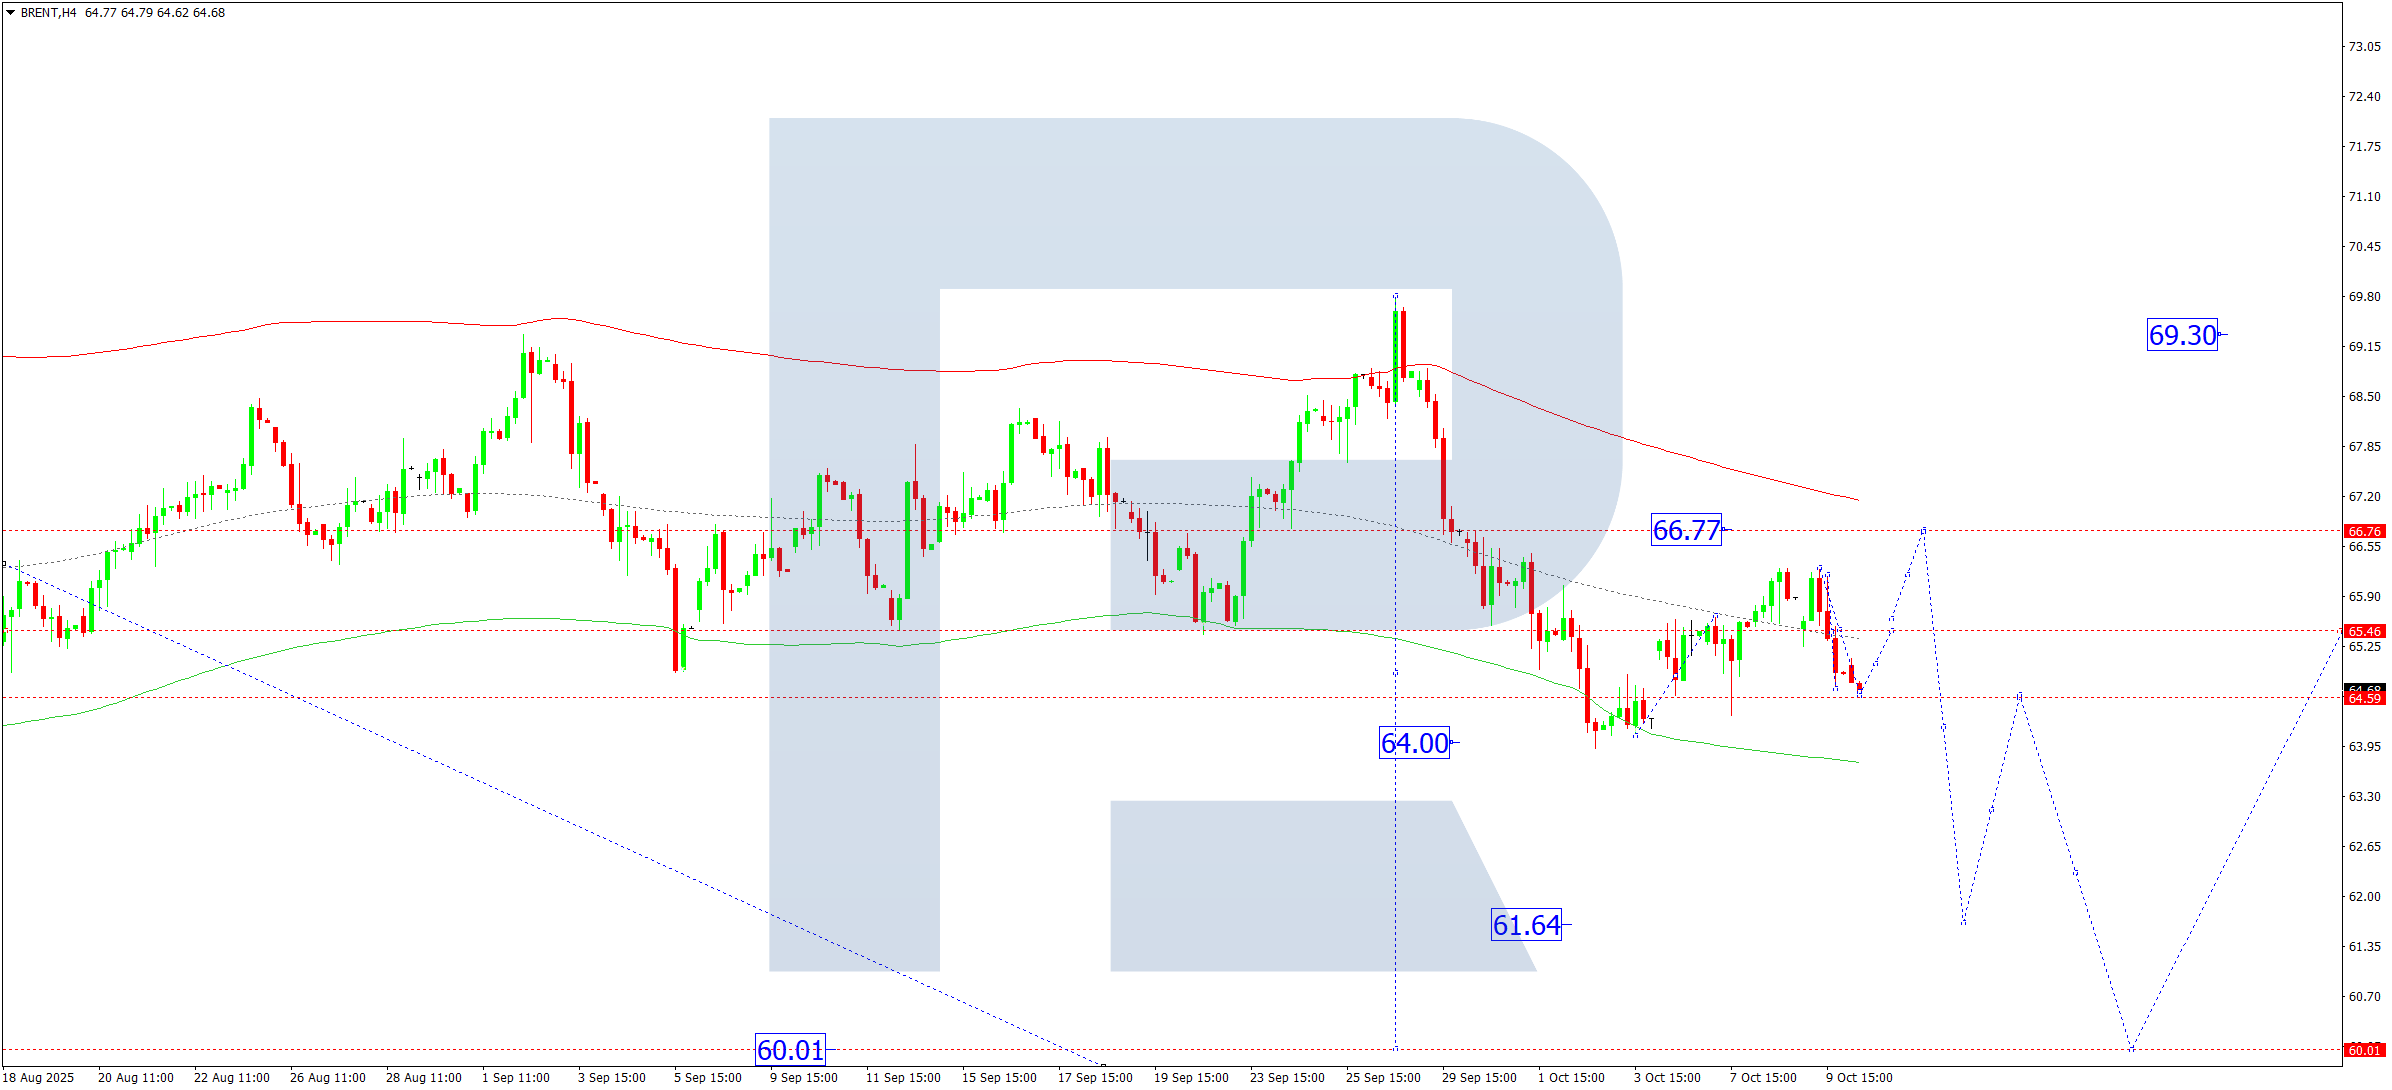
Brent forecast
On the H4 chart of Brent crude, the market completed a downward wave towards 64.64. On 10 October 2025, a corrective move towards 65.45 (testing from below) is expected. A consolidation range is forming around 65.45. A breakout upwards could open the potential for a rise towards 66.77, while a downward breakout would lead to a continuation of the trend towards 61.64, with an extended target at 60.00.
Technically, this scenario is confirmed by the Elliott Wave structure and the downward wave matrix with the pivot point at 65.45, the key level for Brent’s structure. The market is consolidating around the central line of the Price Envelope at 65.45. A correction towards the upper boundary at 66.77 remains possible, followed by a continuation of the wave towards the lower boundary at 61.64.
Technical indicators for today’s Brent forecast suggest potential growth towards 66.77.
Forecasts presented in this section only reflect the author’s private opinion and should not be considered as guidance for trading. RoboForex bears no responsibility for trading results based on trading recommendations described in these analytical reviews.