Daily technical analysis and forecast for 9 October 2025
Here is a detailed daily technical analysis and forecast for EURUSD, USDJPY, GBPUSD, AUDUSD, USDCAD, XAUUSD and Brent for 9 October 2025.
EURUSD forecast
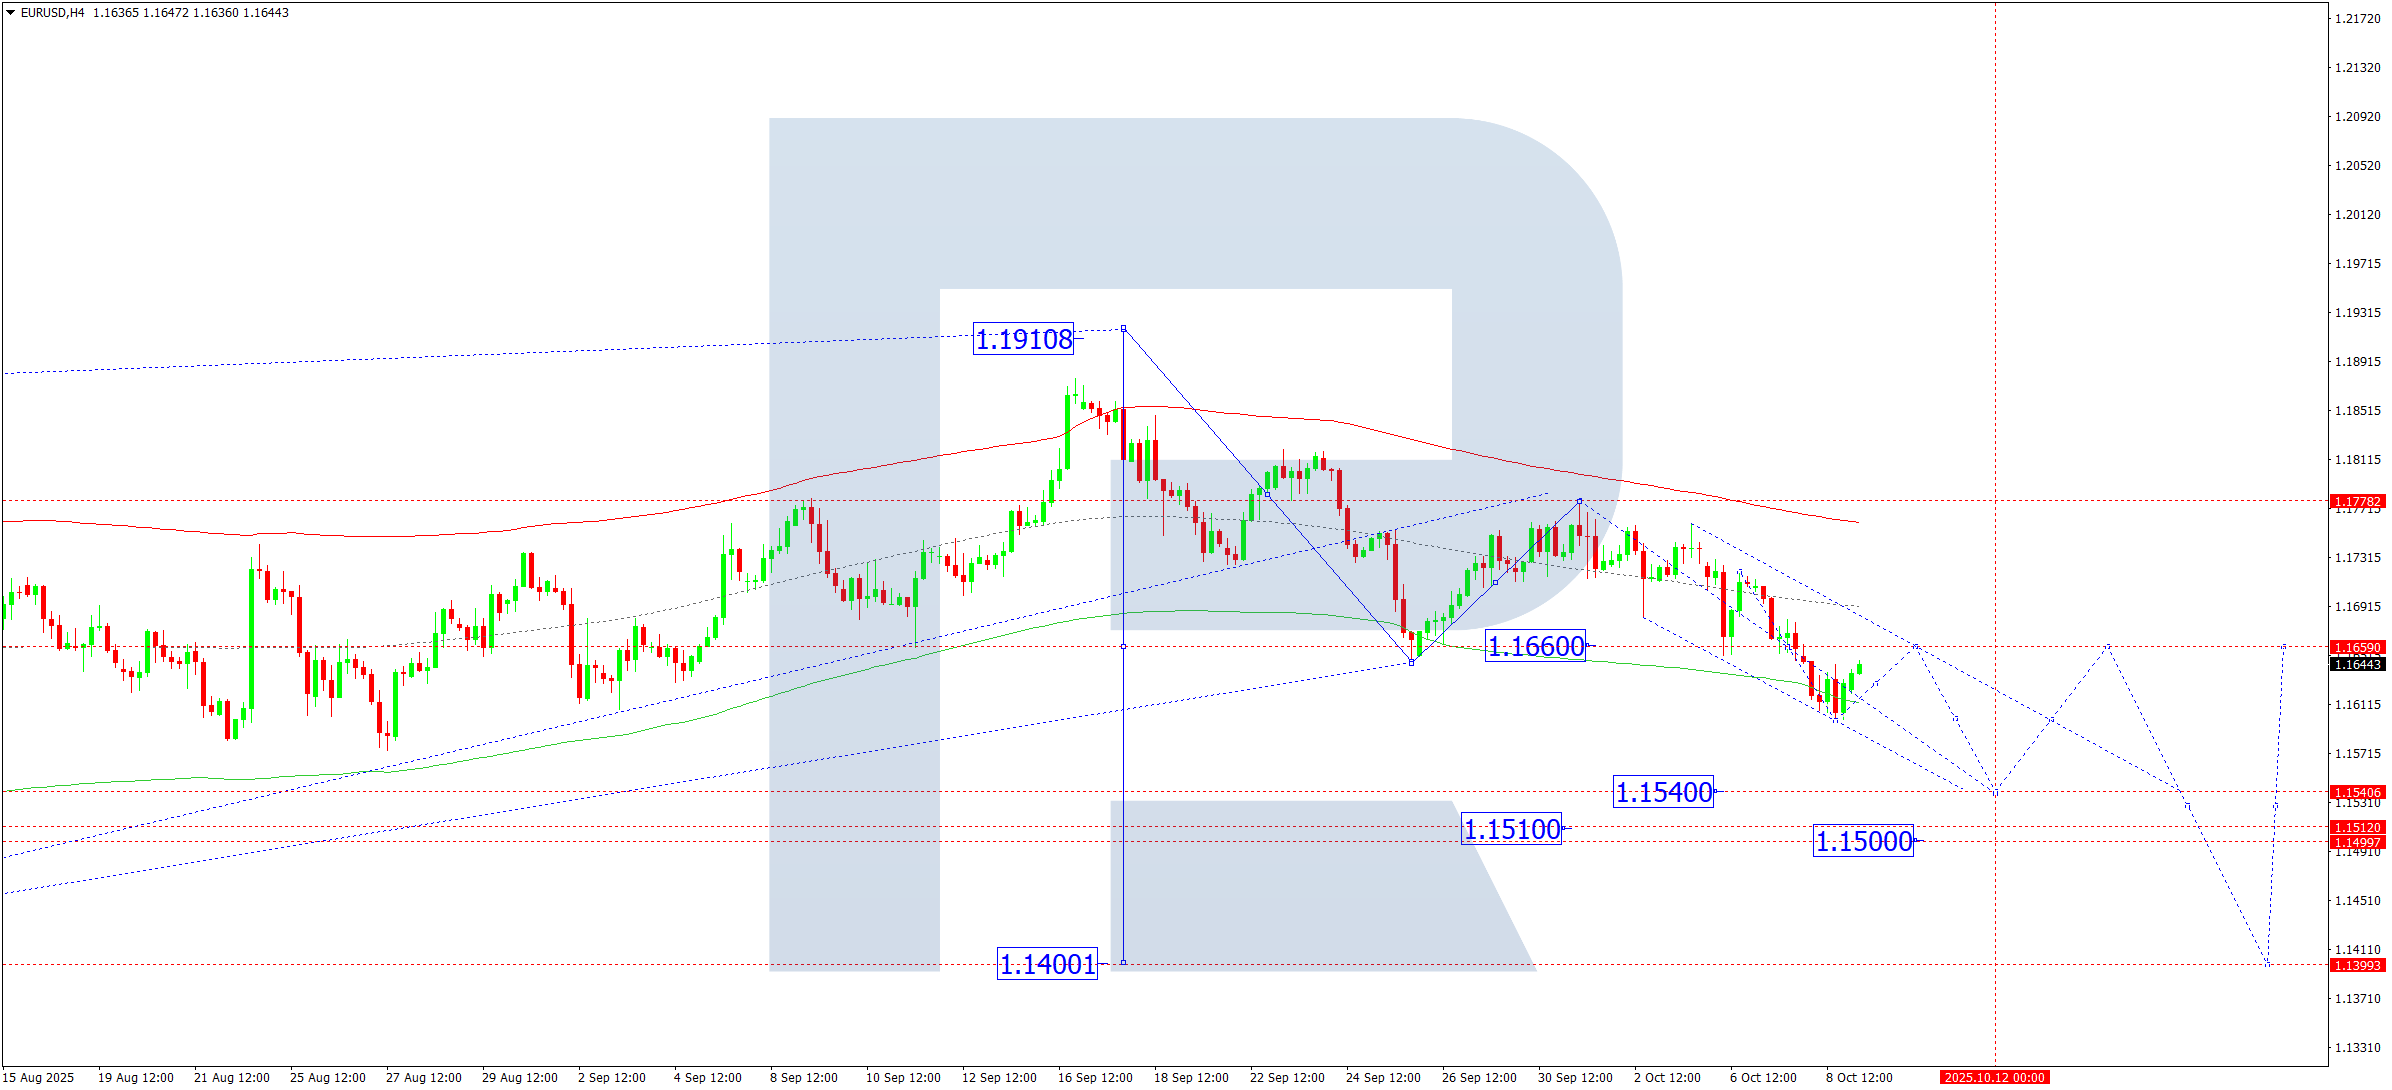
On the H4 chart of EURUSD, the market completed a downward wave towards 1.1598. A compact consolidation range has formed around 1.1660. On 9 October 2025, a corrective move towards 1.1660 (testing from below) is possible. Subsequently, the downtrend is expected to continue towards 1.1540, with a possible extension to 1.1500 as a local target.
Technically, this scenario is confirmed by the Elliott Wave structure and the downward wave matrix with the pivot point at 1.1660, which is viewed as a key level for EURUSD. The market is expected to decline towards the lower boundary of the Price Envelope at 1.1540, with a possible continuation of the trend towards 1.1400.
Technical indicators for today’s EURUSD forecast suggest the third downward wave towards 1.1540, at a minimum.
USDJPY forecast
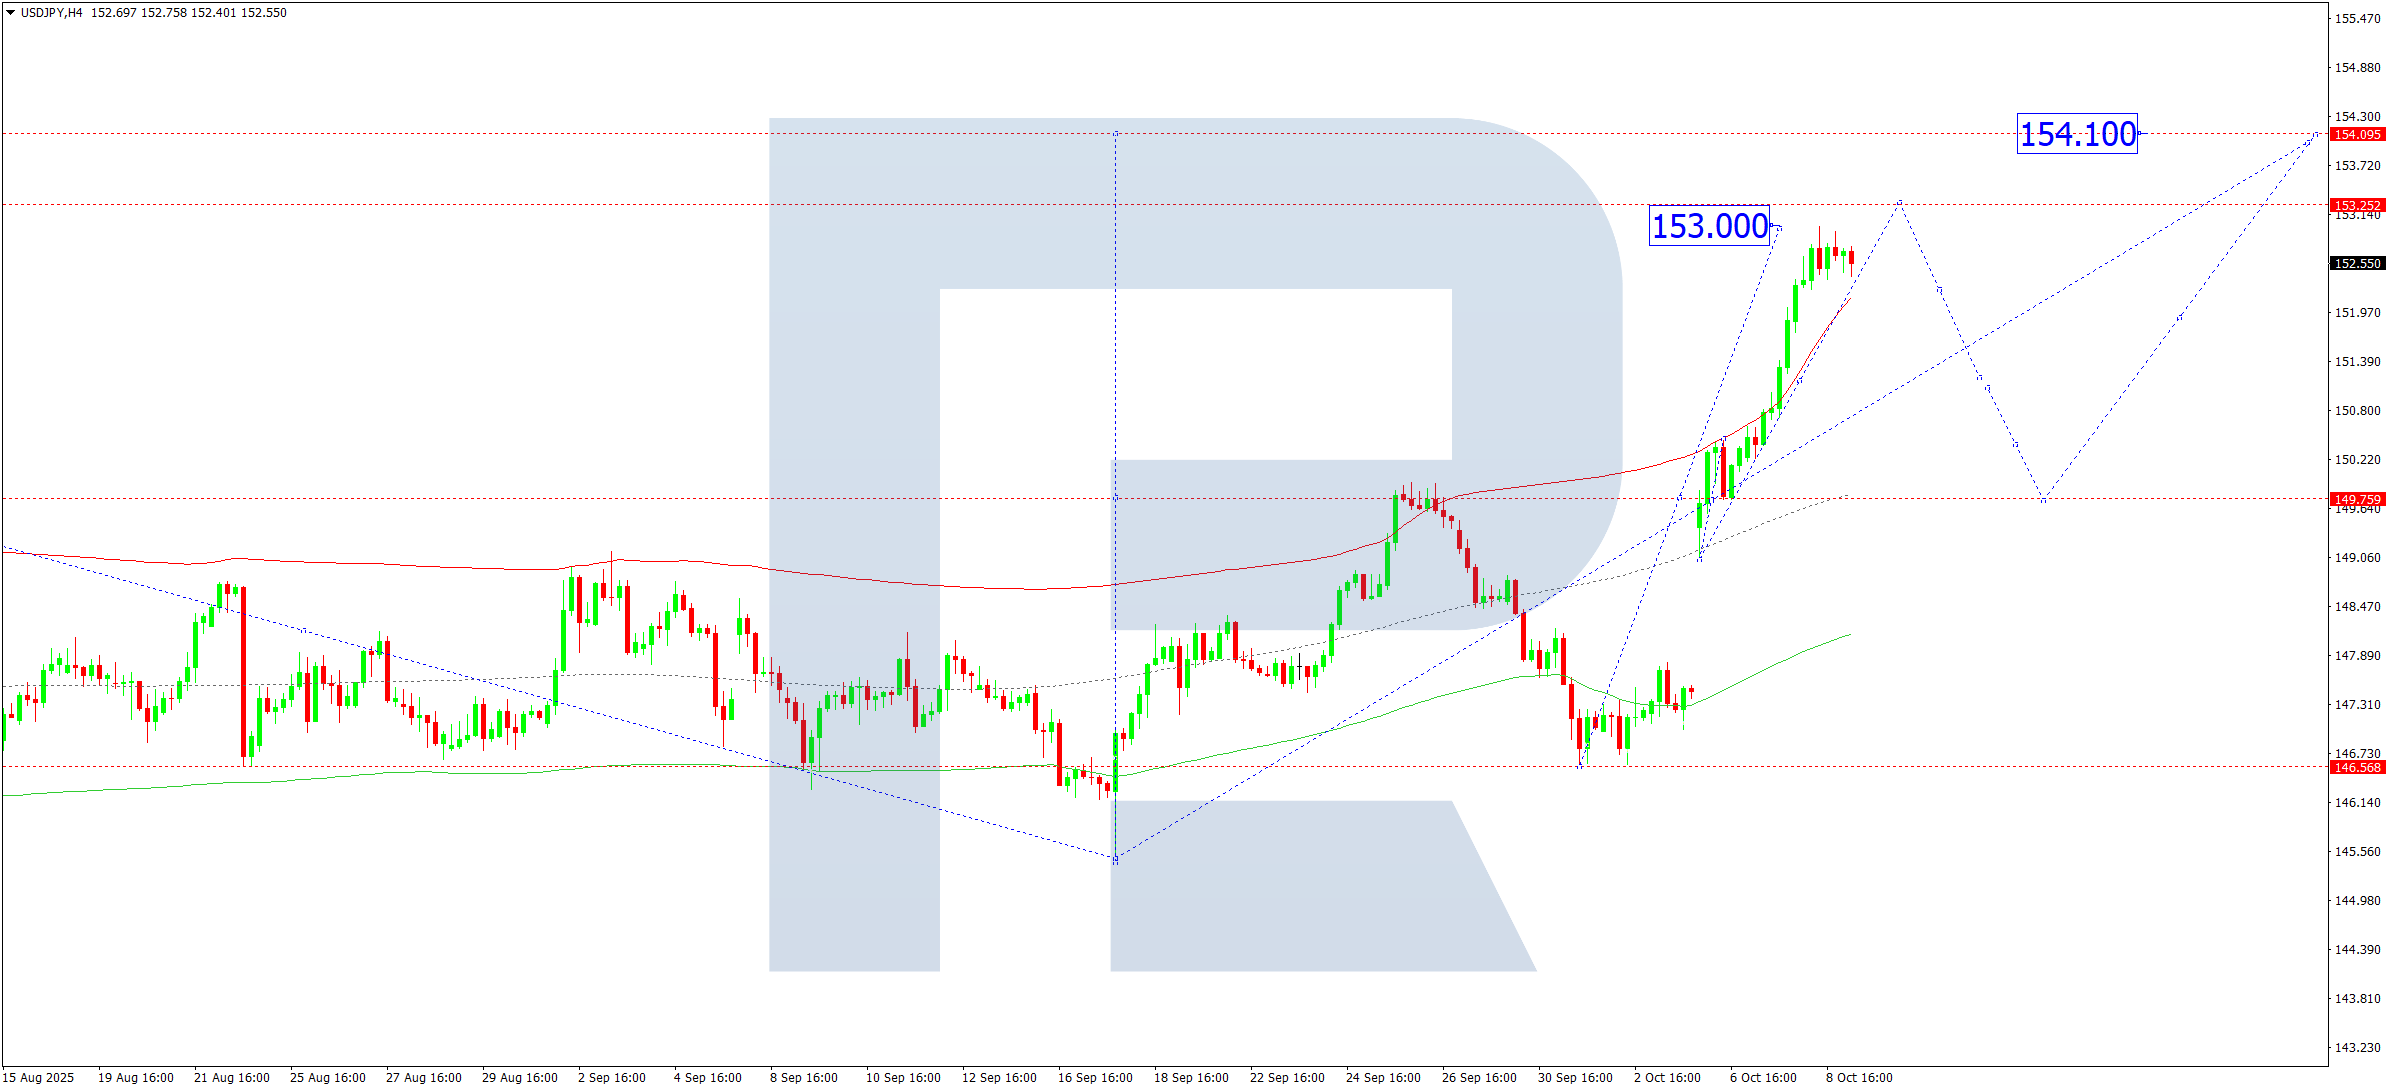
On the H4 chart of USDJPY, the market has completed an upward wave reaching 153.00. On 9 October 2025, a consolidation range is expected to form below this level, with a possible upward extension towards 153.25. If the price breaks downwards, a corrective move towards 149.76 may follow. If an upward breakout occurs, the uptrend could continue towards 154.10.
Technically, this scenario is confirmed by the Elliott Wave structure and the upward wave matrix with the pivot point at 149.76, the key level in this wave. The market continues to develop an upward move towards the upper boundary of the Price Envelope at 154.10, with prospects for trend continuation up to 156.90.
Technical indicators for today’s USDJPY forecast suggest potential growth towards 154.10 and 156.90.
GBPUSD forecast
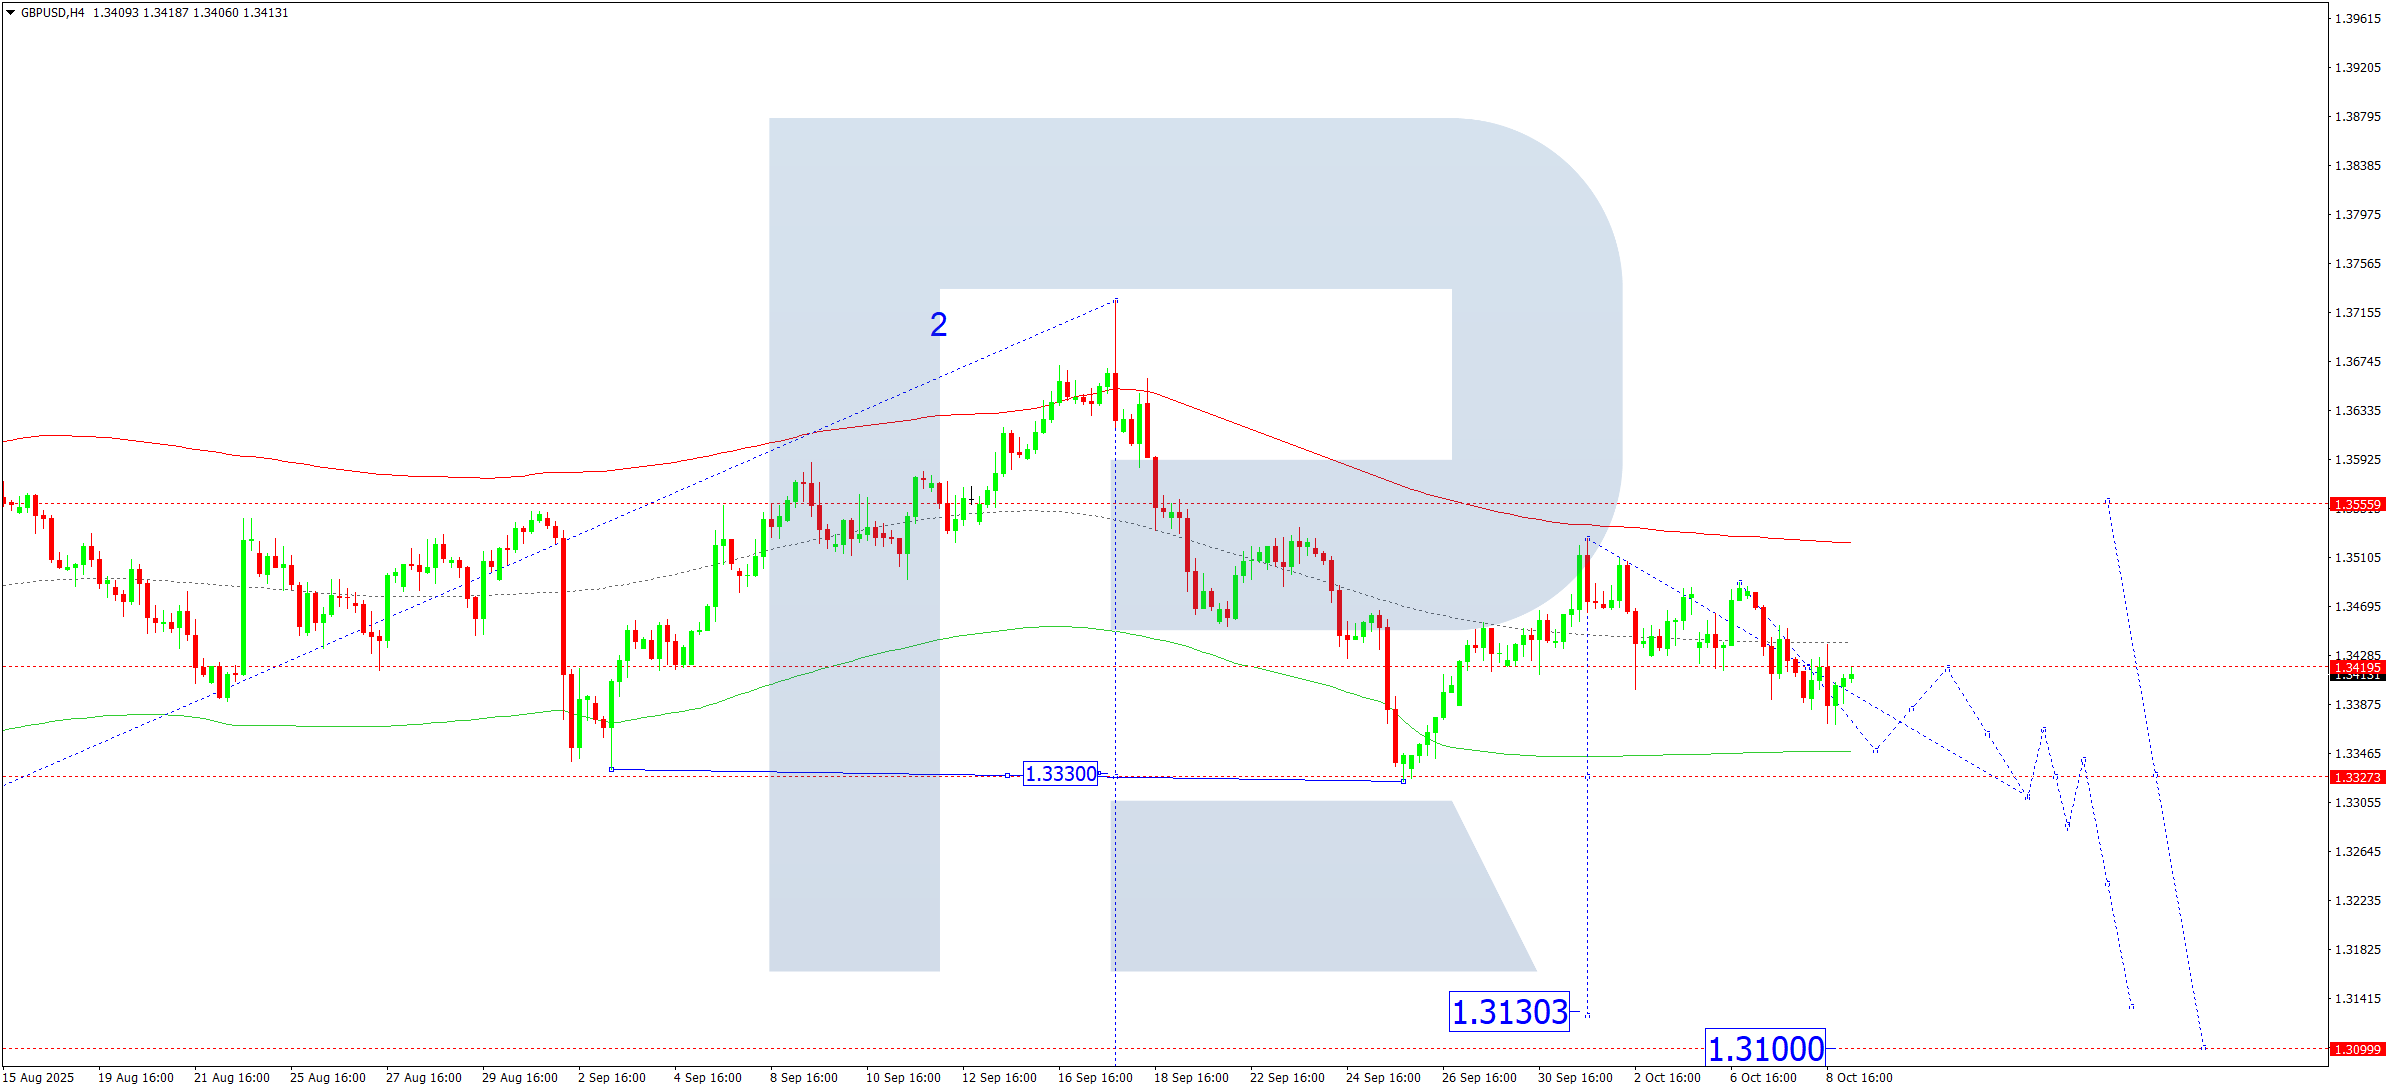
On the H4 chart of GBPUSD, the market has formed a consolidation range around 1.3420. On 9 October 2025, the range has extended down to 1.3370, followed by a potential retest of 1.3420 from below. Afterwards, a new downward wave towards 1.3344 may begin, with further continuation to 1.3311.
Technically, this scenario is confirmed by the Elliott Wave structure and the downward wave matrix with the pivot point at 1.3420, the key level for this wave. The market is currently consolidating around the central line of the Price Envelope at 1.3420. A breakout to the downside opens the potential for a continued move towards the lower boundary at 1.3344, with prospects for an extension to 1.3311.
Technical indicators for today’s GBPUSD forecast suggest a continued downward movement towards 1.3344 and 1.3311.
AUDUSD forecast
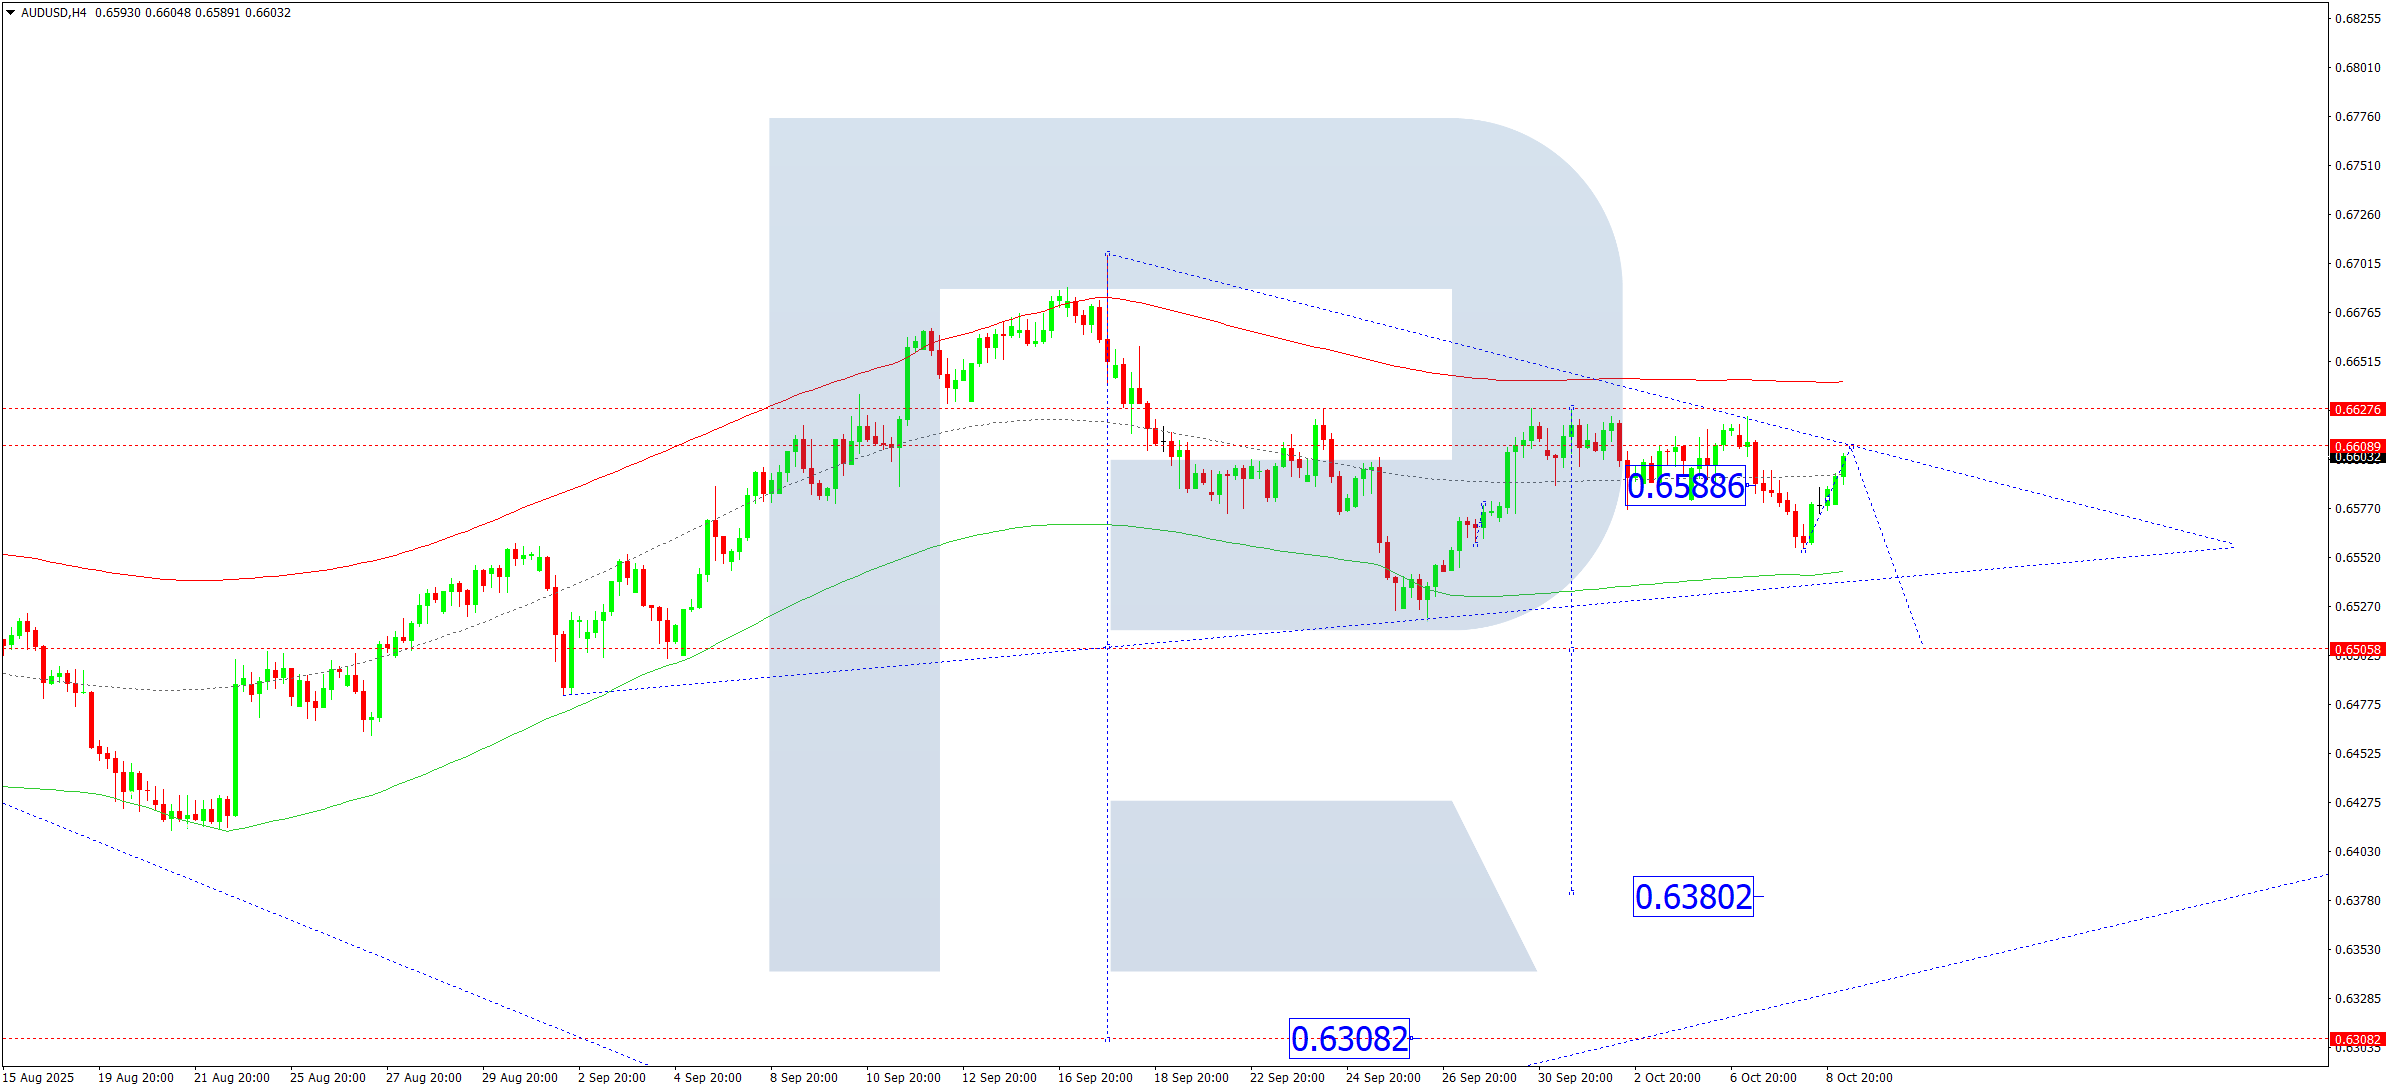
On the H4 chart of AUDUSD, the market has formed a consolidation range below 0.6627. On 9 October 2025, the range expanded downwards to 0.6555. A corrective move towards 0.6600 is possible, followed by the beginning of a new downward wave towards 0.6500.
Technically, this scenario is confirmed by the Elliott Wave structure and the downward wave matrix with the pivot point at 0.6633, which acts as a key level in the current structure. The market continues its decline towards the lower boundary of the Price Envelope at 0.6500. A breakout below this level could open the potential for a continued downtrend towards 0.6380.
Technical indicators for today’s AUDUSD forecast suggest further downside potential towards 0.6500.
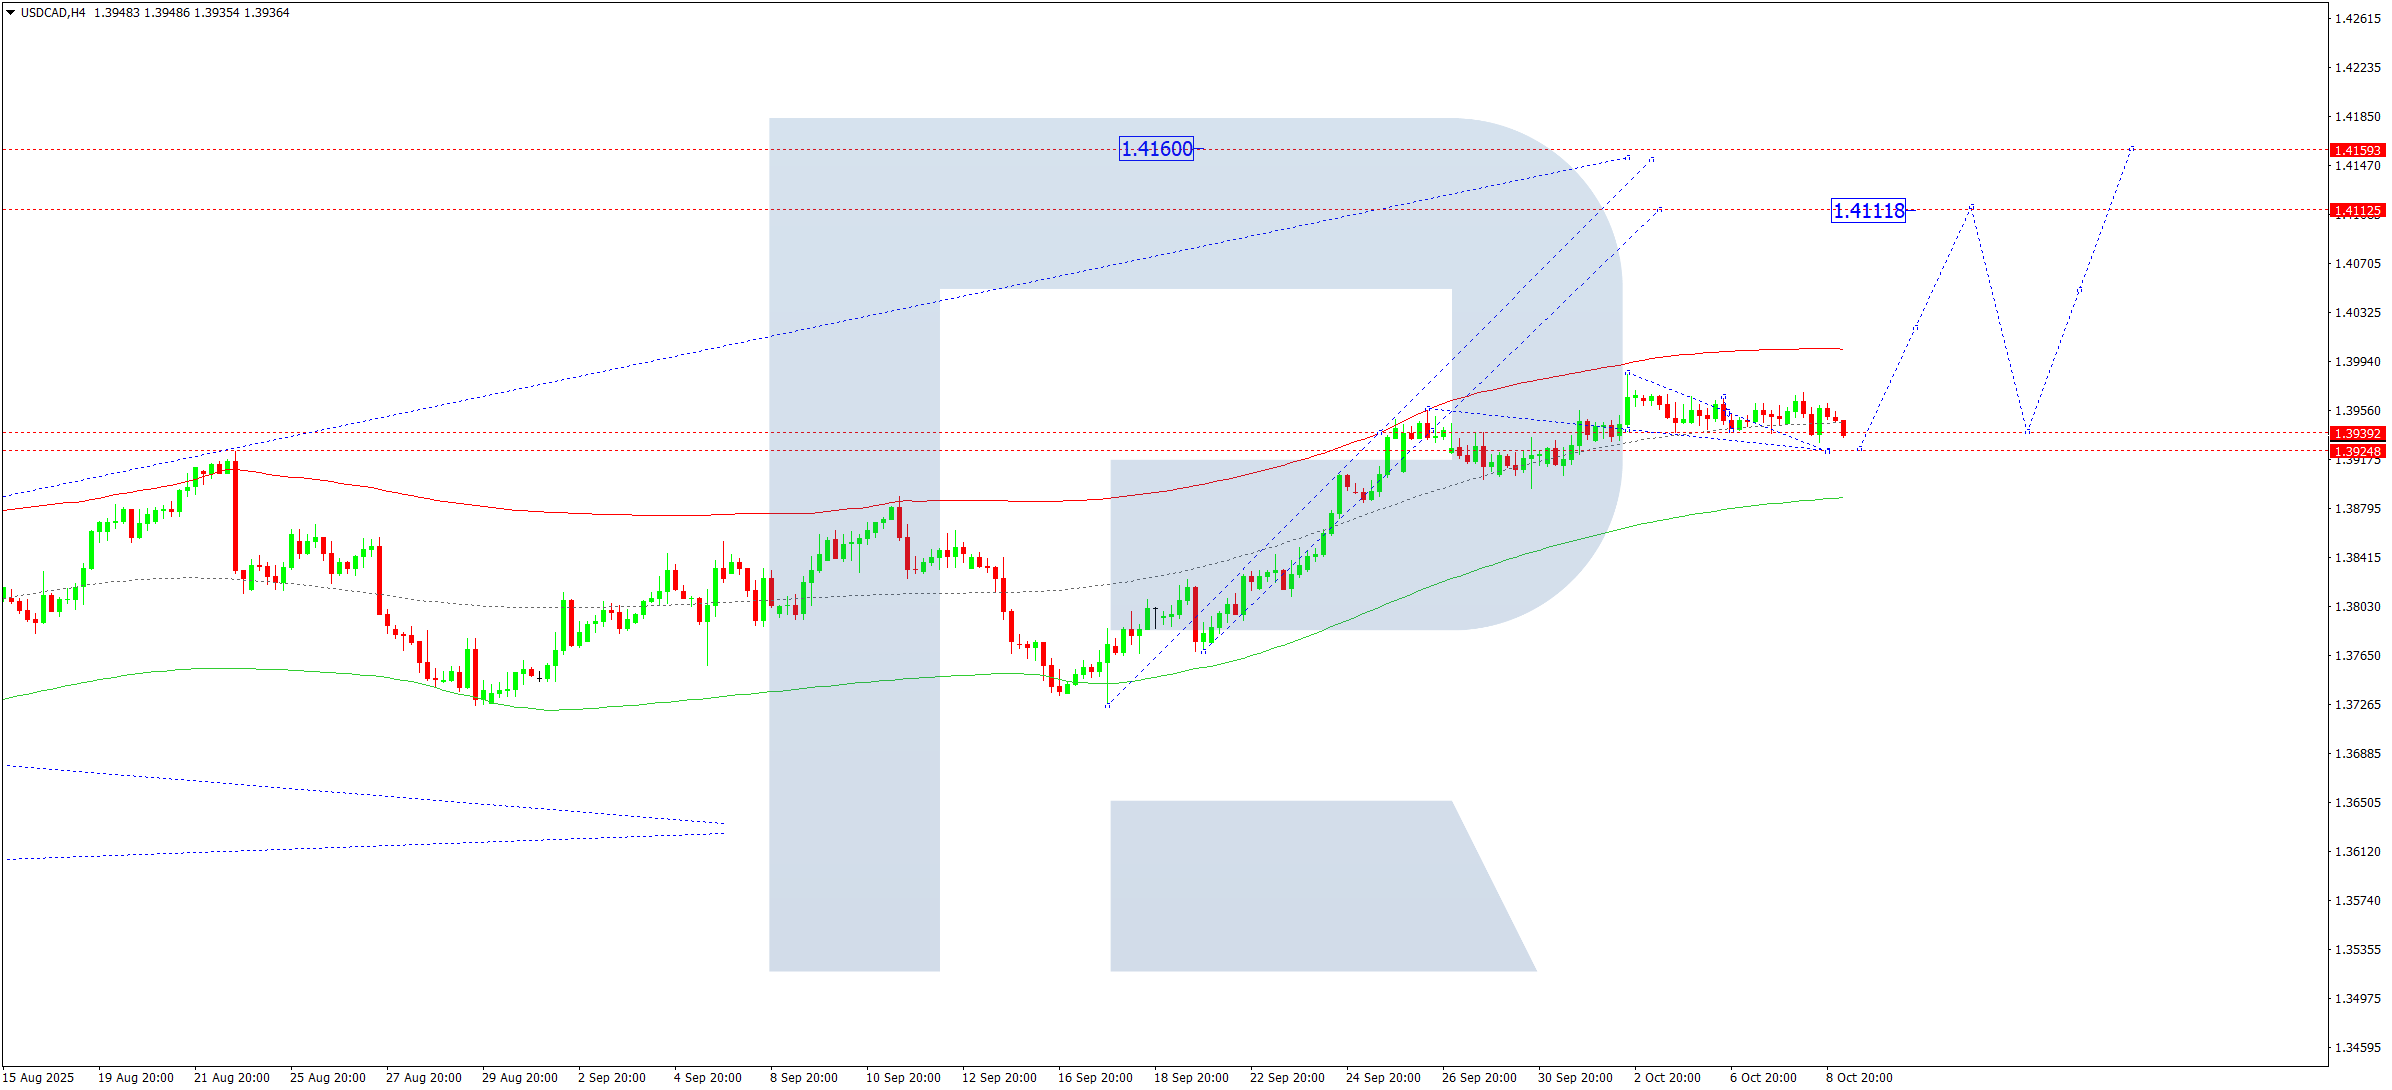
USDCAD forecast
On the H4 chart of USDCAD, the market continues to develop a consolidation range around 1.3955. On 9 October 2025, a minor decline towards 1.3925 is possible. Subsequently, an upward movement towards 1.4010 may begin, with prospects for continuation towards 1.4111.
Technically, this scenario is confirmed by the Elliott Wave structure and the upward wave matrix with the pivot point at 1.3939, which is the key level for this wave. The market is developing an upward structure towards the upper boundary of the Price Envelope at 1.4111. After reaching this level, a correction towards the central line at 1.3930 (testing from above) is possible, followed by another upward wave towards 1.4160.
Technical indicators for today’s USDCAD forecast point to potential growth towards 1.4111 and 1.4160.
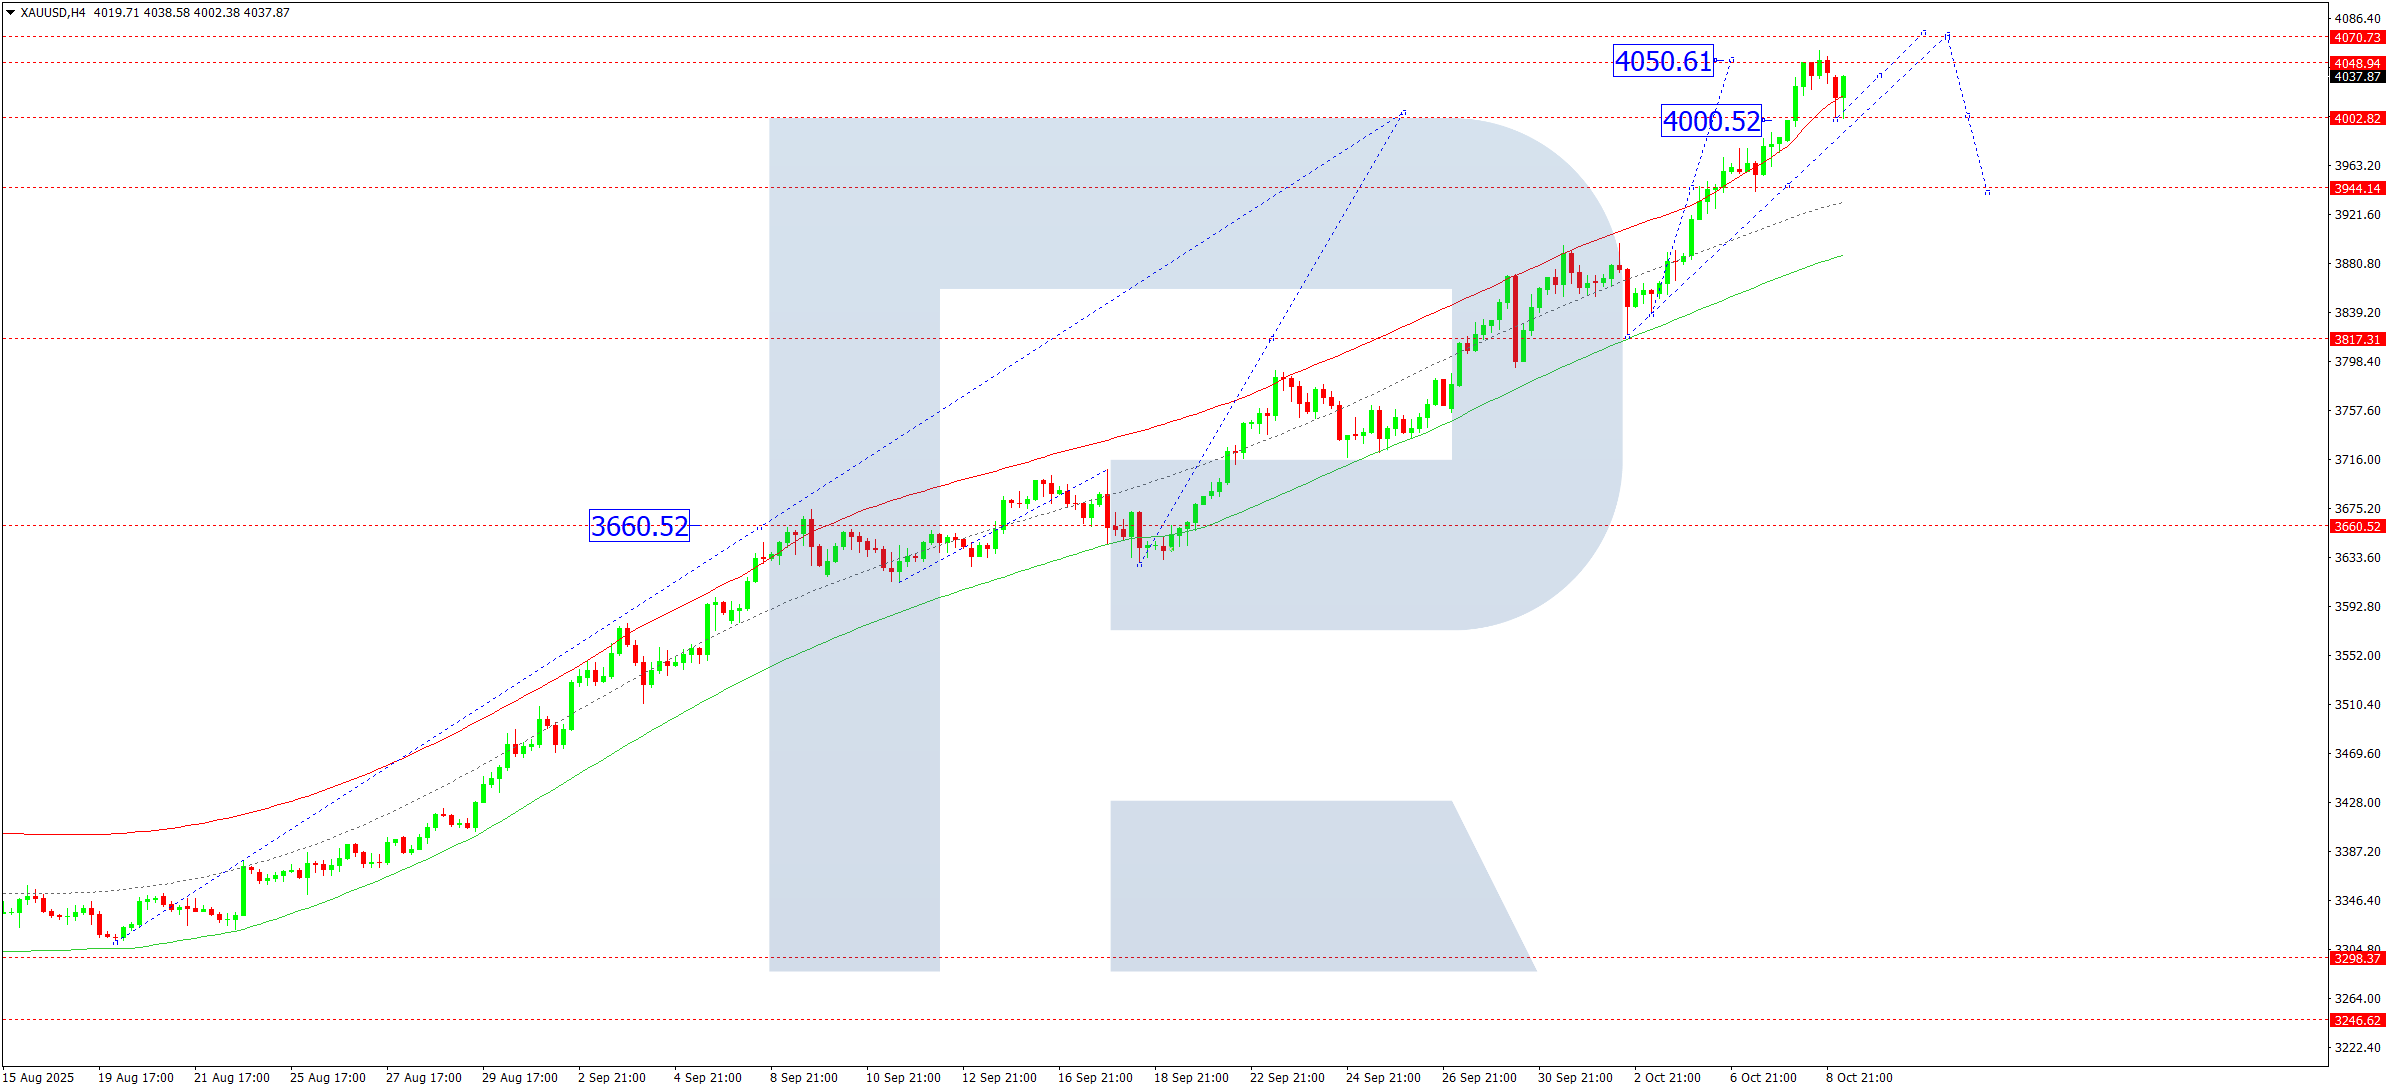
XAUUSD forecast
On the H4 chart of XAUUSD, the market has completed an upward wave towards 4,059. On 9 October 2025, a corrective decline towards 4,000 is expected, followed by another upward wave towards 4,070.
Technically, this scenario is confirmed by the Elliott Wave structure and the upward wave matrix with the pivot point at 3,660, which serves as a key level in this wave. The market is developing an upward structure towards the upper boundary of the Price Envelope at 4,070. Later, a corrective movement towards the central line at 3,944 may follow.
Technical indicators for today’s XAUUSD forecast suggest continued growth towards 4,070.
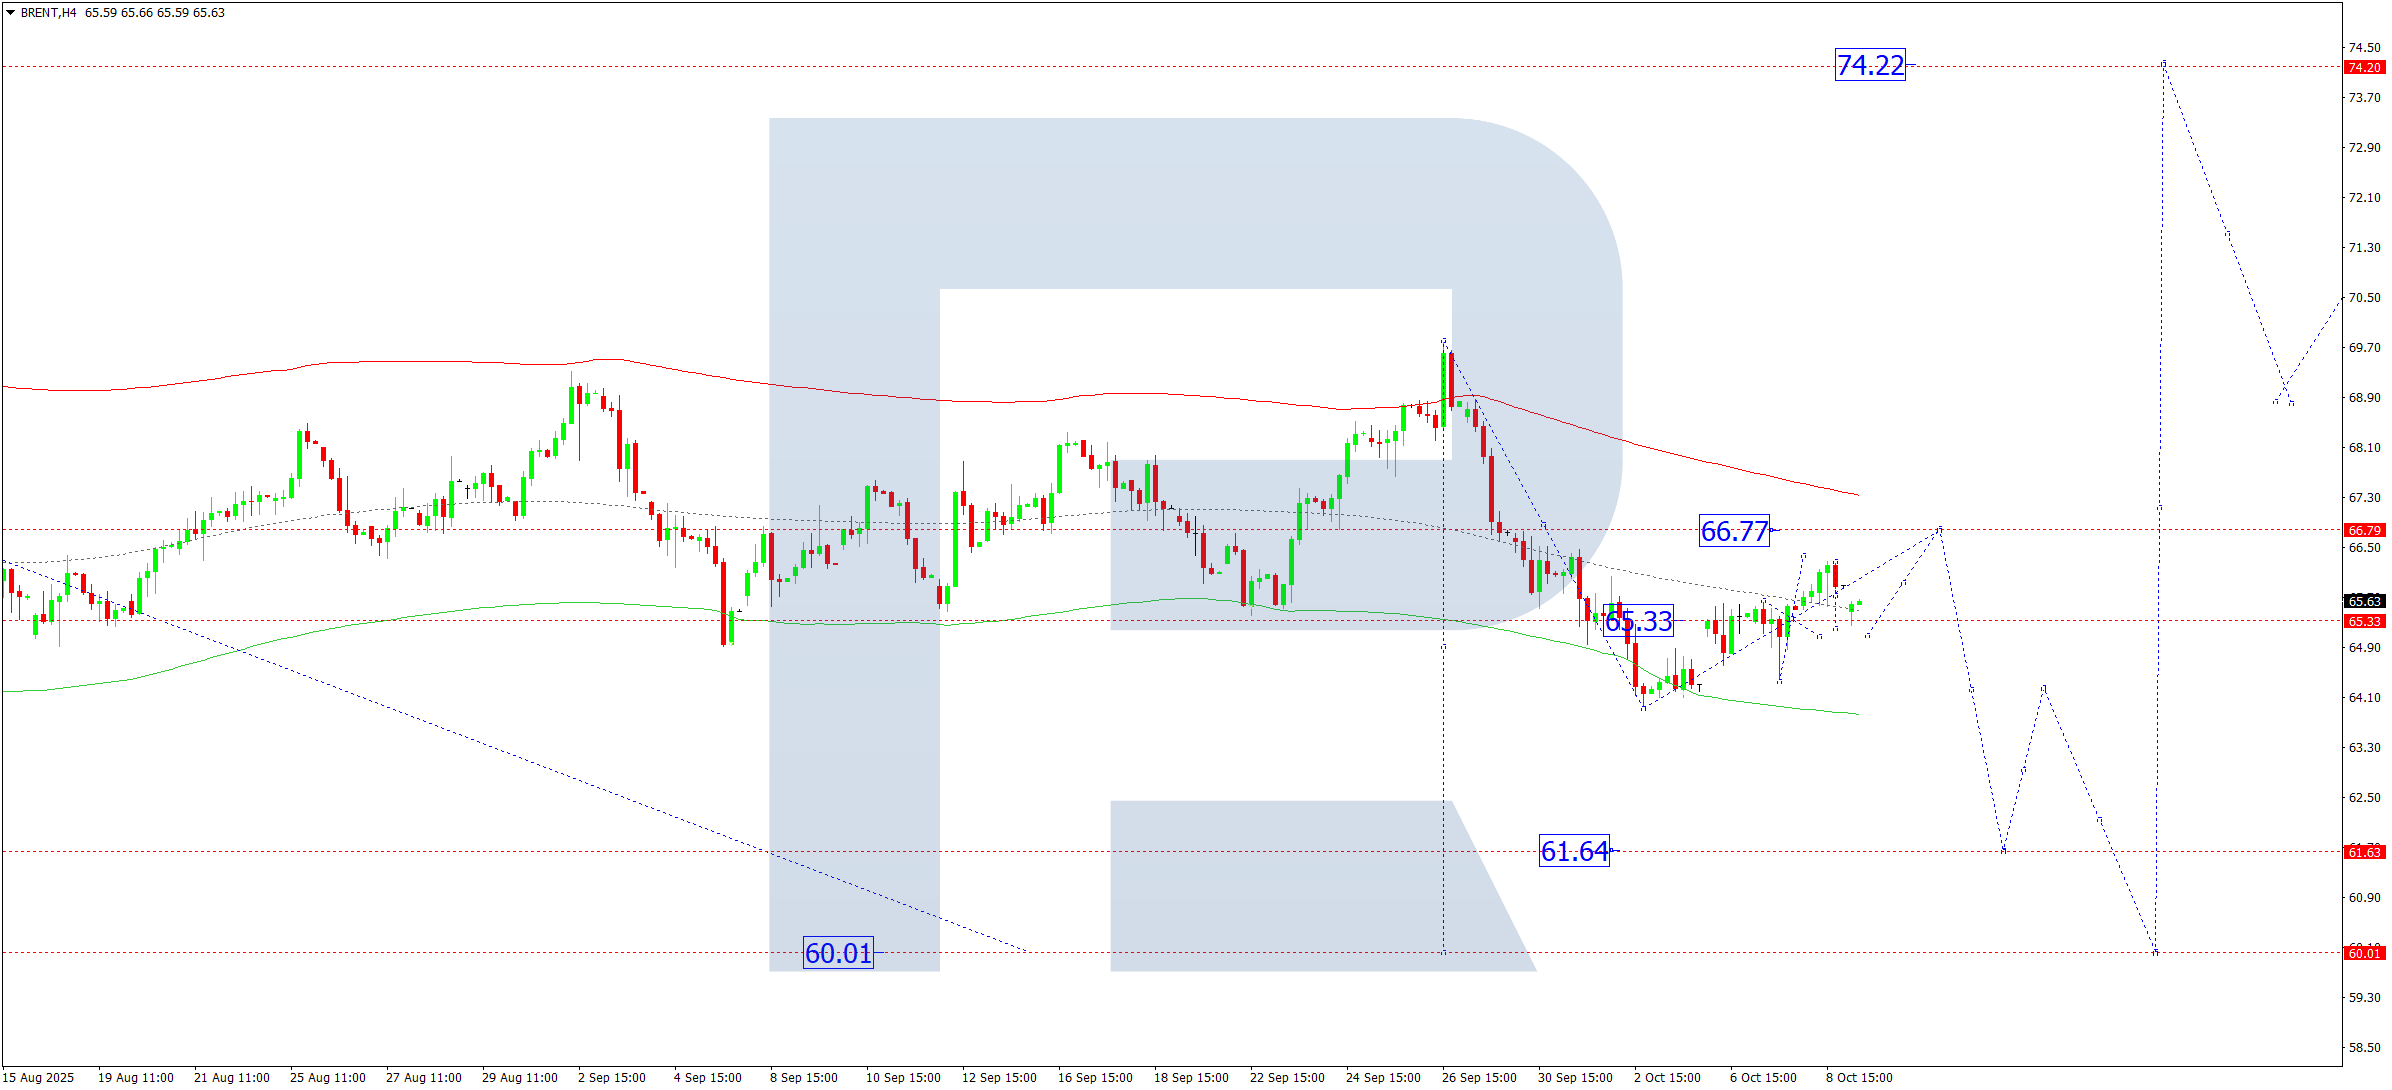
Brent forecast
On the H4 chart of Brent crude, the market has formed a consolidation range around 65.33. On 9 October 2025, the range expanded upwards to 66.28 and downwards to 65.25. The price is expected to rise towards 66.77, followed by a correction to 65.33. A breakout below this level may lead to a continuation of the wave towards 61.64. If the price rises and breaks above 67.00, potential opens for an extension of the upward wave towards 74.22.
Technically, this scenario is confirmed by the Elliott Wave structure and the downward wave matrix with the pivot point at 66.77, which is the key level for Brent’s structure. The market has previously completed a downward move towards the lower boundary of the Price Envelope at 64.00. Further correction towards the upper boundary at 66.77 remains likely, followed by a continued decline towards the lower boundary at 61.64.
Technical indicators for today’s Brent forecast suggest potential growth towards 66.77.
Forecasts presented in this section only reflect the author’s private opinion and should not be considered as guidance for trading. RoboForex bears no responsibility for trading results based on trading recommendations described in these analytical reviews.