Daily technical analysis and forecast for 6 October 2025
Here is a detailed daily technical analysis and forecast for EURUSD, USDJPY, GBPUSD, AUDUSD, USDCAD, XAUUSD and Brent for 6 October 2025.
EURUSD forecast
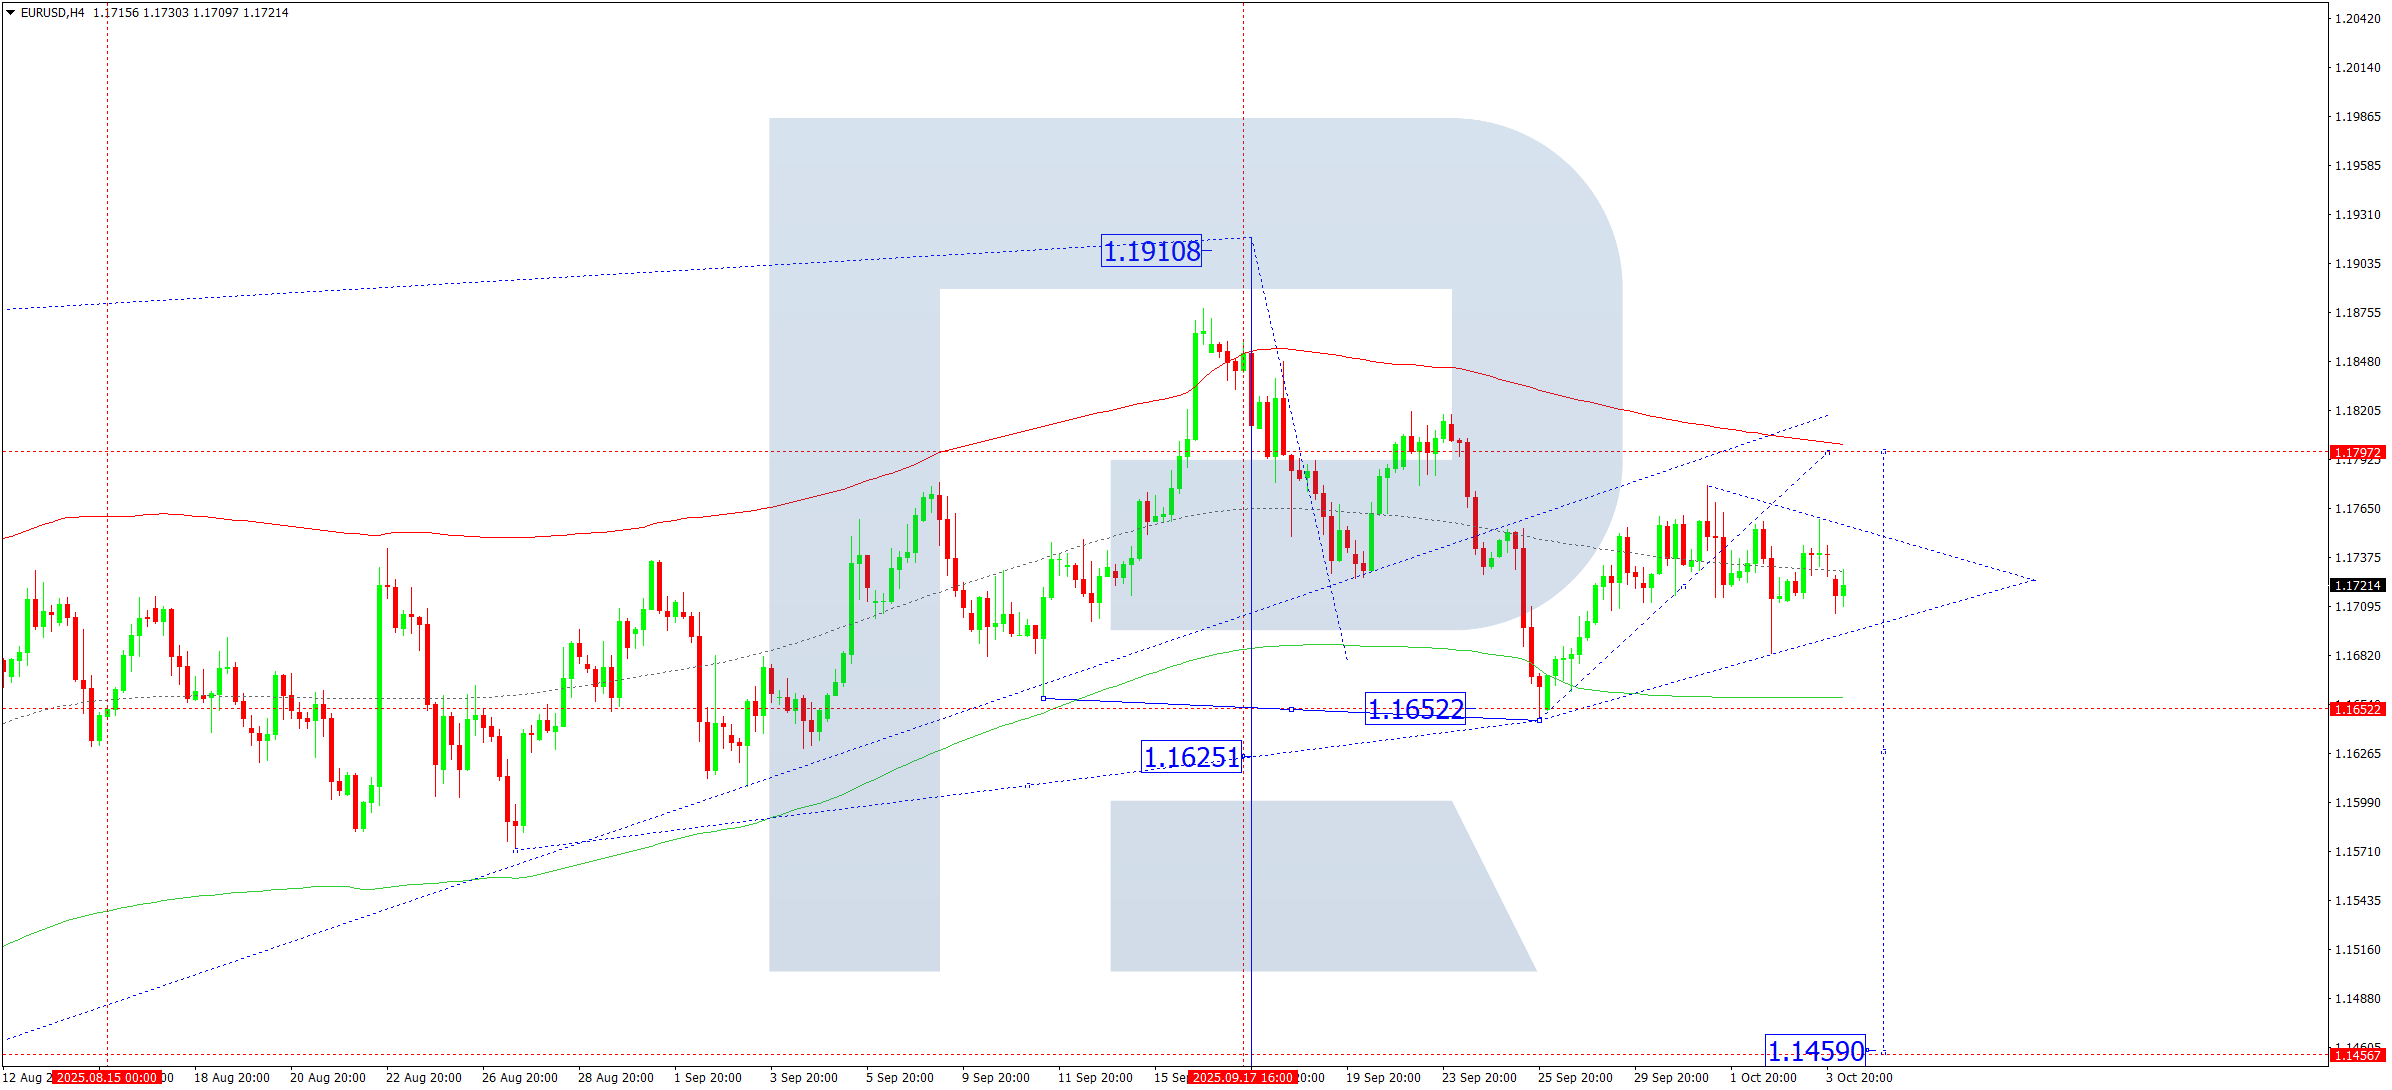
On the H4 chart of EURUSD, the market continues to develop a downward wave towards 1.1652. On 6 October 2025, the pair is likely to reach this target level. If the price breaks below the 1.1650 level, the decline could extend to 1.1625, with a possible continuation of the downtrend towards 1.1460 as a local target. Should the price rise to 1.1750 and break above it, another corrective wave towards 1.1790 may form, followed by a decline towards 1.1460.
Technically, this scenario is confirmed by the Elliott Wave structure and the wave matrix with the pivot point at 1.1786, which acts as a key level in the current structure. The market is expected to consolidate around the central line of the Price Envelope at 1.1720. A further correction towards the upper boundary at 1.1790 cannot be ruled out, followed by a decline to the lower boundary at 1.1625 and a potential continuation of the trend towards 1.1460.
Technical indicators for today’s EURUSD forecast suggest a downward movement towards 1.1625.
USDJPY forecast
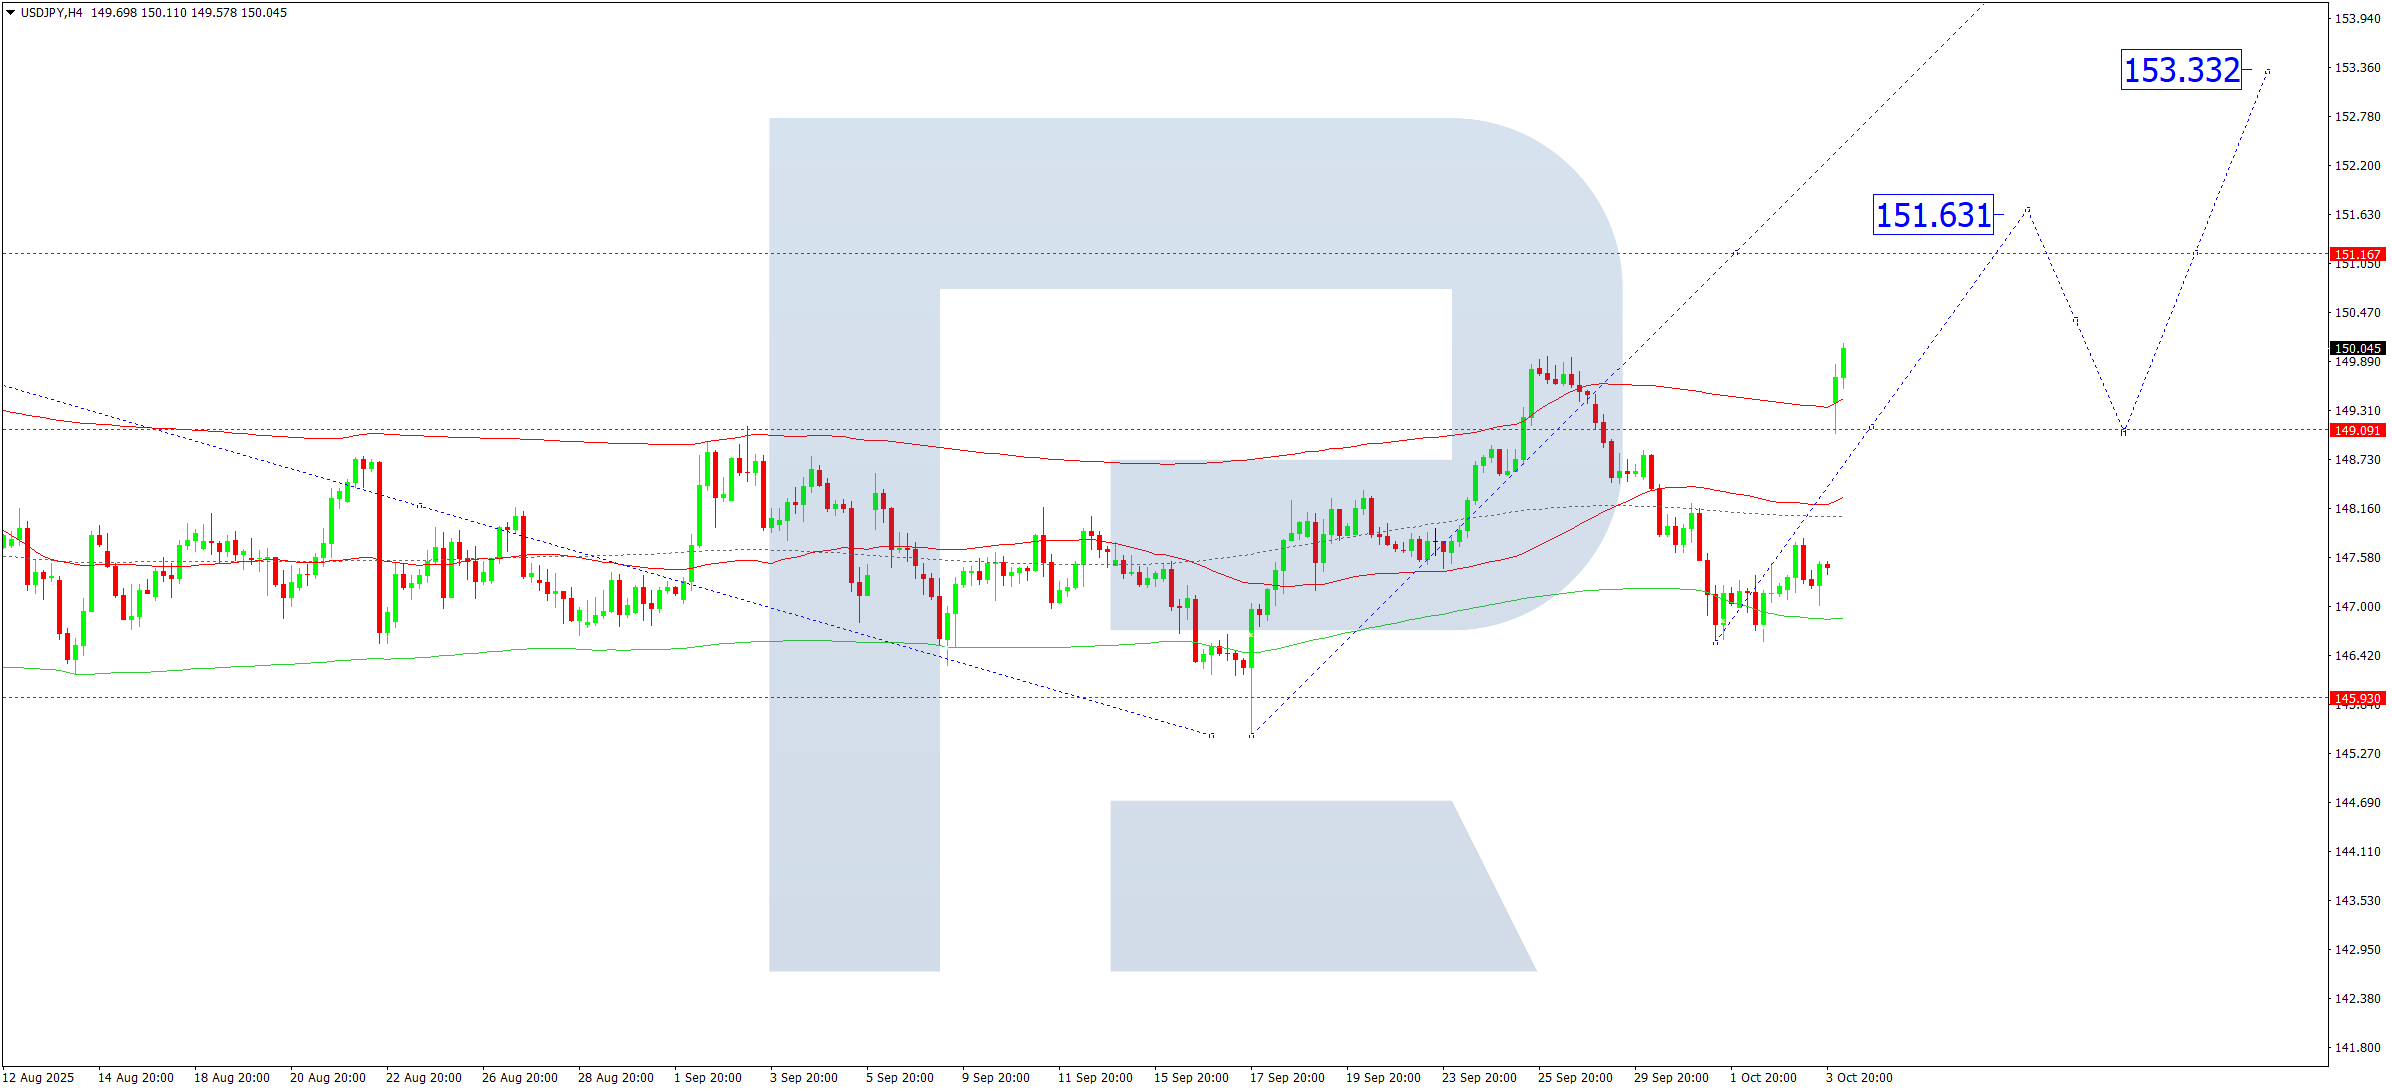
On the H4 chart of USDJPY, the market has broken above 149.00 and continues to develop an upward wave towards 151.63. On 6 October 2025, the pair is expected to reach this target level. A narrow consolidation range may then form near this level. A breakout upwards would open potential for further growth towards 153.33 as a local target.
Technically, this scenario is confirmed by the Elliott Wave structure and the wave matrix with the pivot point at 147.75, which is the key level for this wave. The market previously tested the lower boundary of the Price Envelope at 146.58. Currently, the focus is on a potential rise towards the upper boundary at 151.63, with further growth towards 153.33.
Technical indicators for today’s USDJPY forecast point to potential growth towards 151.63 and 153.33.
GBPUSD forecast
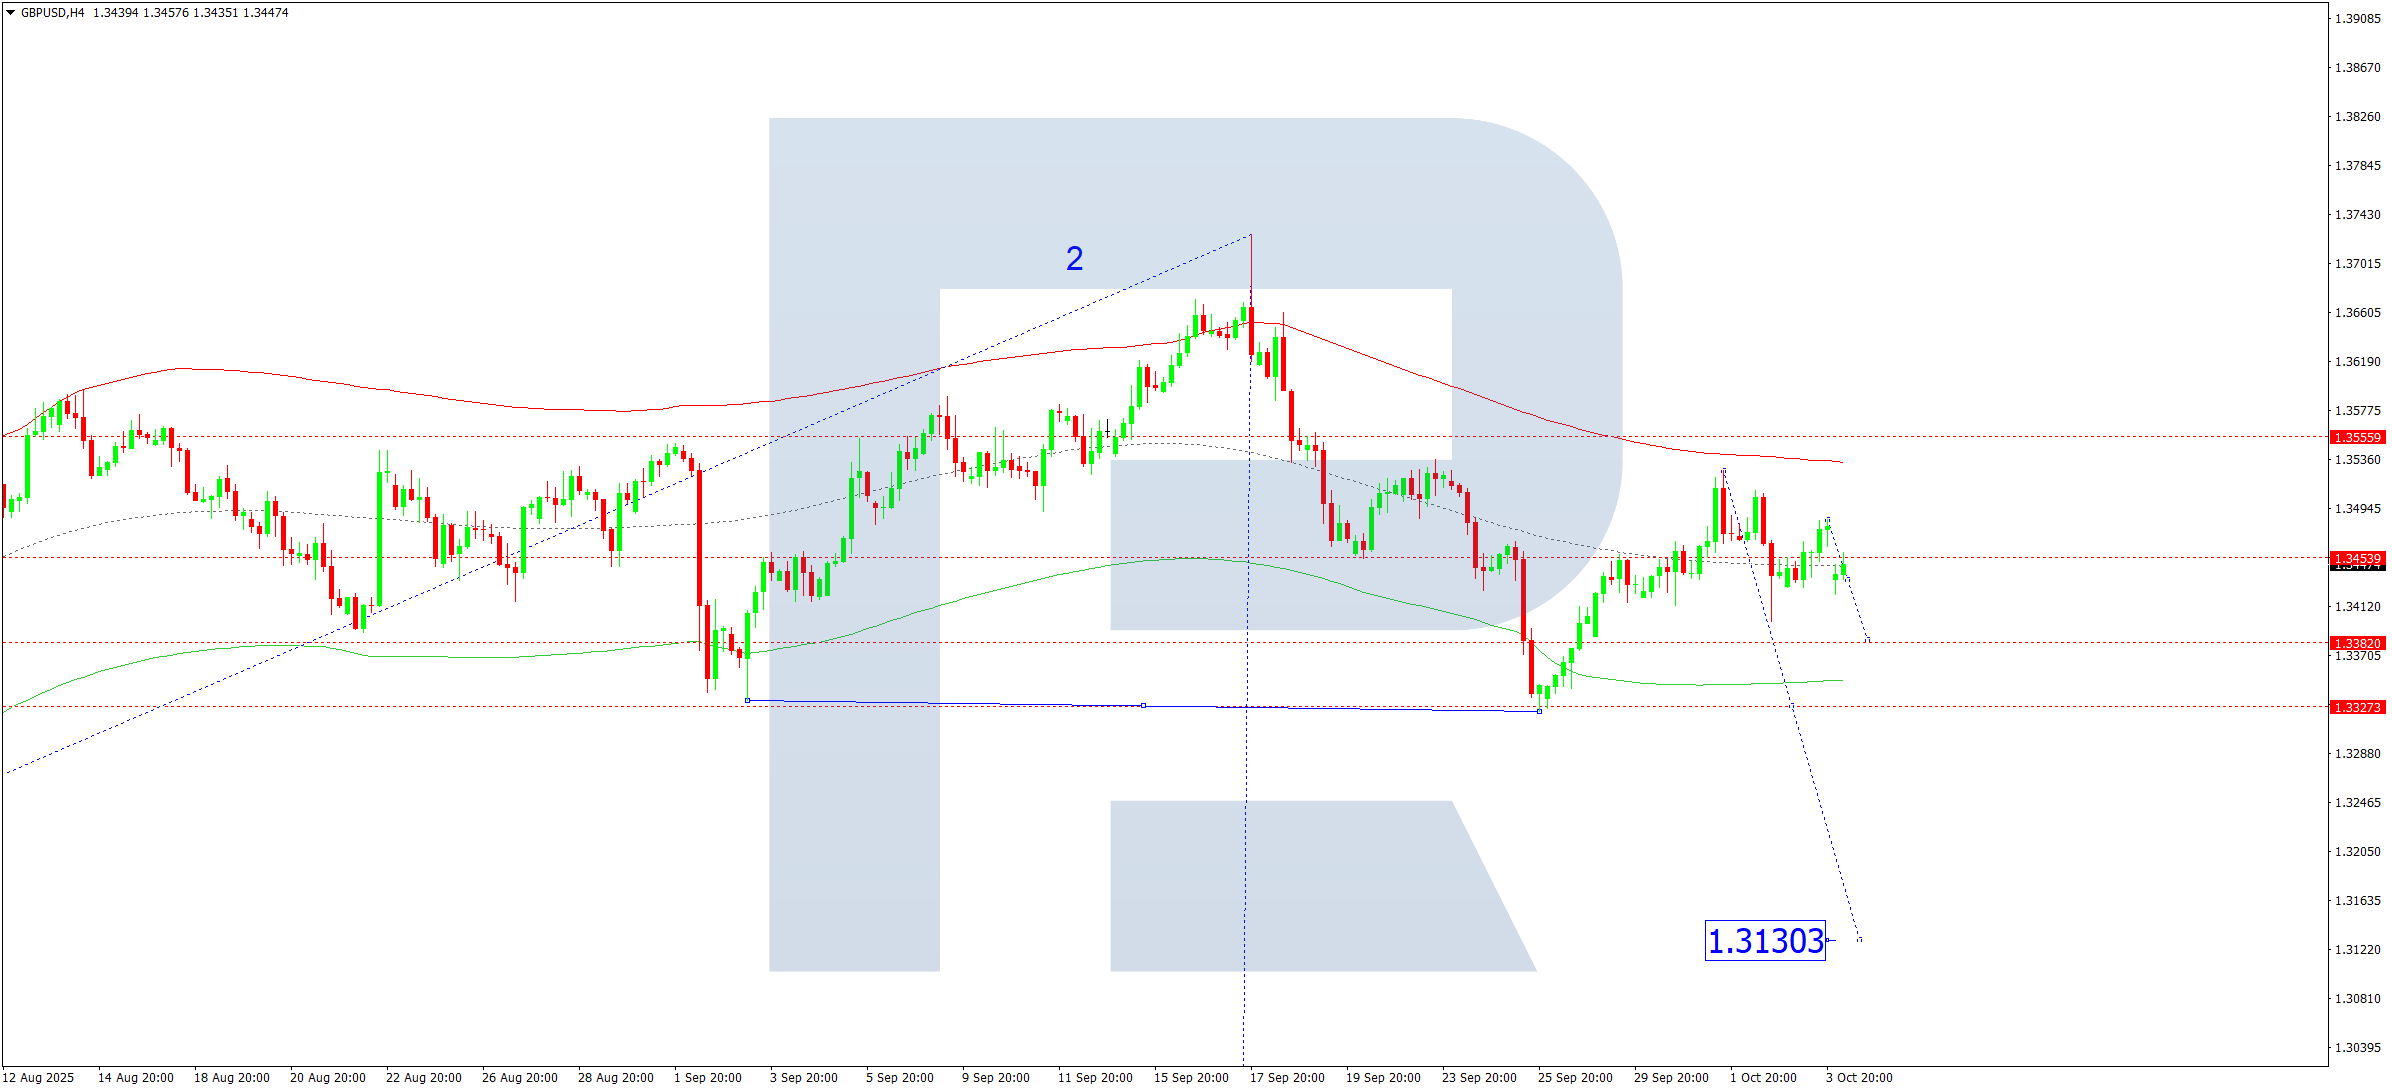
On the H4 chart of GBPUSD, the market is forming a downward wave targeting 1.3382. On 6 October 2025, the pair may reach this level before rebounding to 1.3454 (testing from below), followed by another decline towards 1.3322. If the 1.3322 level breaks, the trend could extend to 1.3130.
Technically, this scenario is supported by the Elliott Wave structure and the wave matrix with the pivot point at 1.3550, the key level within this wave structure. The market is consolidating around the central line of the Price Envelope at 1.3454. Today, the focus is on a possible continuation of the decline towards the lower boundary at 1.3322.
Technical indicators for today’s GBPUSD forecast suggest a continued downward move towards 1.3322.
AUDUSD forecast
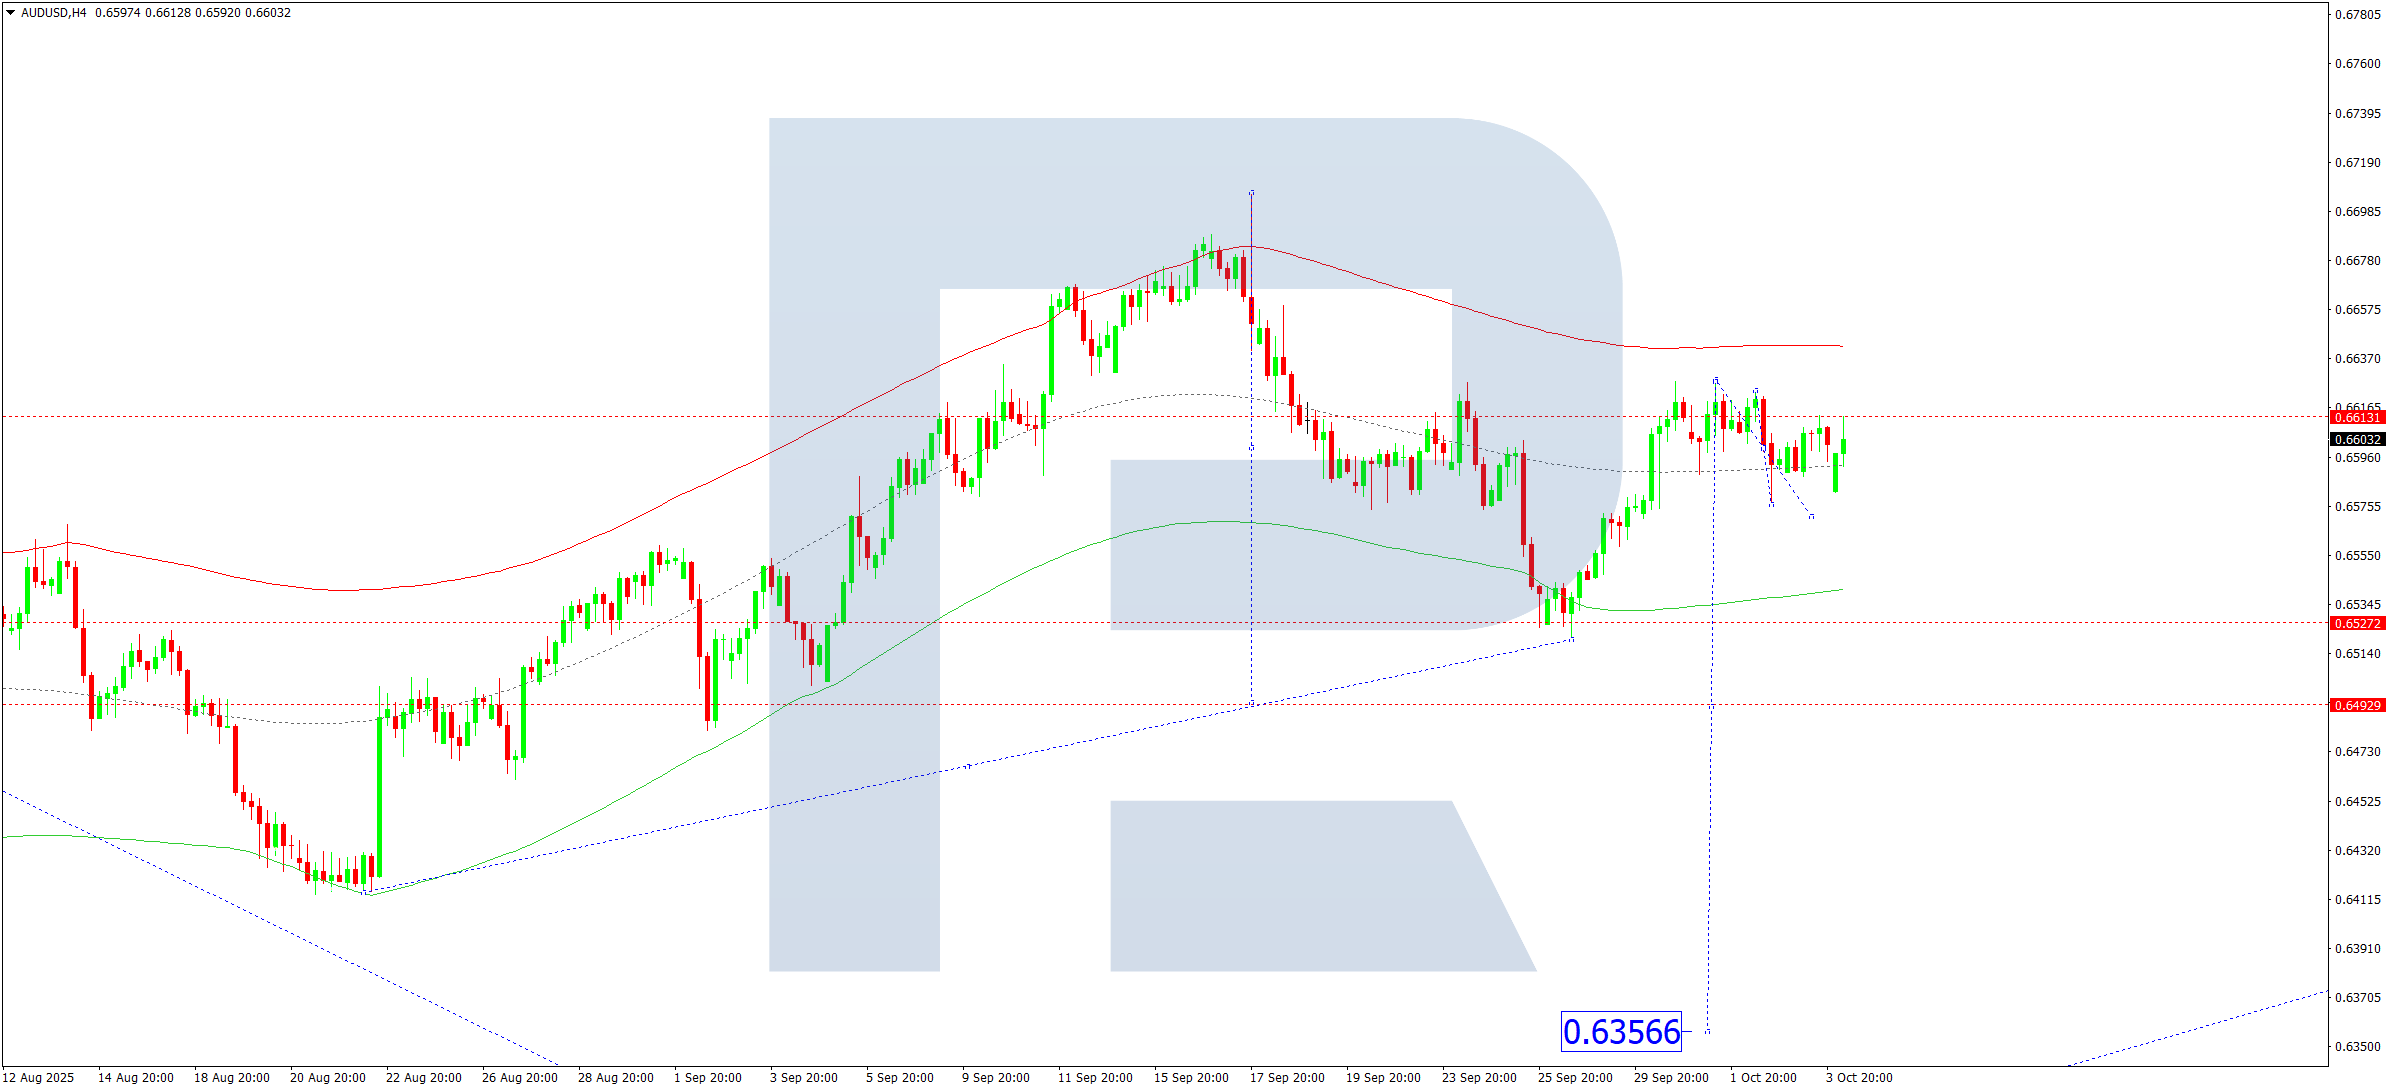
On the H4 chart of AUDUSD, the market is consolidating around 0.6613. On 6 October 2025, the range may extend down to 0.6570, followed by a rebound towards 0.6600. A breakout below the range would open potential for a decline towards 0.6493. If the range breaks upwards, another upward wave towards 0.6633 could form before resuming the downtrend towards 0.6493.
Technically, this scenario is confirmed by the Elliott Wave structure and the wave matrix with the pivot point at 0.6633, considered the key level for this wave. The market has reached the lower boundary of the Price Envelope at 0.6520. A further correction towards the upper boundary at 0.6633 is possible before resuming the decline towards the lower boundary at 0.6493.
Technical indicators for today’s AUDUSD forecast suggest a downward movement towards 0.6493.
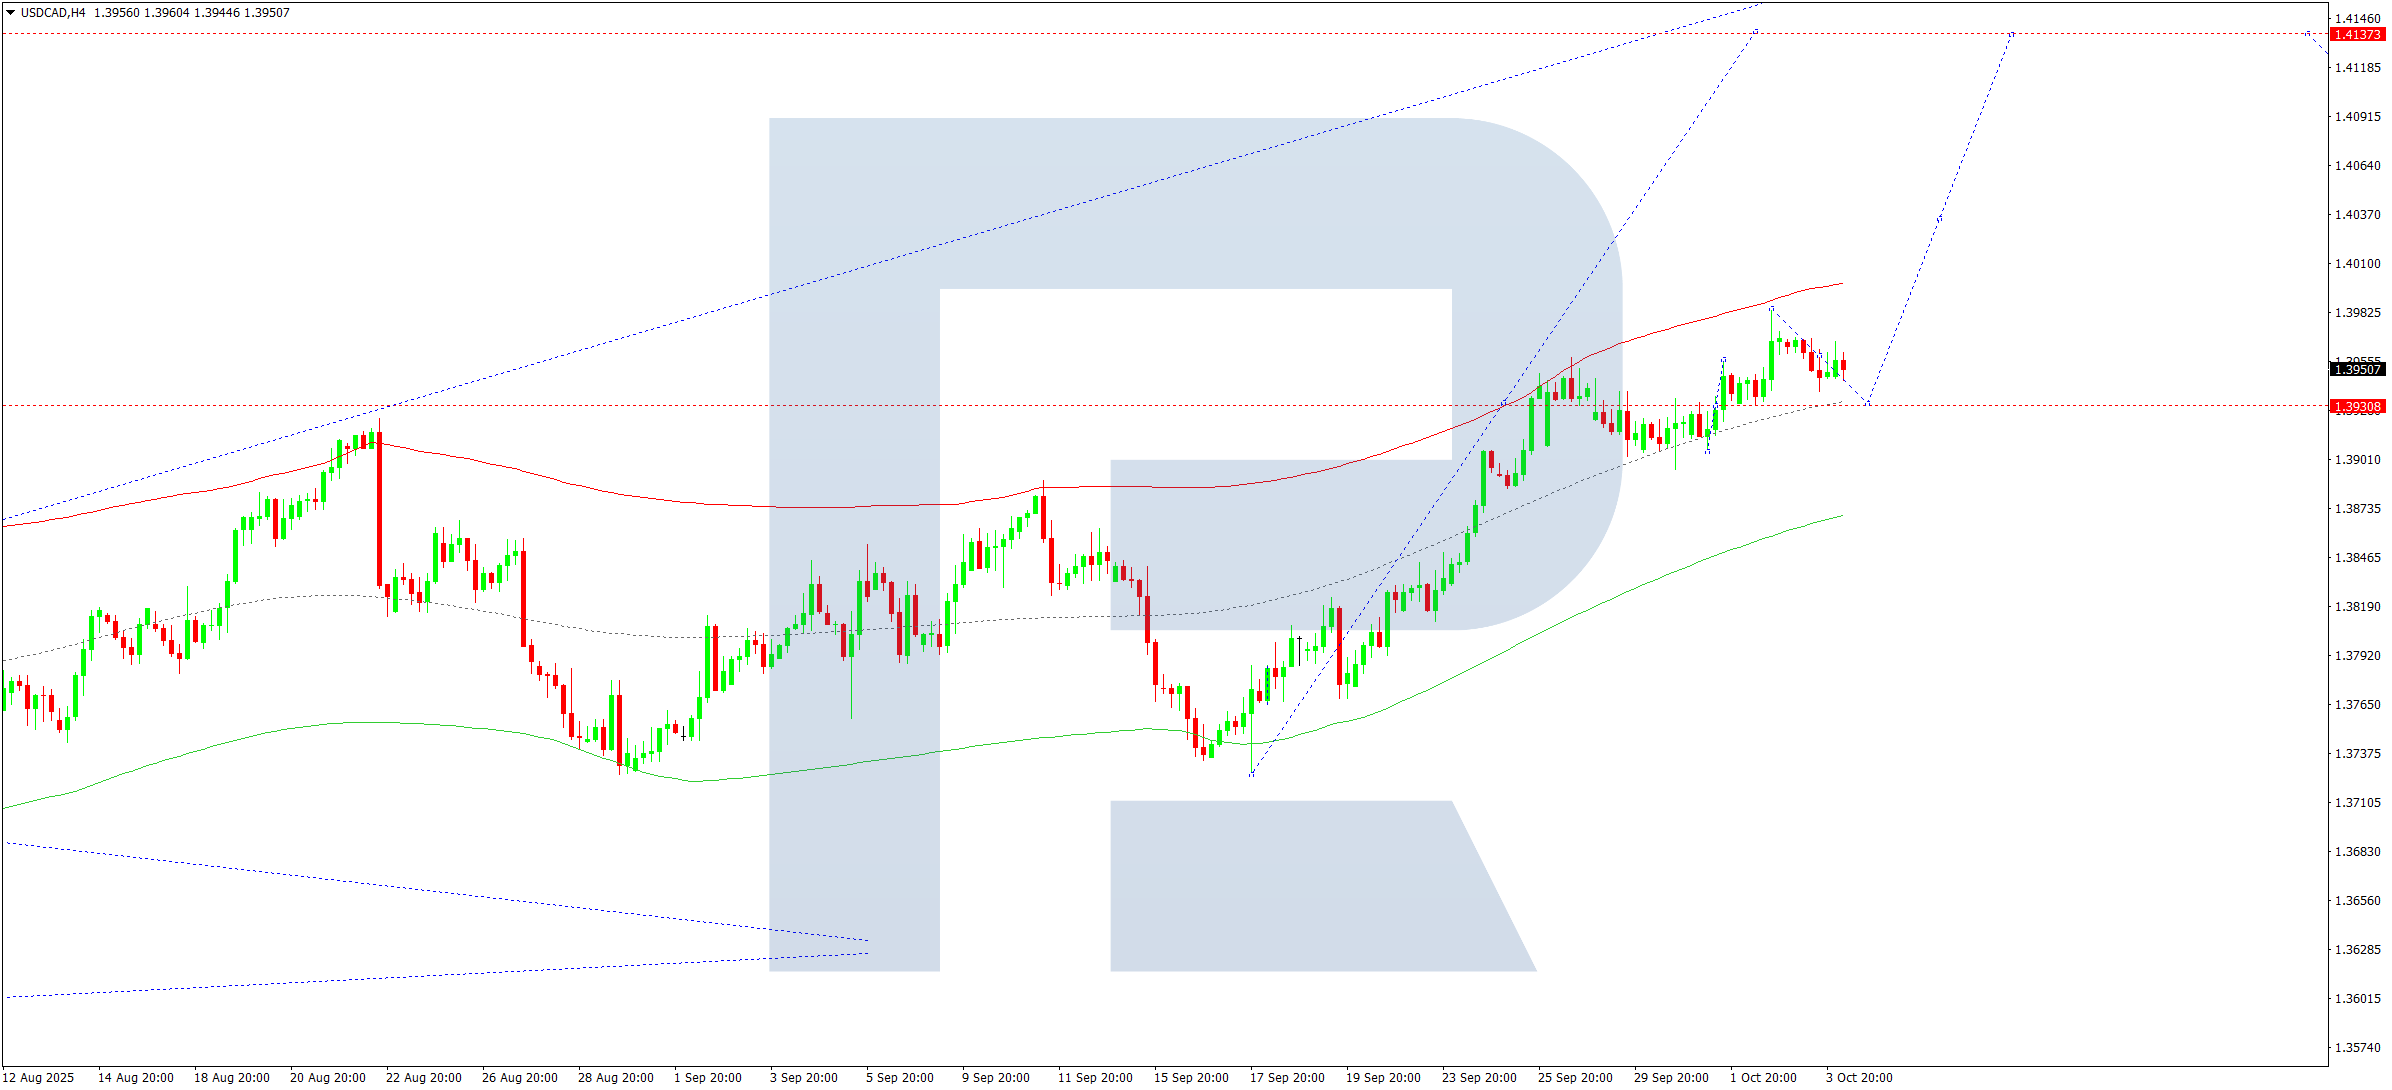
USDCAD forecast
On the H4 chart of USDCAD, the market continues consolidating around 1.3930. On 6 October 2025, the price could retest the 1.3930 level from above, followed by growth towards 1.4068 and 1.4100 as a local target. Later, a corrective pullback towards 1.3933 is possible.
Technically, this scenario is confirmed by the Elliott Wave structure and the wave matrix with the pivot point at 1.3930, the key level for this structure. The market is forming an upward wave towards the upper boundary of the Price Envelope at 1.4068. A possible correction towards the central line at 1.3930 (testing from above) may follow before the uptrend resumes.
Technical indicators for today’s USDCAD forecast suggest a possible pullback to 1.3930, followed by growth towards 1.4063.
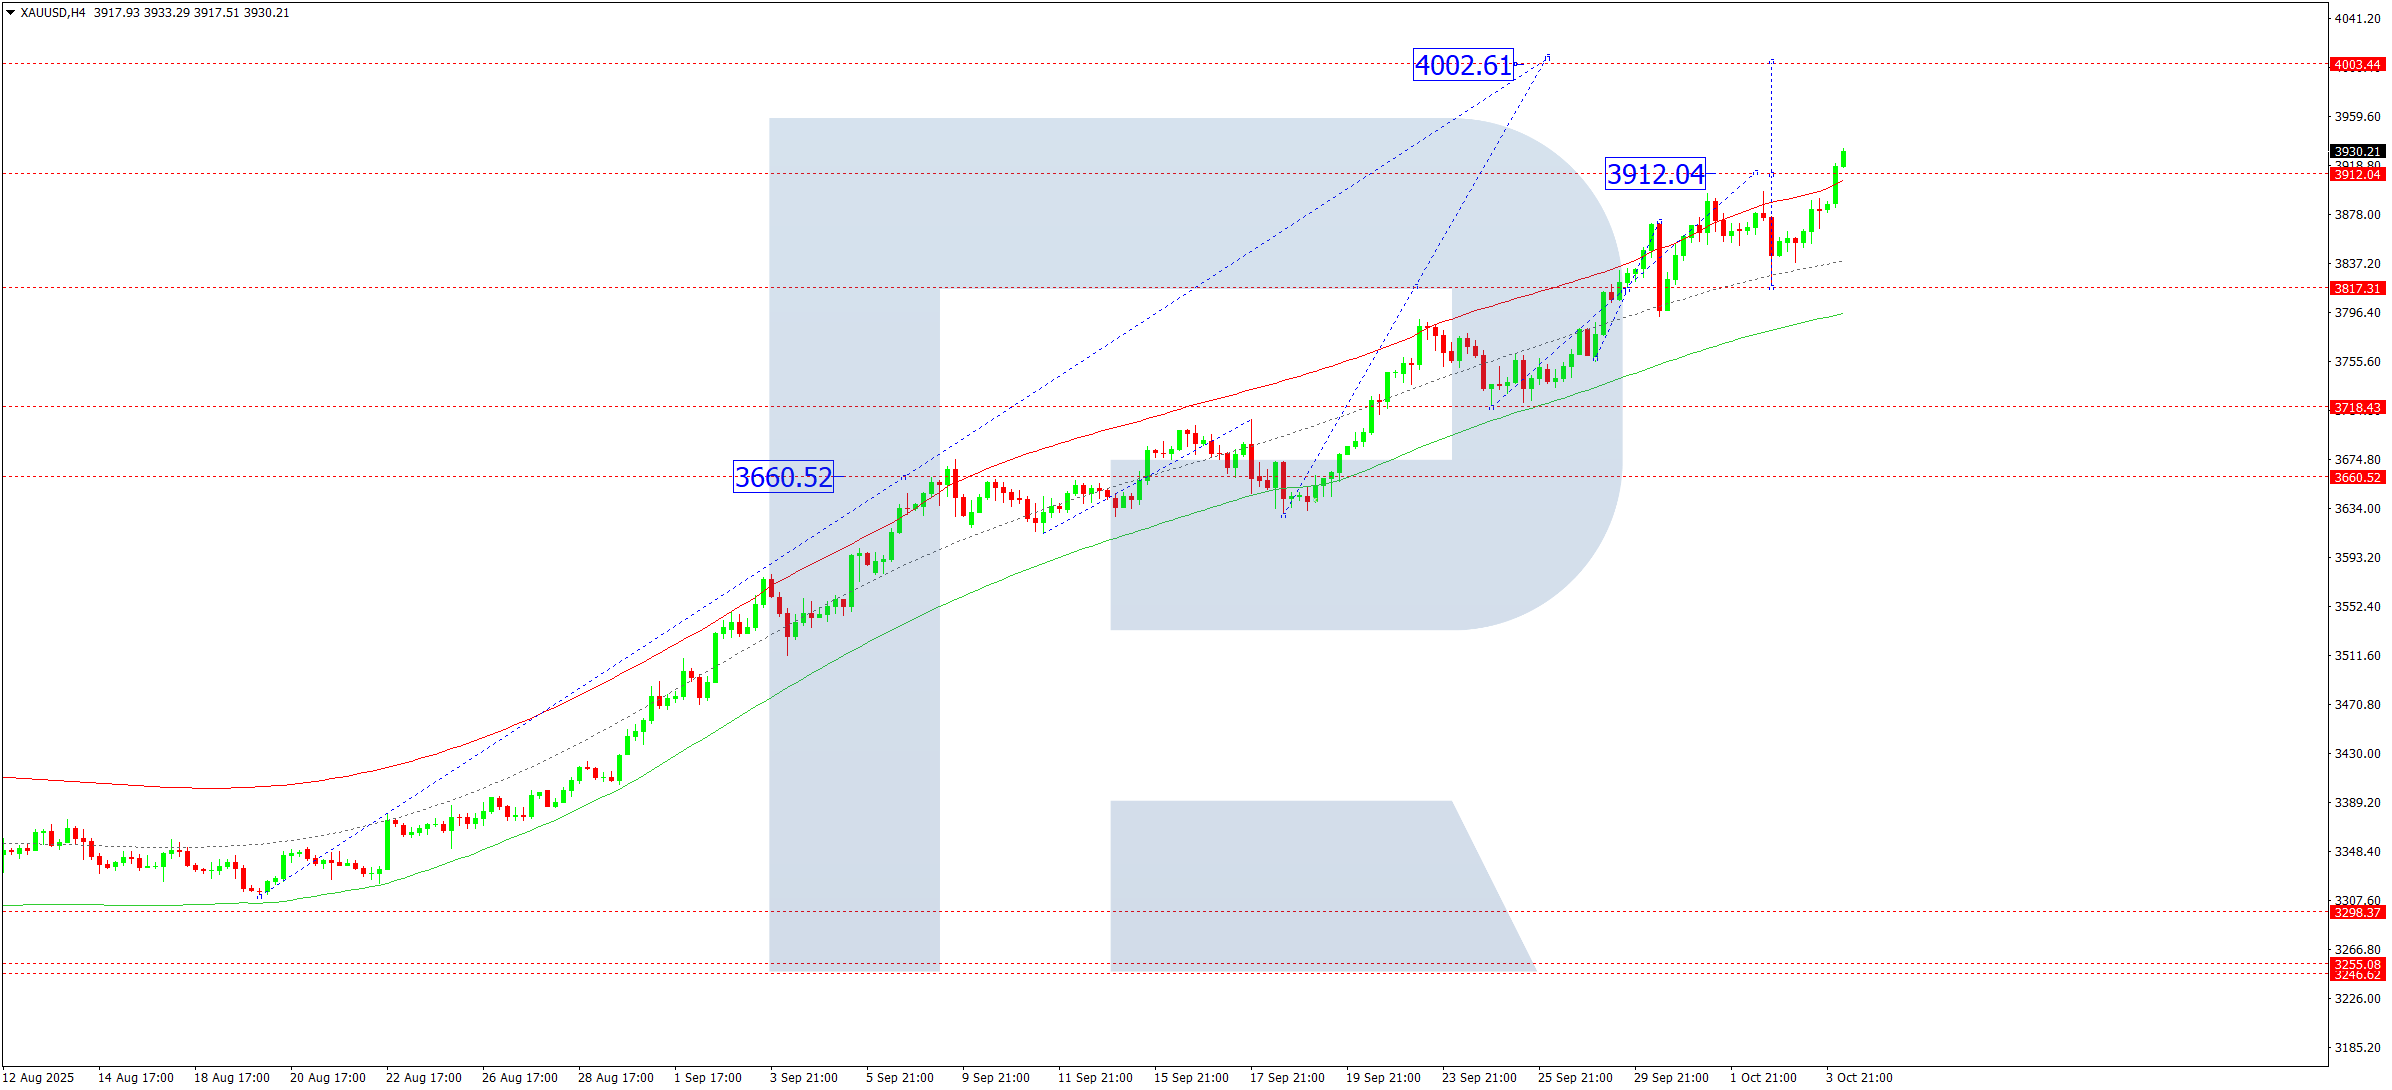
XAUUSD forecast
On the H4 chart of XAUUSD, the market has completed an upward wave to 3,910 and, after breaking above it, continues to rise towards 4,000 as a local target. On 6 October 2025, the pair is expected to reach this level before possibly starting a correction towards 3,850.
Technically, this scenario is confirmed by the Elliott Wave structure and the wave matrix with the pivot point at 3,660, the key level for this wave. The market is forming an upward structure towards the upper boundary of the Price Envelope at 4,000, after which a correction towards the central line at 3,850 is expected.
Technical indicators for today’s XAUUSD forecast signal continued growth towards 4,000.
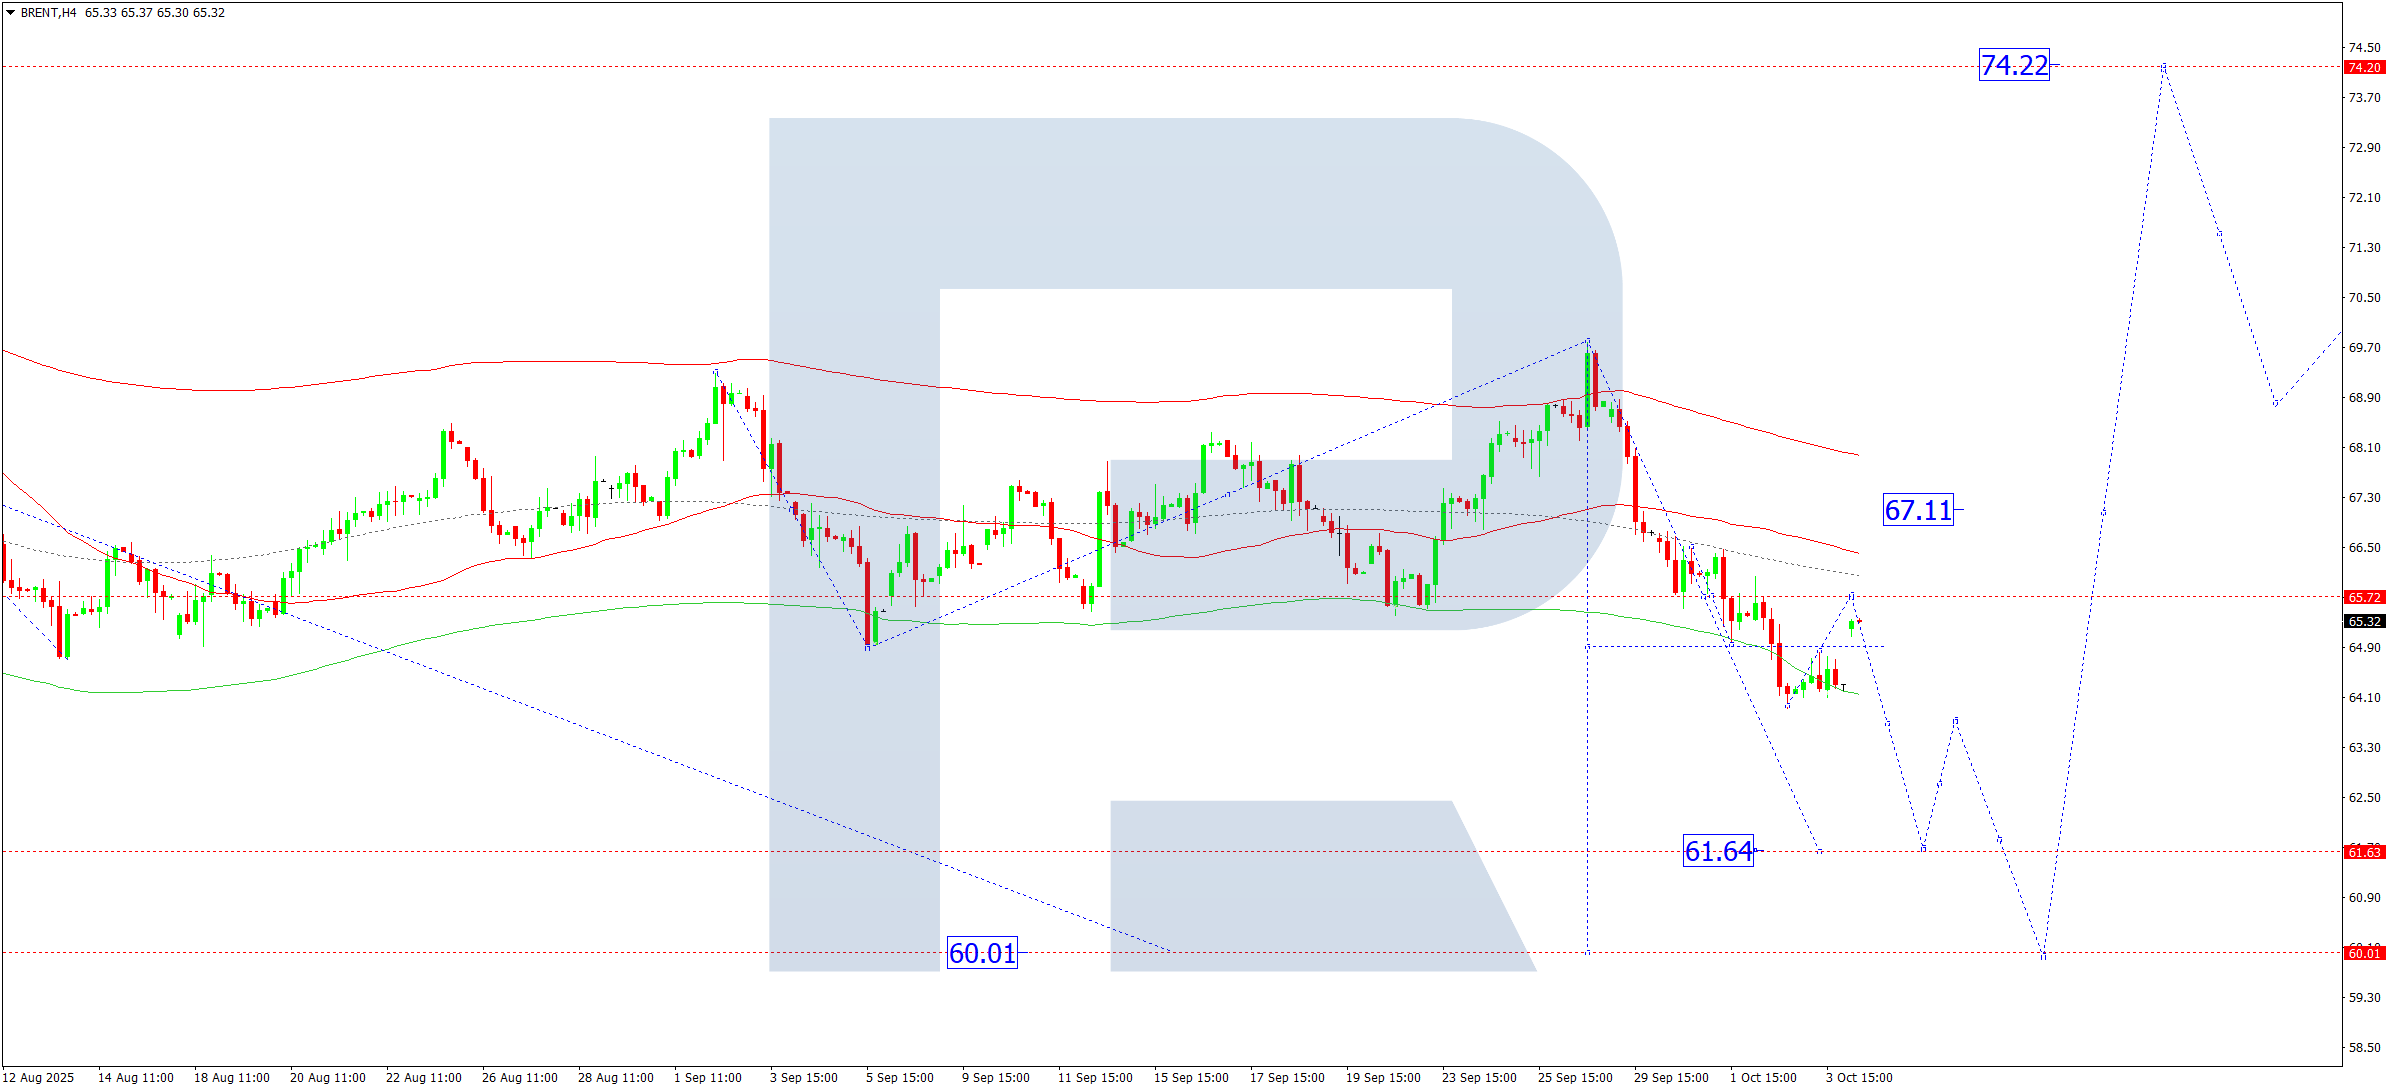
Brent forecast
On the H4 chart of Brent crude, the market shows potential for a corrective rise towards 65.75. On 6 October 2025, this correction is expected to complete, followed by a new downward wave towards 61.64 and a continuation of the trend towards 60.00.
Technically, this scenario is confirmed by the Elliott Wave structure and the wave matrix with the pivot point at 66.73, the key level in this wave. The market has completed a downward move to the lower boundary of the Price Envelope at 64.00. A consolidation range is likely to develop around 65.00. A breakout upwards would lead to a correction towards the upper boundary at 65.75, while a downward breakout would extend the wave towards the lower boundary at 61.64.
Technical indicators for today’s Brent forecast suggest a continued decline towards 61.64 and 60.00.
Forecasts presented in this section only reflect the author’s private opinion and should not be considered as guidance for trading. RoboForex bears no responsibility for trading results based on trading recommendations described in these analytical reviews.