Daily technical analysis and forecast for 2 October 2025
Here is a detailed daily technical analysis and forecast for EURUSD, USDJPY, GBPUSD, AUDUSD, USDCAD, XAUUSD and Brent for 2 October 2025.
EURUSD forecast
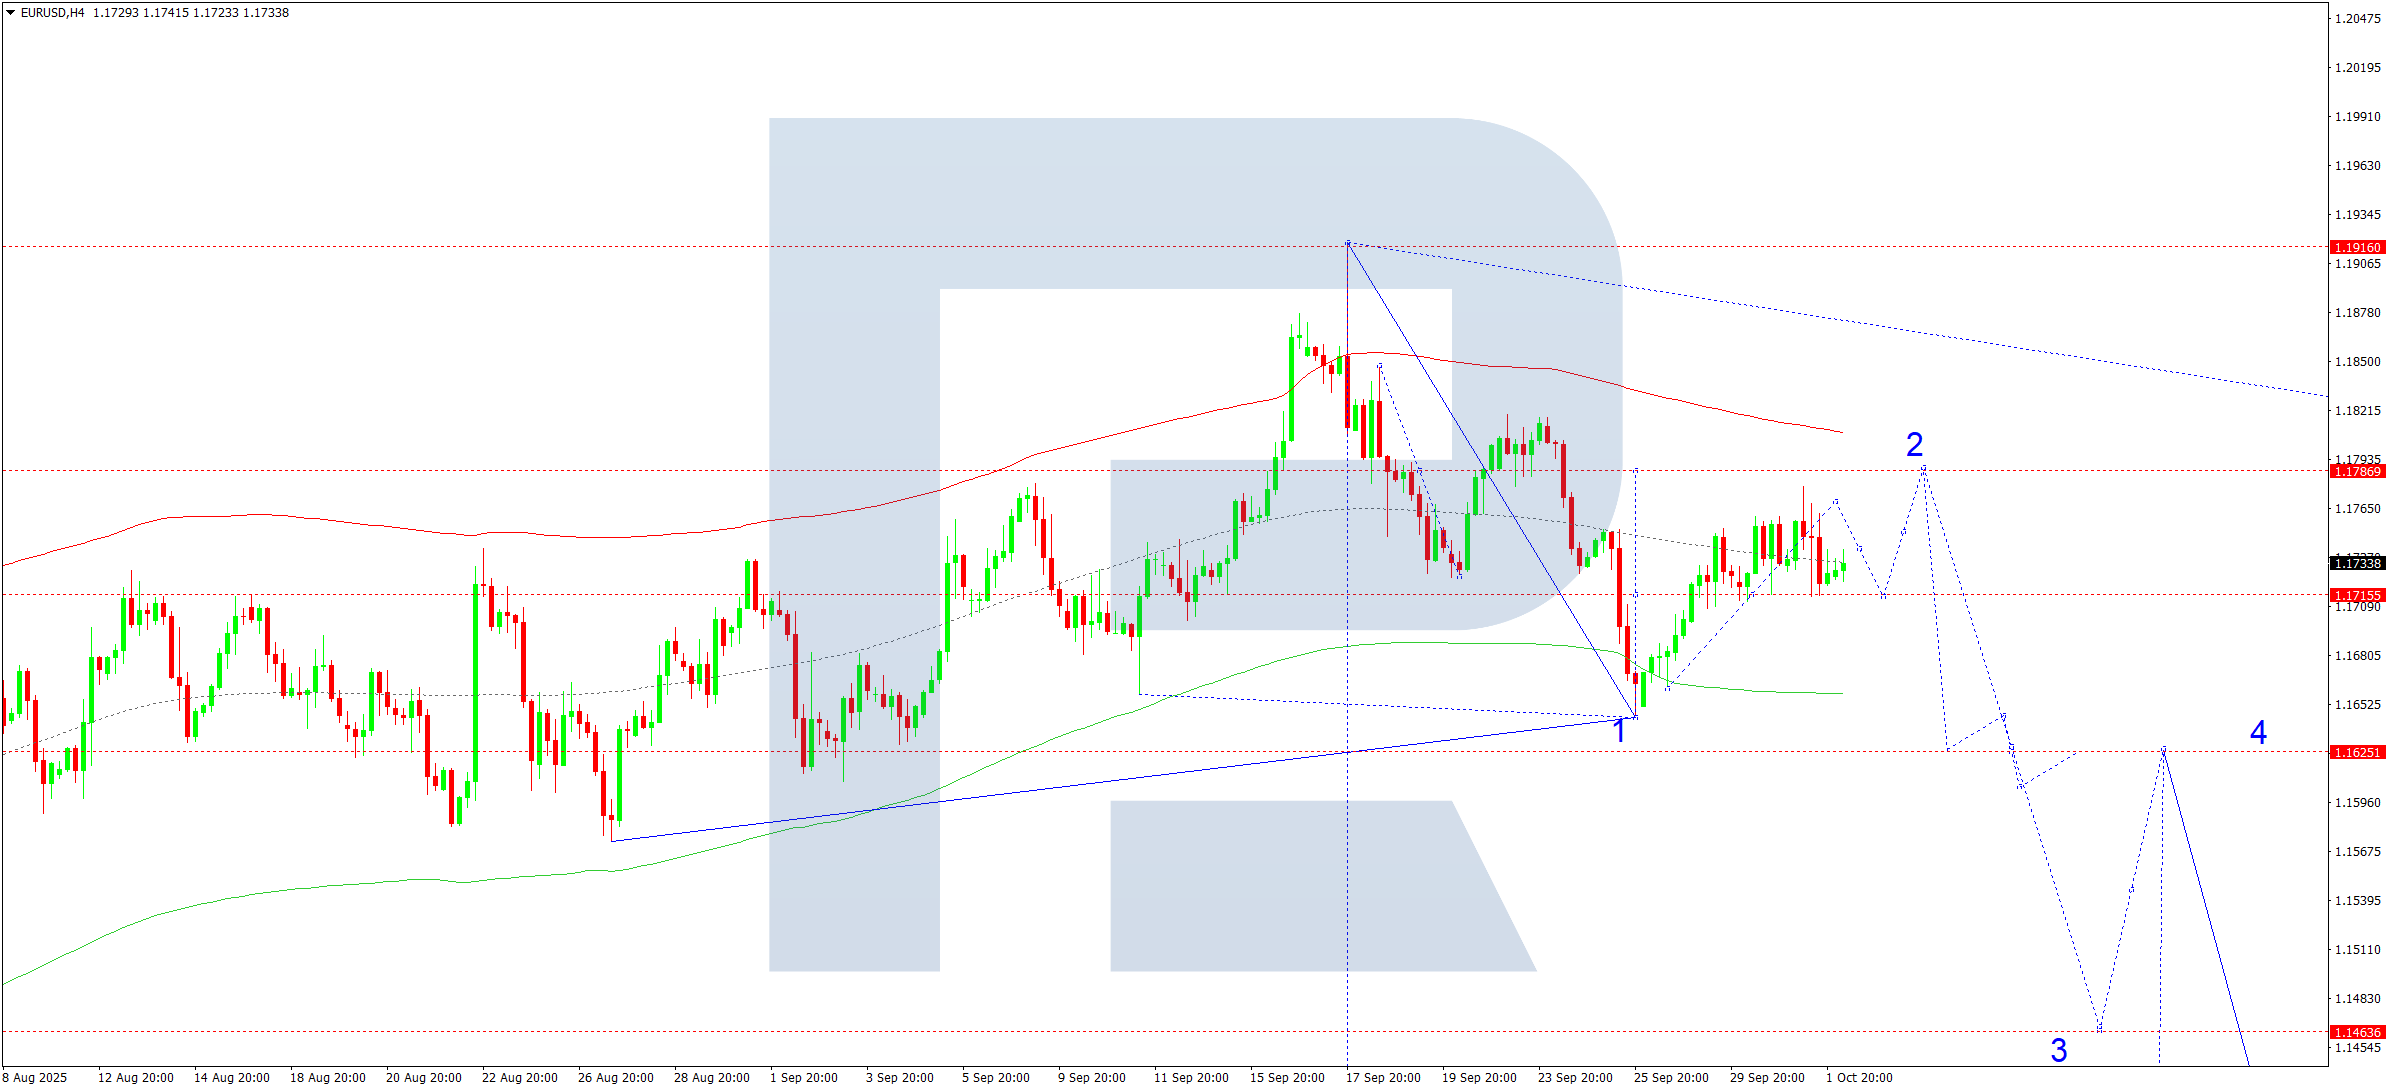
On the H4 chart of EURUSD, the market is forming a consolidation range above 1.1715. The range has temporarily expanded upwards to 1.1778. Today, 2 October 2025, a downward movement is forming towards 1.1705. A rise to 1.1745 is possible afterwards. If this level breaks, another upward move towards 1.1786 cannot be ruled out. The entire upward structure is viewed as a correction to the previous downward impulse. Once this correction is complete, the market may begin a new downward wave towards 1.1625, with the trend potentially continuing to 1.1464 as a local target.
Technically, this scenario is confirmed by the specified Elliott wave structure and the downward wave Matrix with a pivot at 1.1786. This level is considered key in the EURUSD wave structure. At the moment, the market has reached the downside target at the lower boundary of the Price Envelope at 1.1645. Today, consolidation around the central line of the Price Envelope at 1.1715 is expected. Subsequently, the correction could continue towards the upper boundary at 1.1786.
Technical indicators for today’s EURUSD forecast suggest a correction towards 1.1786, followed by a decline to 1.1700.
USDJPY forecast
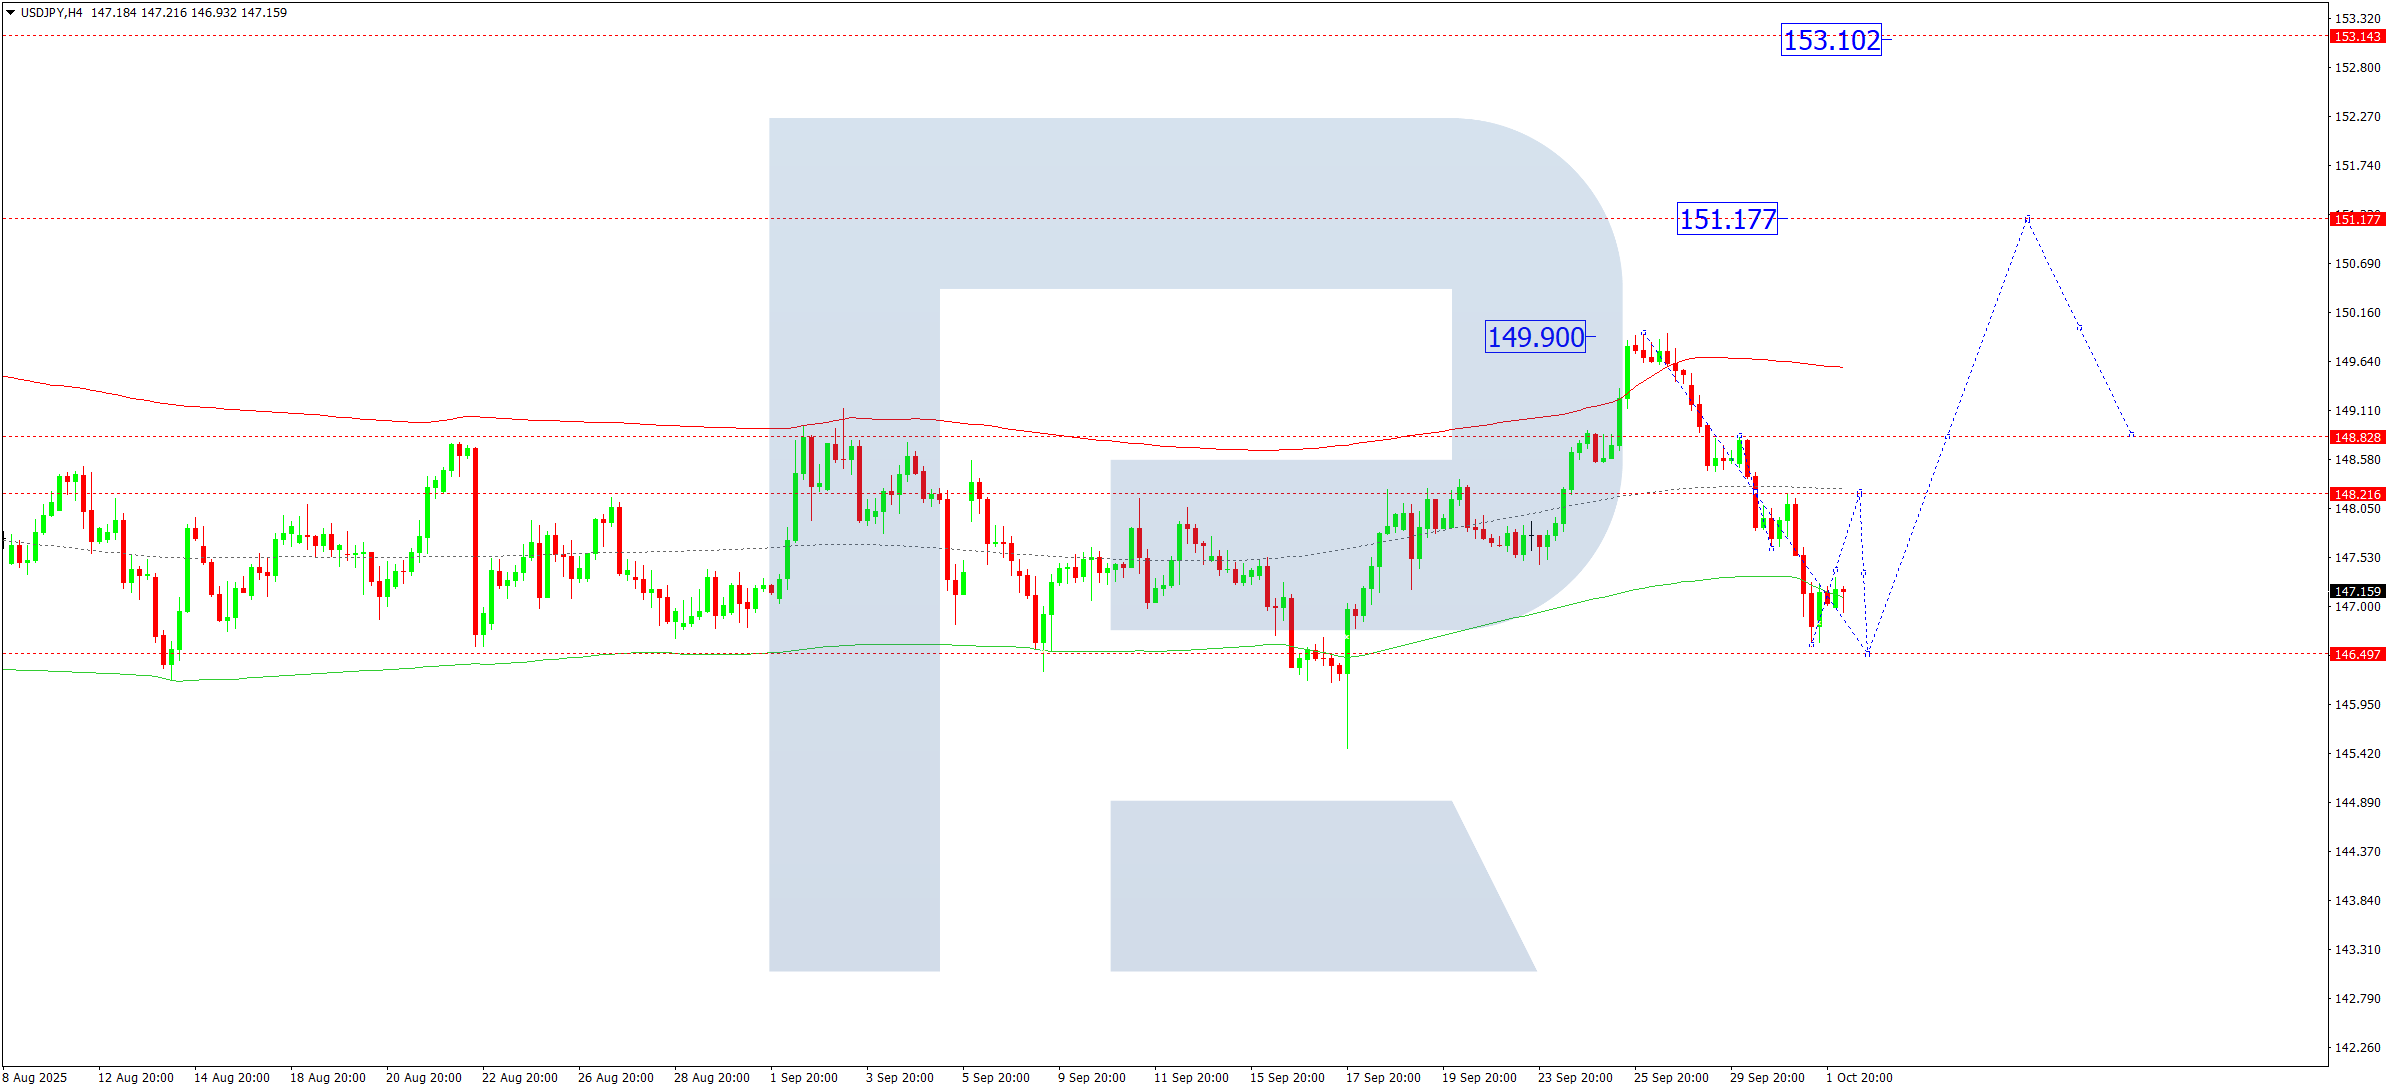
On the H4 chart of USDJPY, the market has completed a correction structure to 146.60. Today, 2 October 2025, a new growth wave towards 148.22 is expected. Another downward move to 146.50 is possible afterwards. This would exhaust the downside potential. Growth towards 148.88 is then anticipated, with the trend potentially continuing to 151.17 as a local target. A decline to 149.00 is possible later, followed by growth towards 153.15.
Technically, this scenario for USDJPY is confirmed by the Elliott wave structure and the growth wave Matrix with a pivot at 147.75. This level is considered key in the structure. At the moment, the market has completed a growth wave towards the upper boundary of the Price Envelope at 149.90. Today, the focus will be on the probability of a correction towards its lower boundary at 146.50. After this correction, a growth wave towards the upper boundary at 151.15 is expected.
Technical indicators for today’s USDJPY forecast suggest growth towards 151.15.
GBPUSD forecast
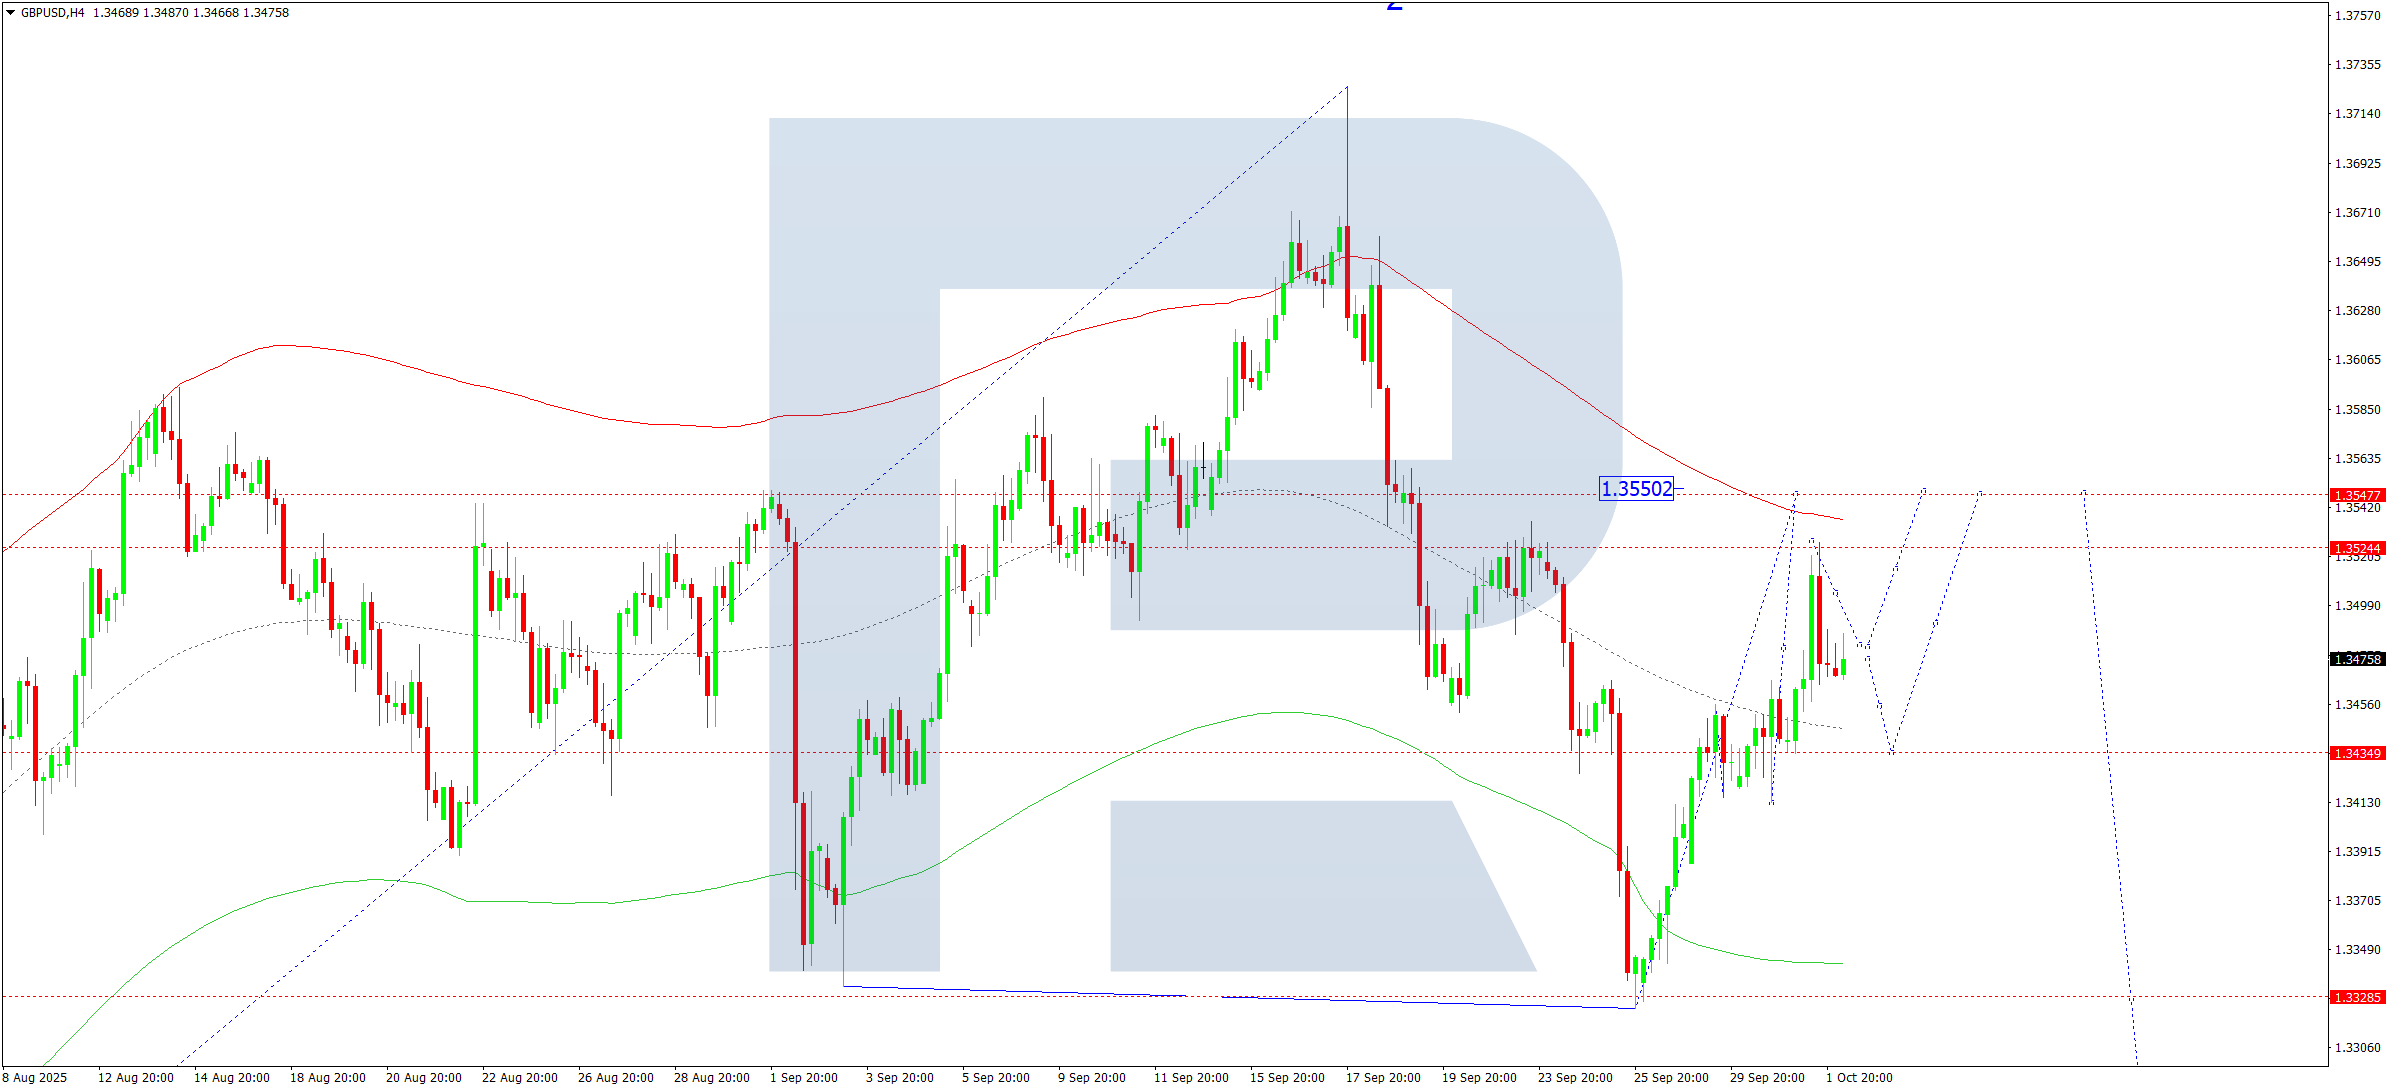
On the H4 chart of GBPUSD, the market has completed a correction to 1.3525 and a downward impulse to 1.3464. Today, 2 October 2025, consolidation above this level is forming. A downward breakout may open the potential for a decline to 1.3422. If this support also breaks, the downward wave could extend to 1.3322, with the trend possibly continuing towards 1.3100. An upward breakout could lead to a spike towards 1.3550, followed by a decline to 1.3422.
Technically, this scenario for GBPUSD is confirmed by the Elliott wave structure and the downward wave Matrix with a pivot at 1.3550. This level is considered key in the structure. At the moment, the market has completed a downward wave towards the lower boundary of the Price Envelope at 1.3323. Today, the correction could continue towards its upper boundary at 1.3550, followed by a decline to its lower boundary at 1.3322.
Technical indicators for today’s GBPUSD forecast suggest a correction towards 1.3550 and the beginning of a decline towards 1.3322.
AUDUSD forecast
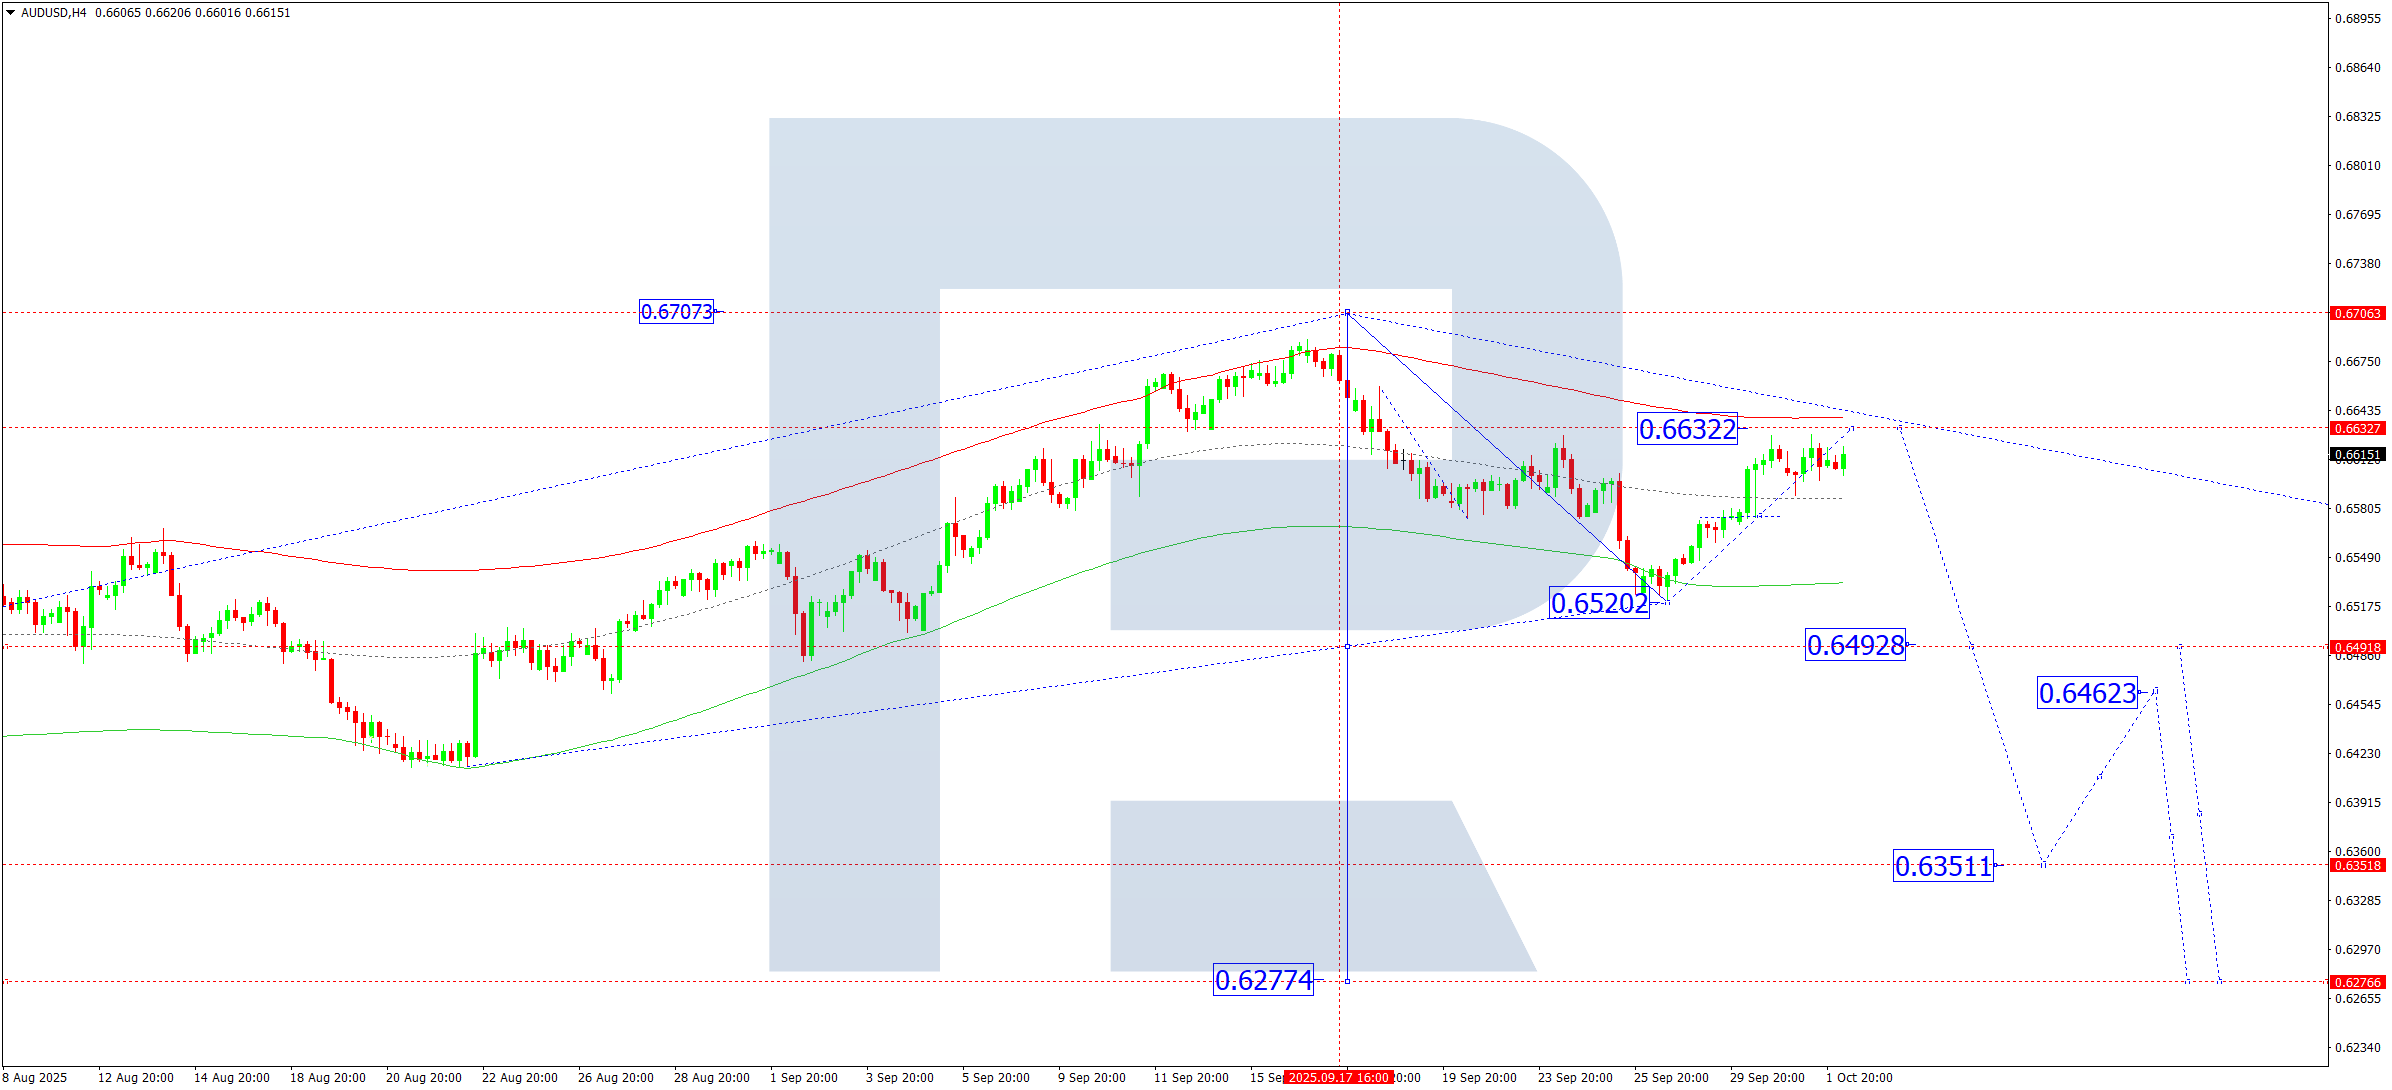
On the H4 chart of AUDUSD, the market has completed a correction to 0.6627. Today, 2 October 2025, consolidation below this level is forming. An expansion of the range upwards to 0.6633 cannot be excluded. This would complete the correction potential. A new downward wave towards 0.6565 is expected, with further movement to 0.6490 and then 0.6351as a local target.
Technically, this scenario is confirmed by the Elliott wave structure and the AUDUSD downward wave Matrix with a pivot at 0.6633. This level is considered key in the structure. At the moment, the market has completed a downward wave towards the lower boundary of the Price Envelope at 0.6520. Today, the correction could continue towards the upper boundary at 0.6633. Afterwards, a downward wave towards the lower boundary at 0.6493 is expected.
Technical indicators for today’s AUDUSD forecast suggest the completion of the correction at 0.6633 and the start of a downward wave towards 0.6493.
USDCAD forecast
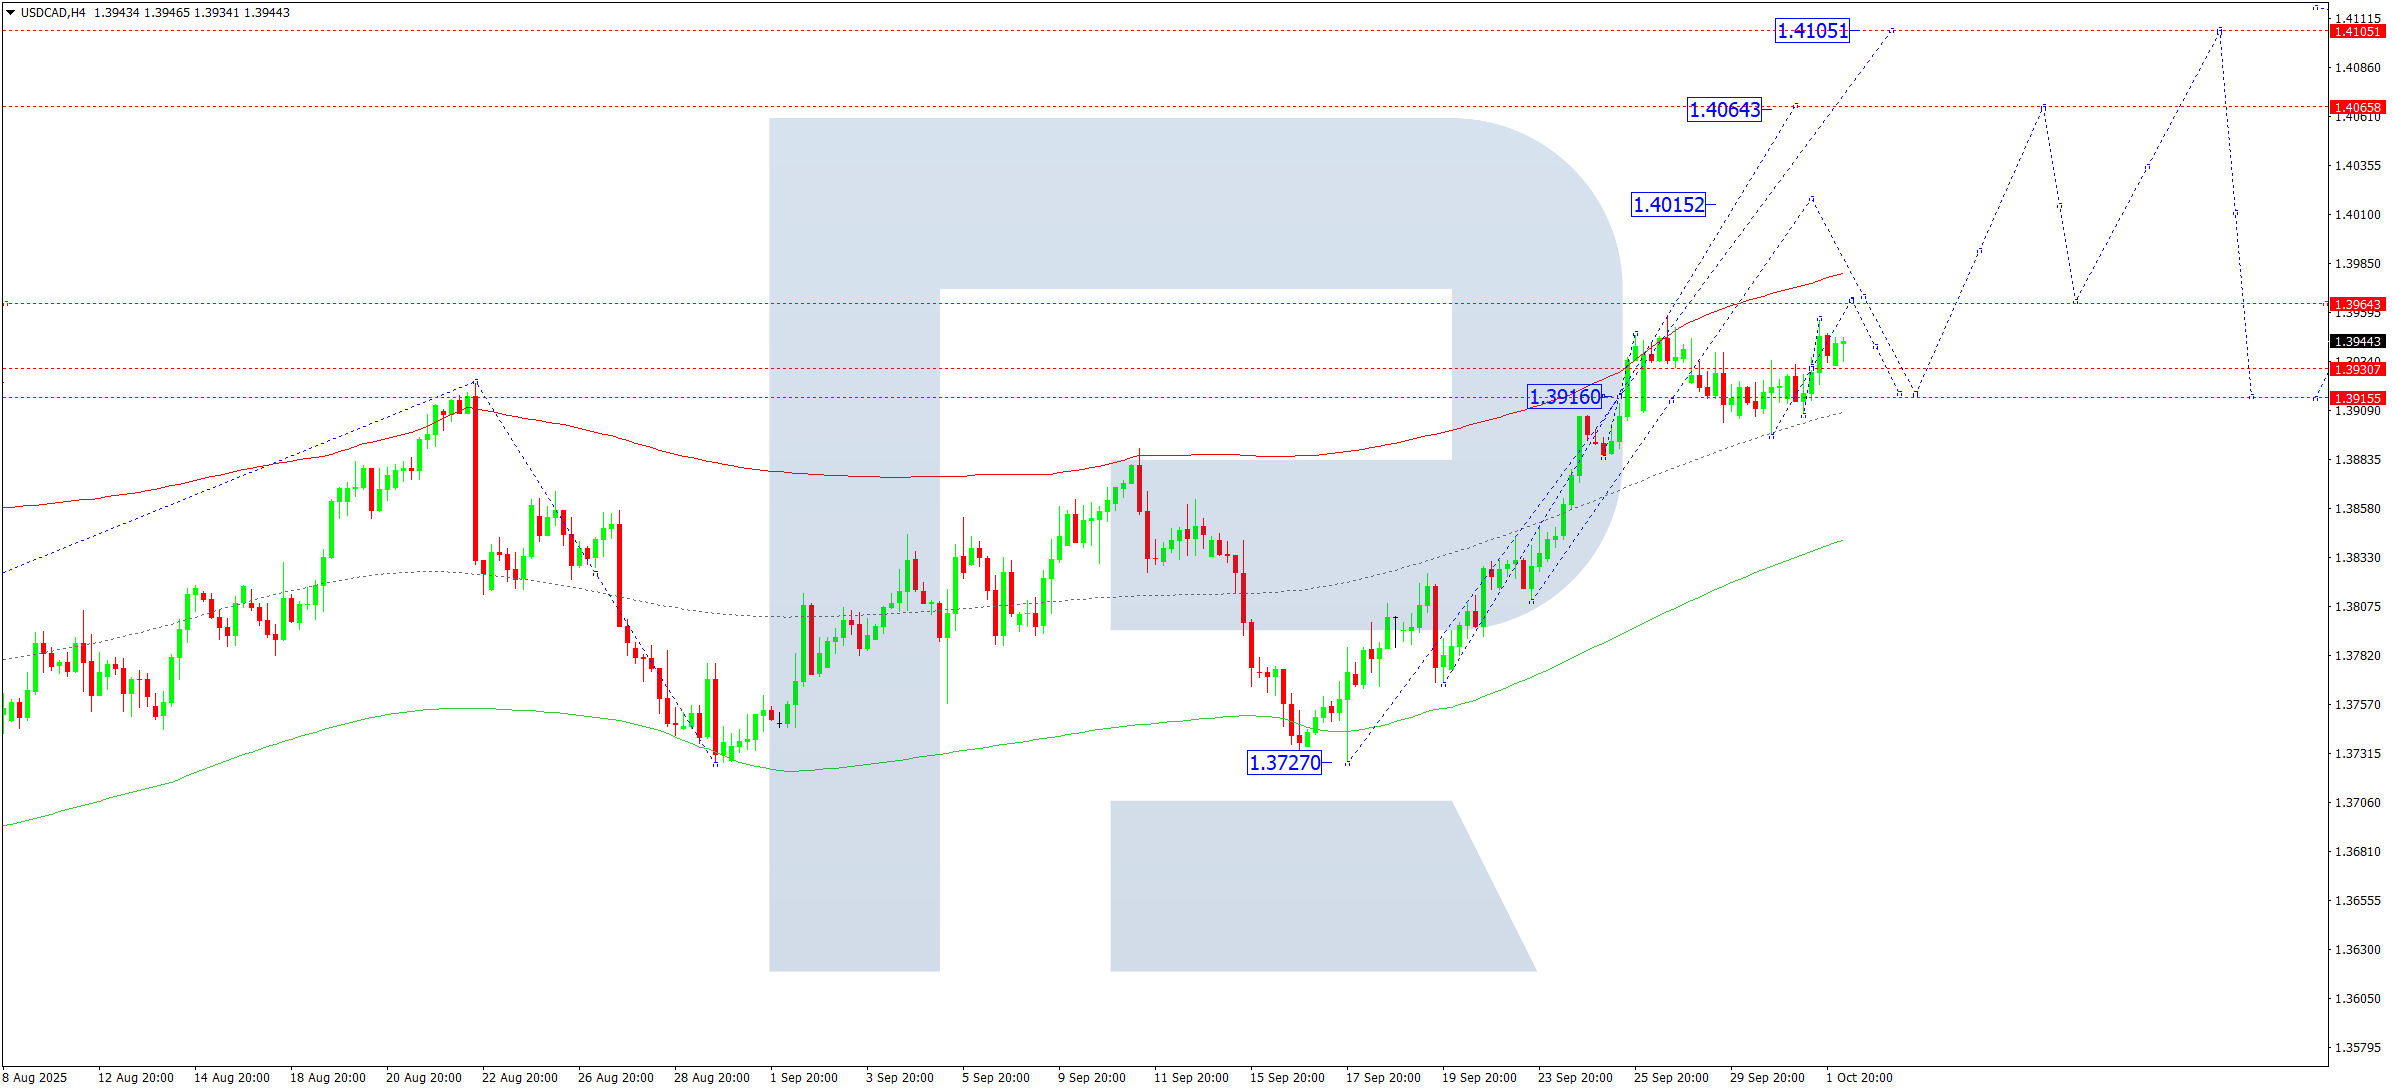
On the H4 chart of USDCAD, the market continues to develop a consolidation range around 1.3930. Today, 2 October 2025, an upward expansion to 1.3964 is possible, followed by a decline to 1.3916. If this level breaks downwards, a wave towards 1.3850 could unfold. An upward breakout may open potential for further growth to 1.4015, with the trend possibly extending to 1.4064 and 1.4100 as a local target.
Technically, this scenario is confirmed by the Elliott wave structure and the growth wave Matrix with a pivot at 1.3838. This level is considered key in the USDCAD wave structure. At the moment, the market is forming a growth wave towards the upper boundary of the Price Envelope at 1.3964. Today, the focus will be on the possibility of a correction to its central line at 1.3916 (testing from above).
Technical indicators for today’s USDCAD forecast suggest continued growth towards 1.3964, followed by a decline to 1.3916.
XAUUSD forecast
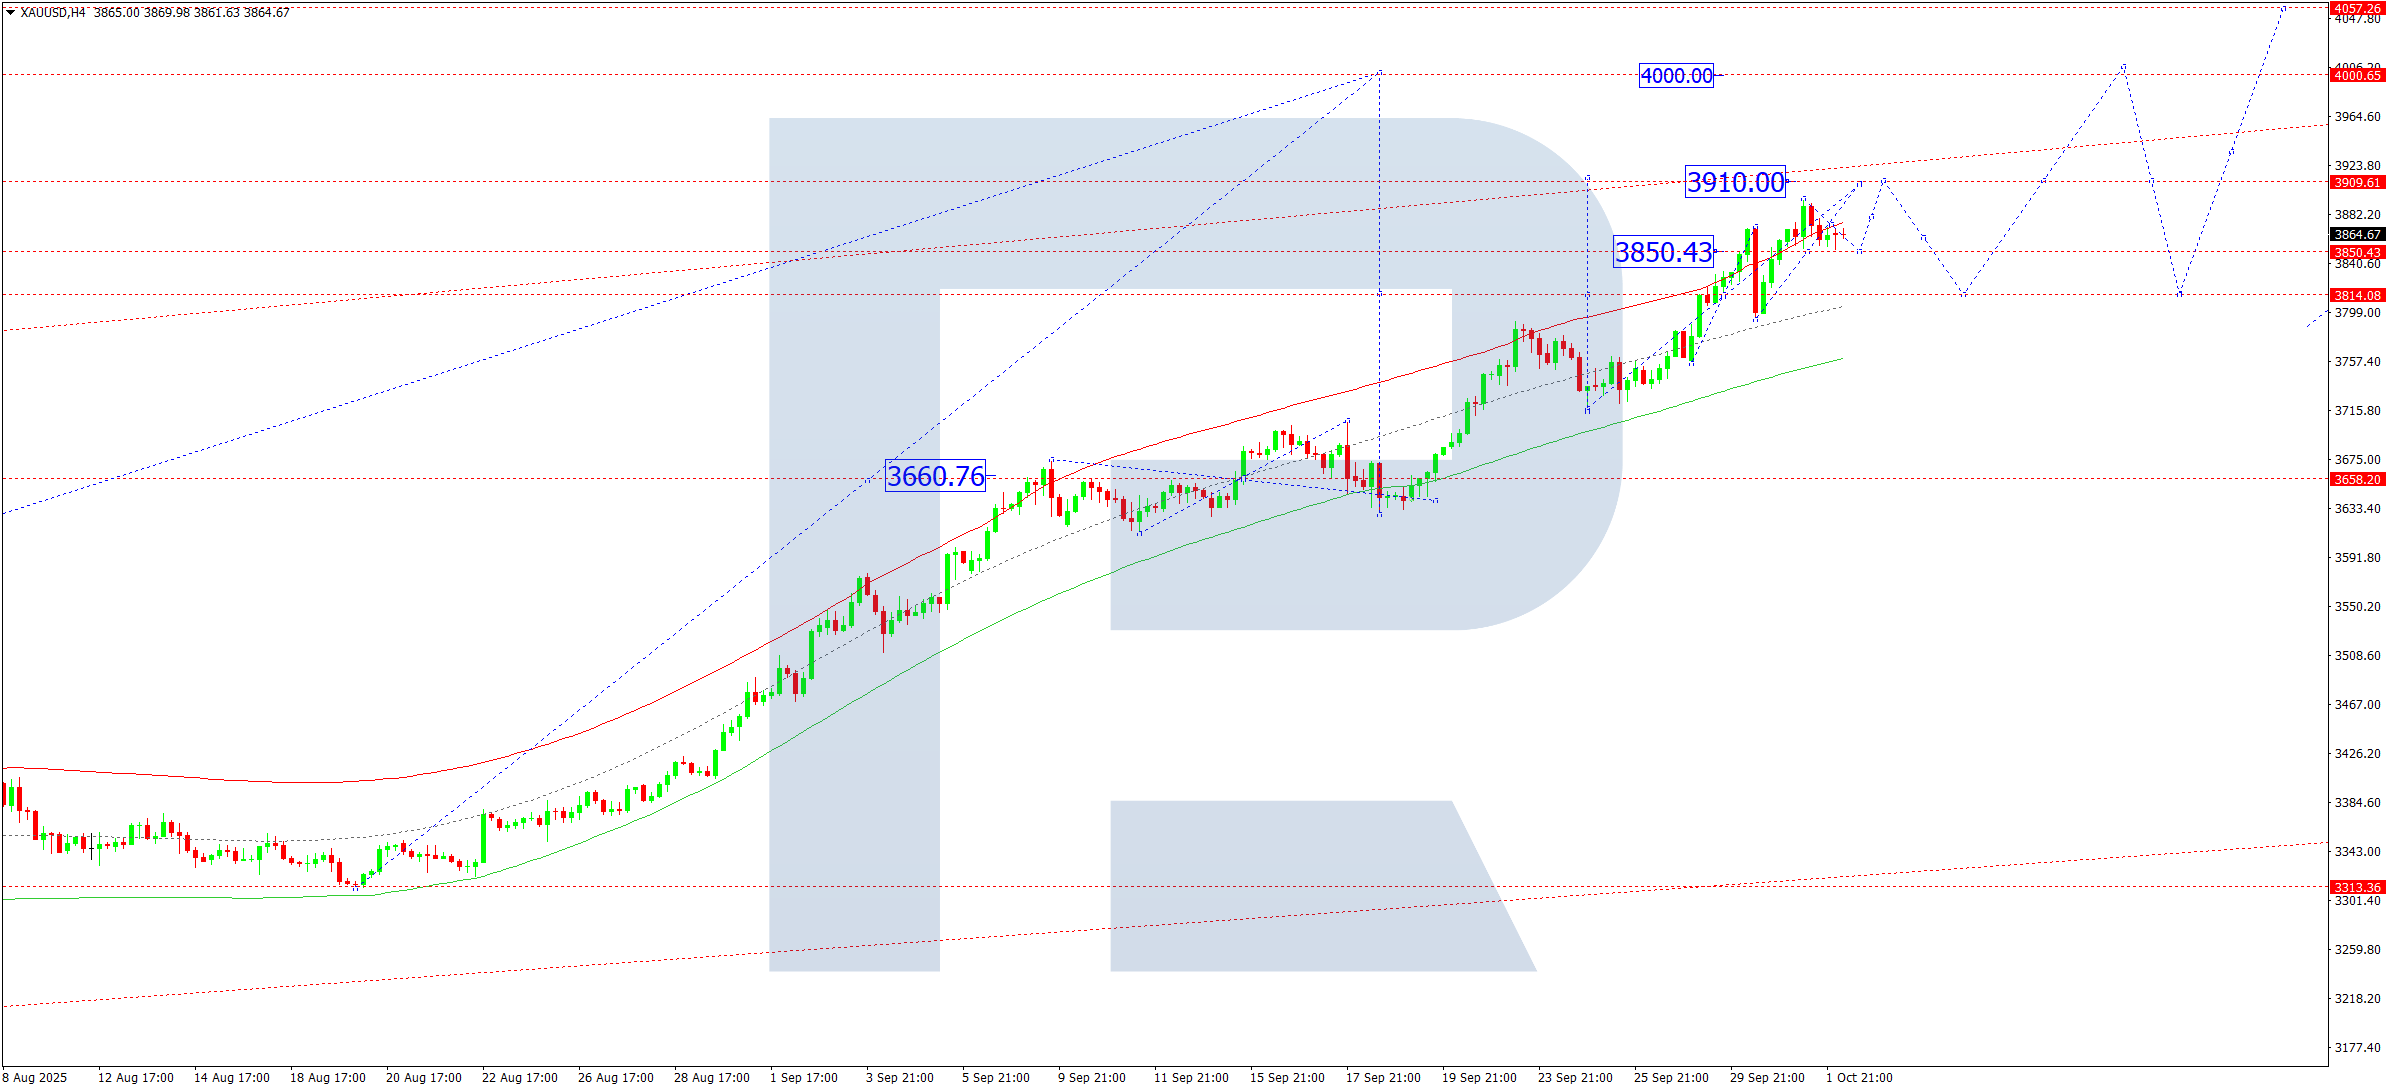
On the H4 chart of XAUUSD, the market has completed a growth wave to 3,895 and a correction to 3,850. A consolidation range is forming above this level. Today, 2 October 2025, an upward breakout could lead to a move towards 3,910. A breakout of this level may open the potential for the trend to continue towards 4,000 as a local target.
Technically, this scenario is confirmed by the Elliott wave structure and the growth wave Matrix with a pivot at 3,660. This level is considered key in the XAUUSD wave structure. At the moment, the market is forming a growth wave towards the upper boundary of the Price Envelope at 3,920. A correction towards its central line at 3,850 is expected afterwards.
Technical indicators for today’s XAUUSD forecast suggest continued growth towards 3,910 and 4,000.
Brent forecast
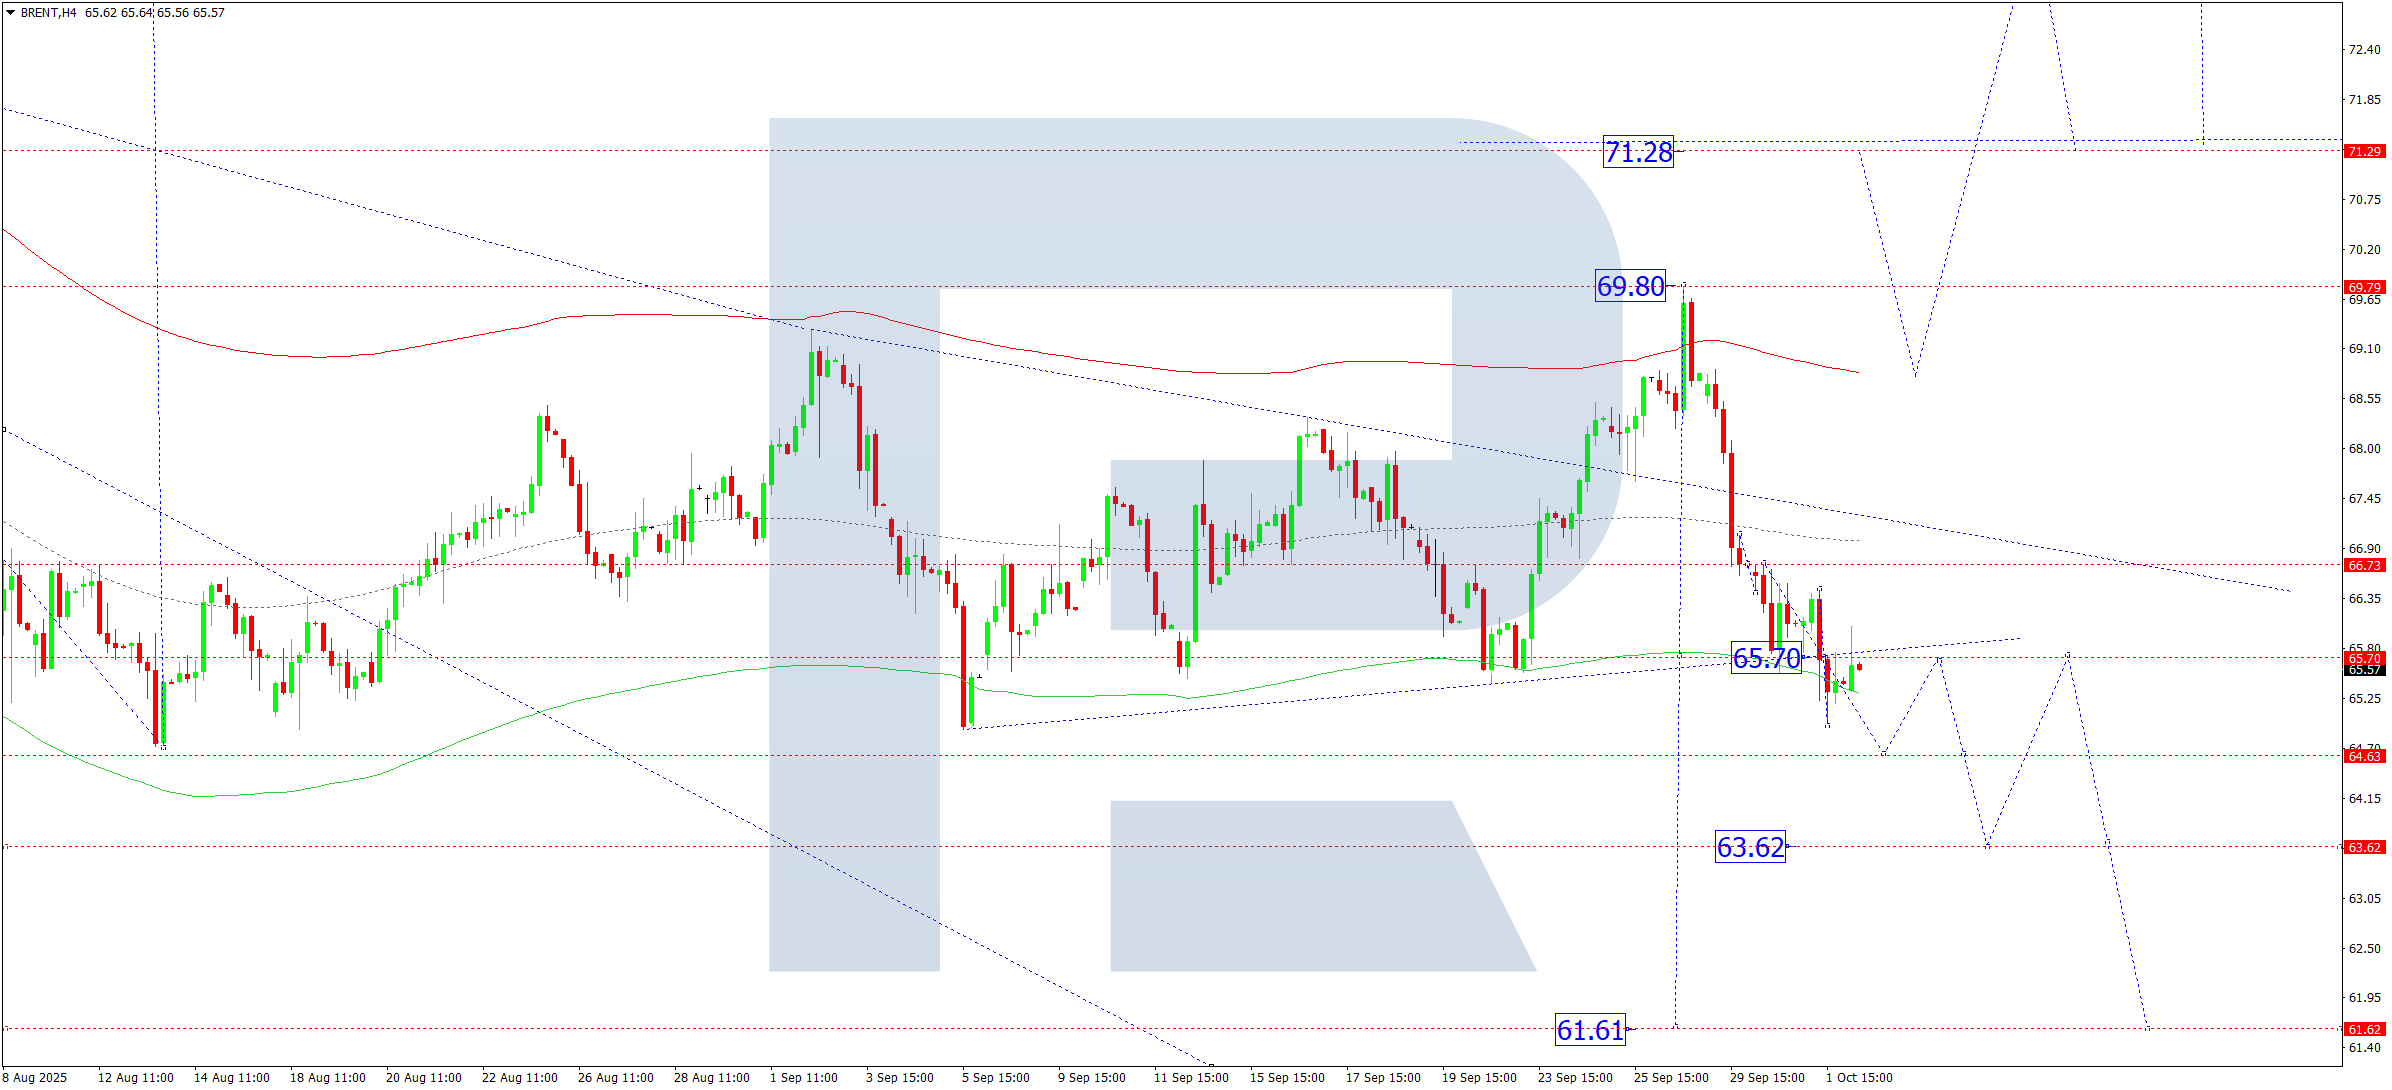
On the H4 chart of Brent crude oil, the market is forming a consolidation range around 65.70. Today, 2 October 2025, a downward expansion to 64.64 is expected, followed by growth to 65.70. An upward breakout may start a new growth wave towards 68.40. A downward breakout may lead to continuation of the trend towards 63.63.
Technically, this scenario is confirmed by the Elliott wave structure and the downward wave Matrix with a pivot at 66.73. This level is considered key in the Brent wave structure. At the moment, the market has completed a wave towards the lower boundary of the Price Envelope at 65.55. Further development of consolidation around 65.70 is relevant. An upward breakout would indicate the beginning of a wave towards its upper boundary at 68.40.
Technical indicators for today’s Brent forecast suggest a decline to 64.64.
Forecasts presented in this section only reflect the author’s private opinion and should not be considered as guidance for trading. RoboForex bears no responsibility for trading results based on trading recommendations described in these analytical reviews.