Daily technical analysis and forecast for 15 September 2025
Here is a detailed daily technical analysis and forecast for EURUSD, USDJPY, GBPUSD, AUDUSD, USDCAD, XAUUSD and Brent for 15 September 2025.
EURUSD forecast
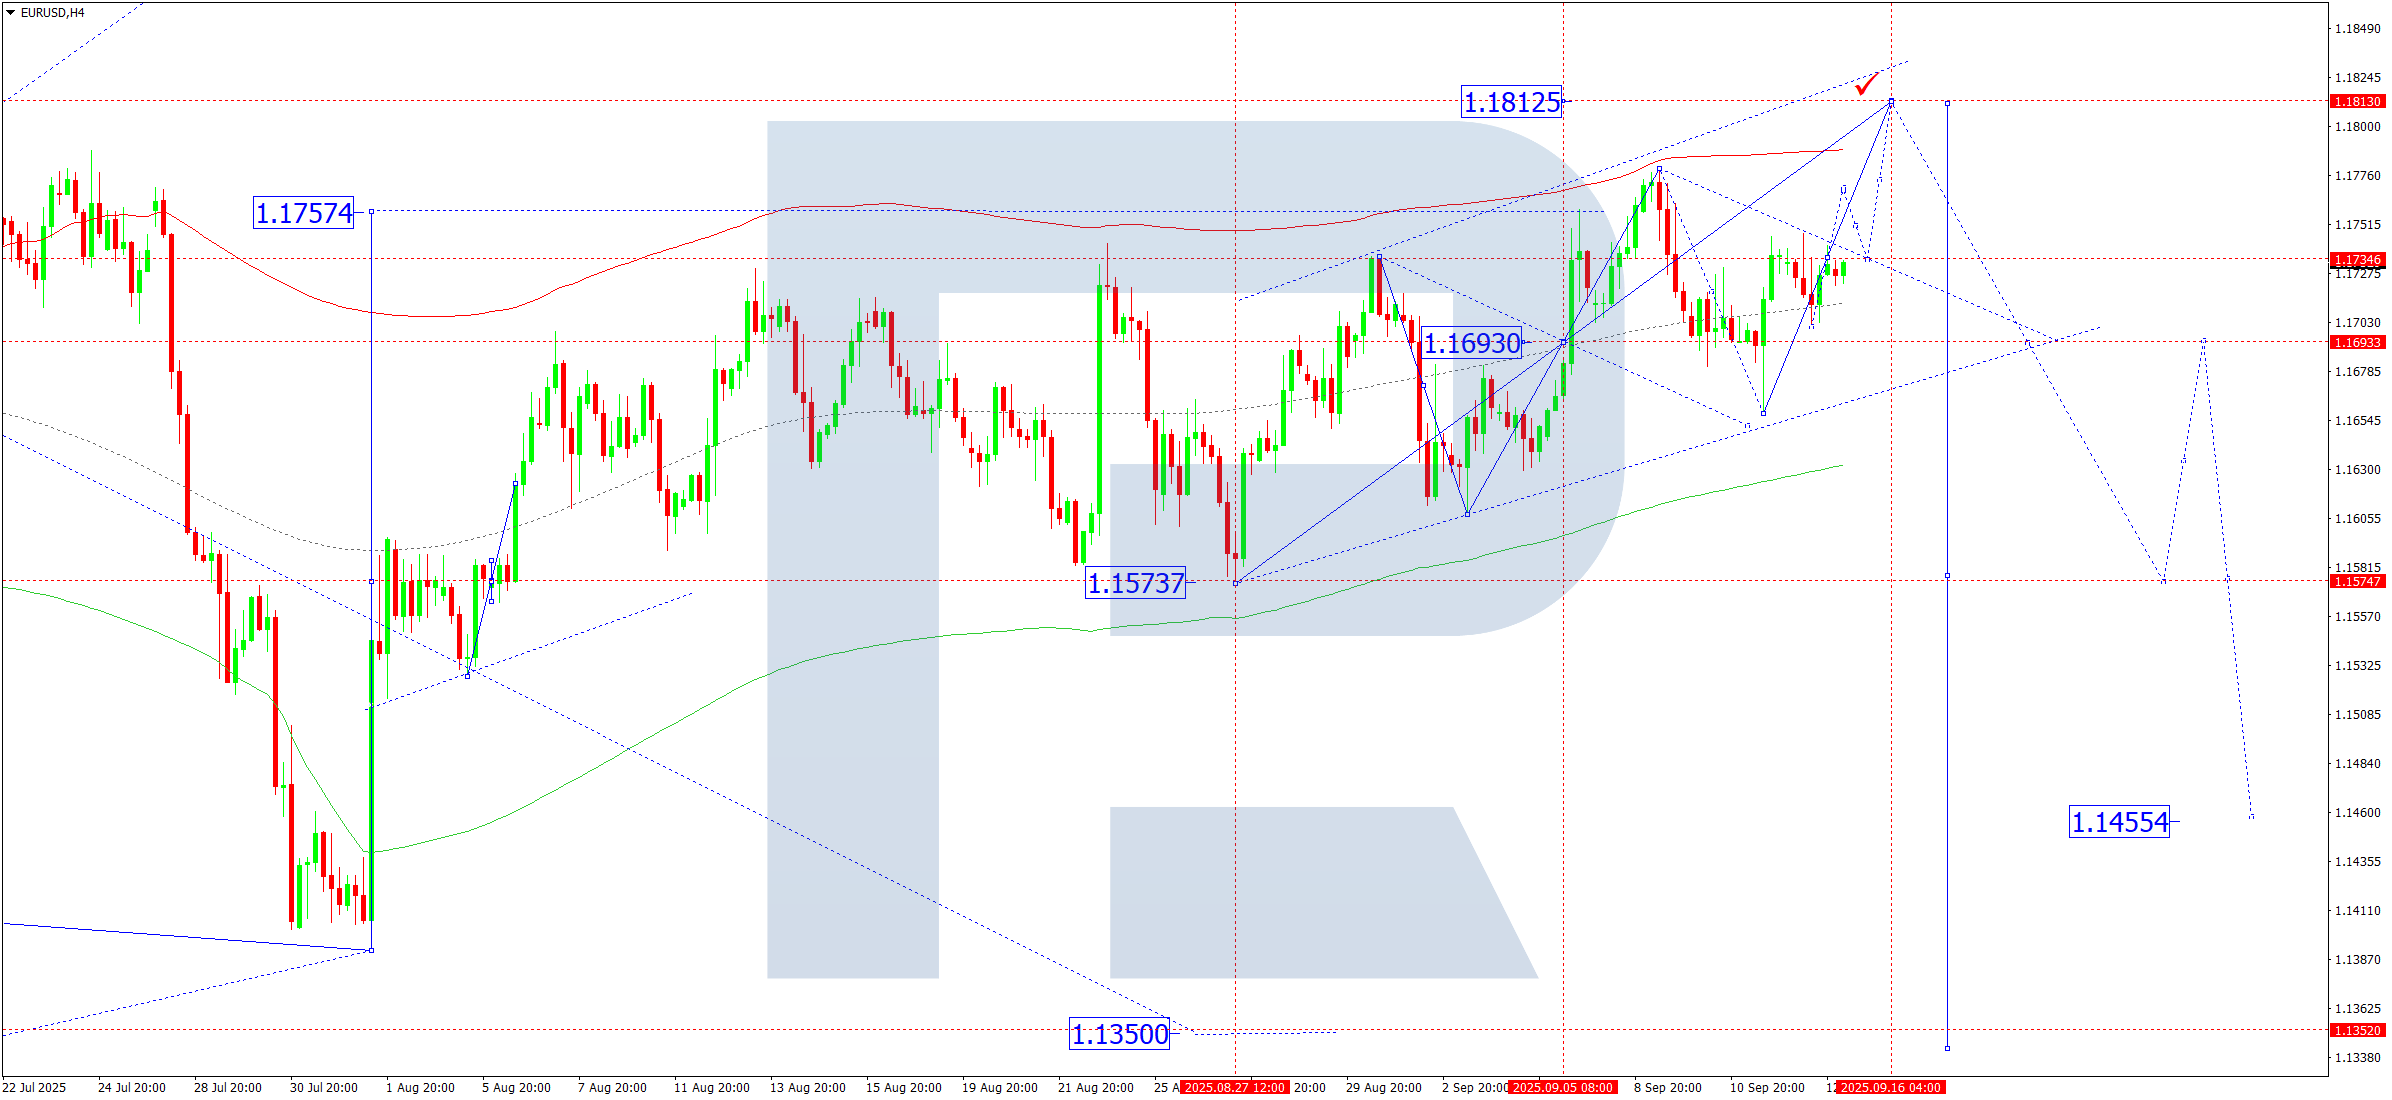
On the EURUSD H4 chart, the market formed a consolidation range around 1.1693. The range expanded upwards to 1.1777 and corrected to 1.1660. Today, 15 September 2025, a rise to 1.1770 is expected. Later, another correction to 1.1740 (testing from above) is possible, with a new consolidation range forming around 1.1740. A further growth wave to 1.1812 is also possible.
Technically, the Elliott wave structure and the growth wave matrix with a pivot at 1.1693 confirm this scenario for EURUSD. At the moment, the market continues to develop a growth wave towards the upper boundary of the Price Envelope at 1.1812.
Technical indicators for today’s EURUSD forecast suggest a continued growth wave to 1.1812.
USDJPY forecast
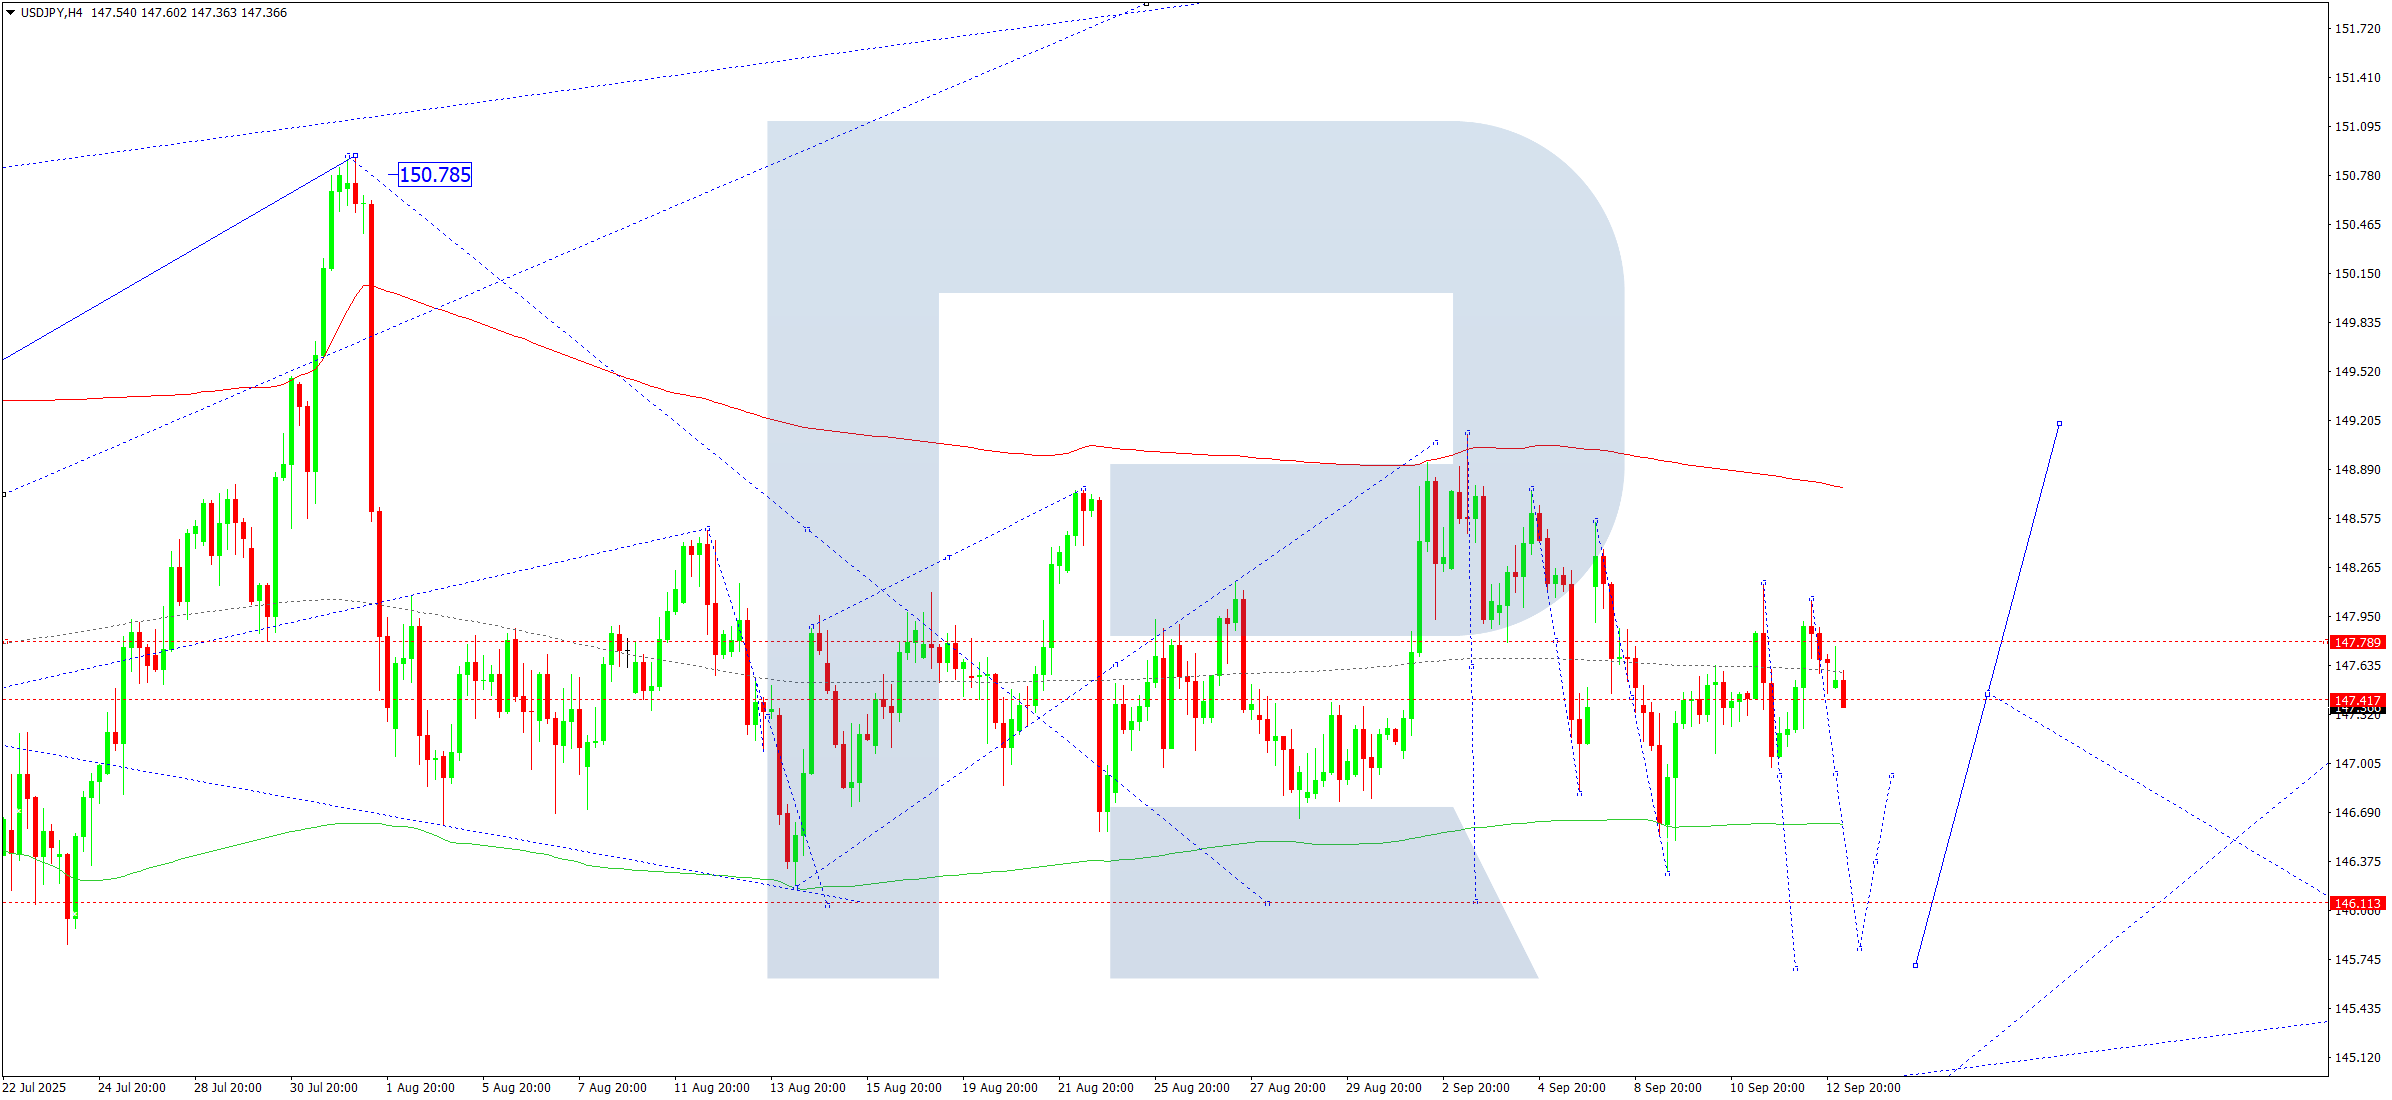
On the USDJPY H4 chart, the market broke below 147.80 and continues its downward wave to 146.11 at minimum. Today, 15 September 2025, a decline to 147.00 is expected. A breakout below this level may extend the wave to 146.11 with further continuation to 145.70.
Technically, the Elliott wave structure and the downward wave matrix with a pivot at 148.50 confirm this scenario for USDJPY. At the moment, the market is consolidating around the central line of the Price Envelope at 147.40. A downward breakout towards the lower boundary at 146.11 is expected.
Technical indicators for today’s USDJPY forecast suggest a decline to 146.11.
GBPUSD forecast
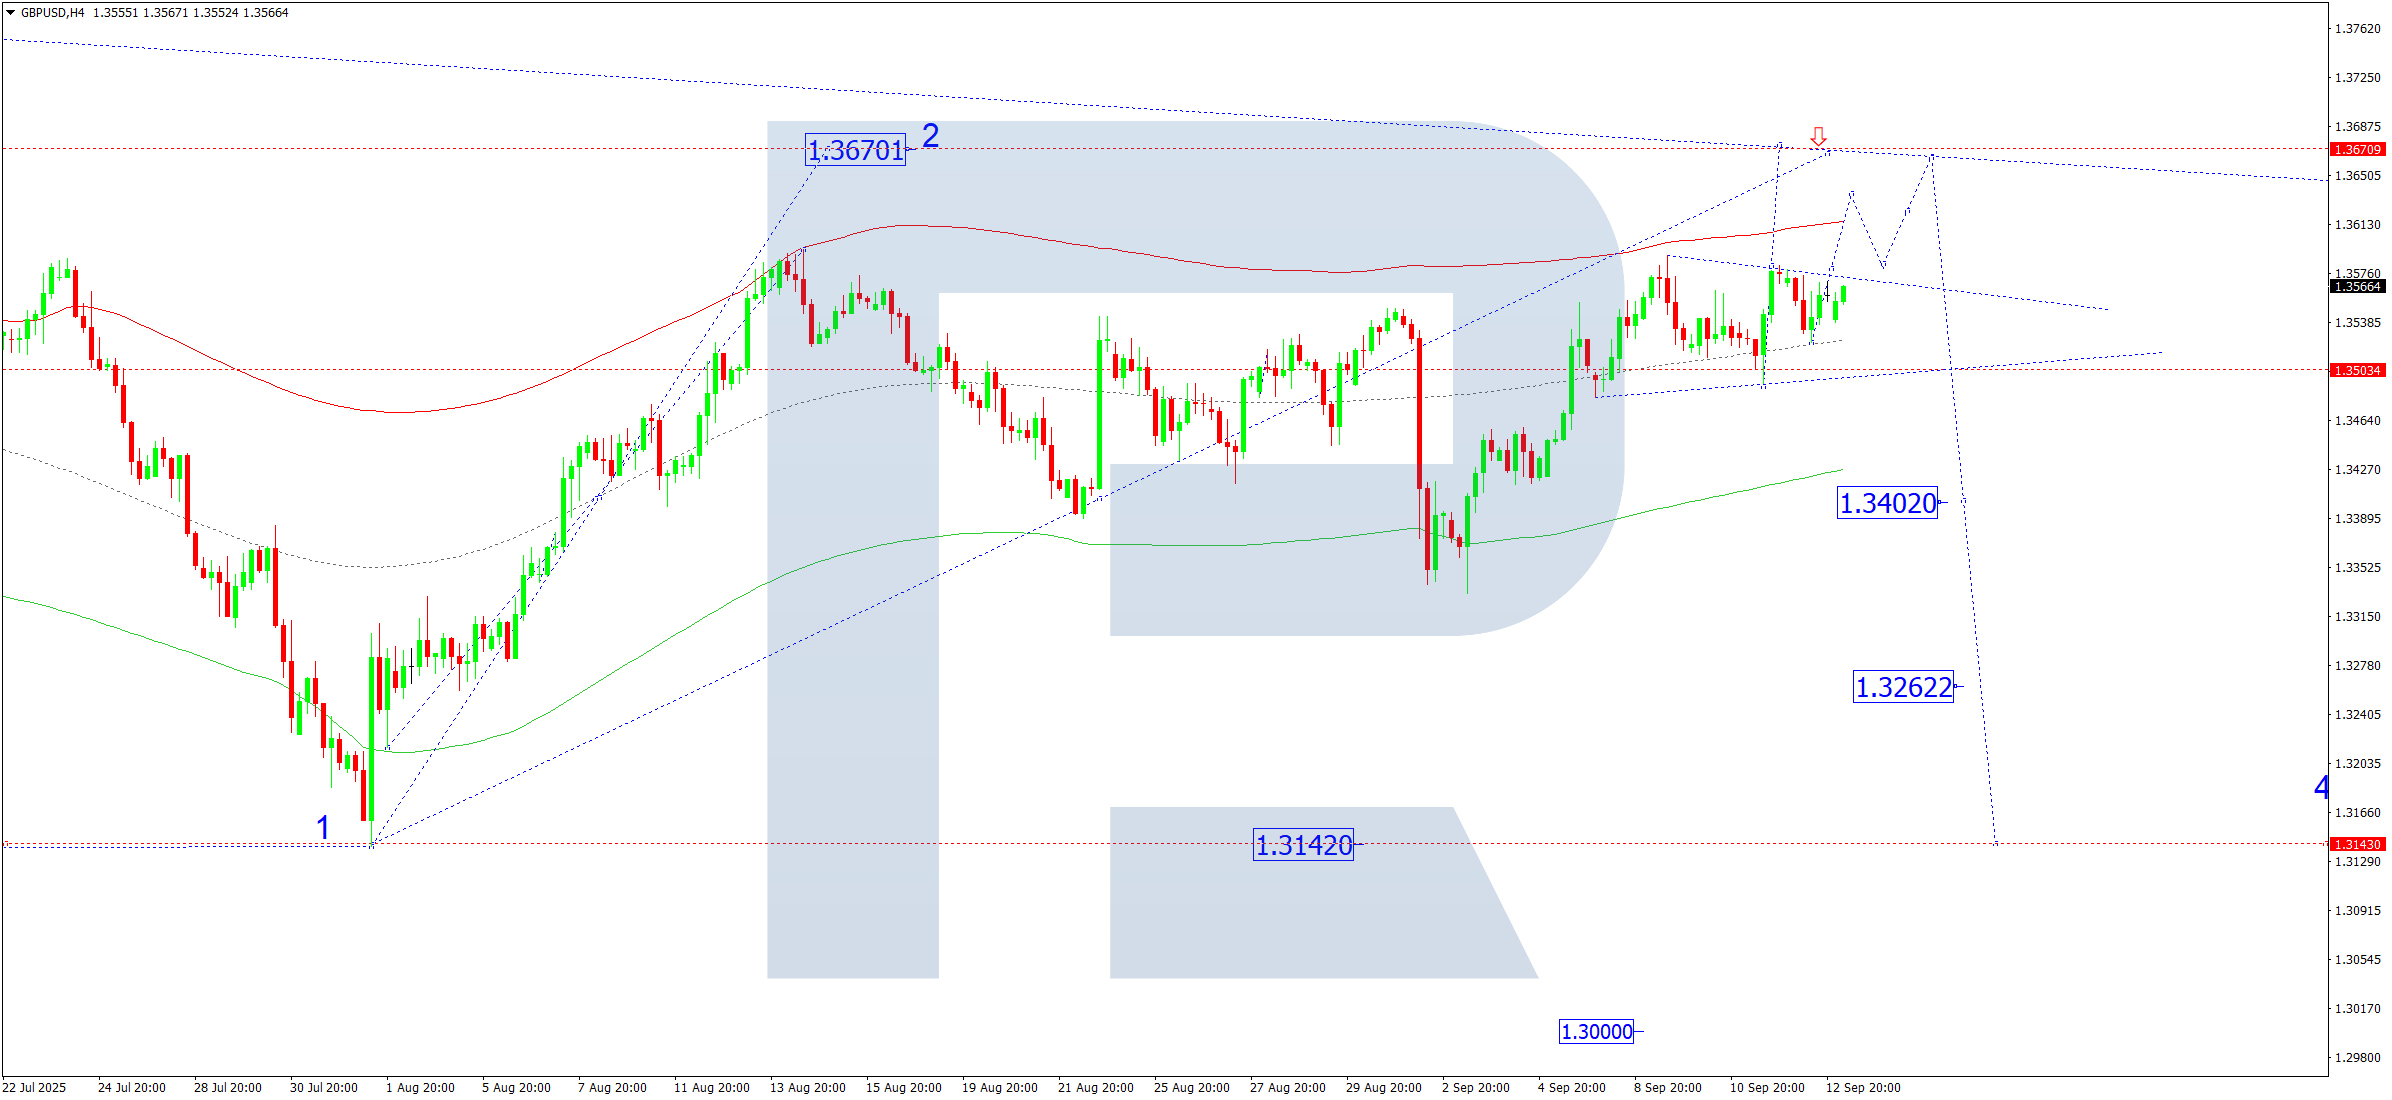
On the GBPUSD H4 chart, the market continues to consolidate around 1.3500. Today, 15 September 2025, the market received support at this level and continues a growth wave to 1.3636. Later, a correction towards 1.3580 (testing from above) is possible, followed by growth to 1.3670.
Technically, the Elliott wave structure and the growth wave matrix with a pivot at 1.3400 confirm this scenario for GBPUSD. At the moment, the market is consolidating around the central line of the Price Envelope at 1.3500, with expectations of growth to its upper boundary at 1.3670.
Technical indicators for today’s GBPUSD forecast suggest a continuation of the growth wave to 1.3670.
AUDUSD forecast
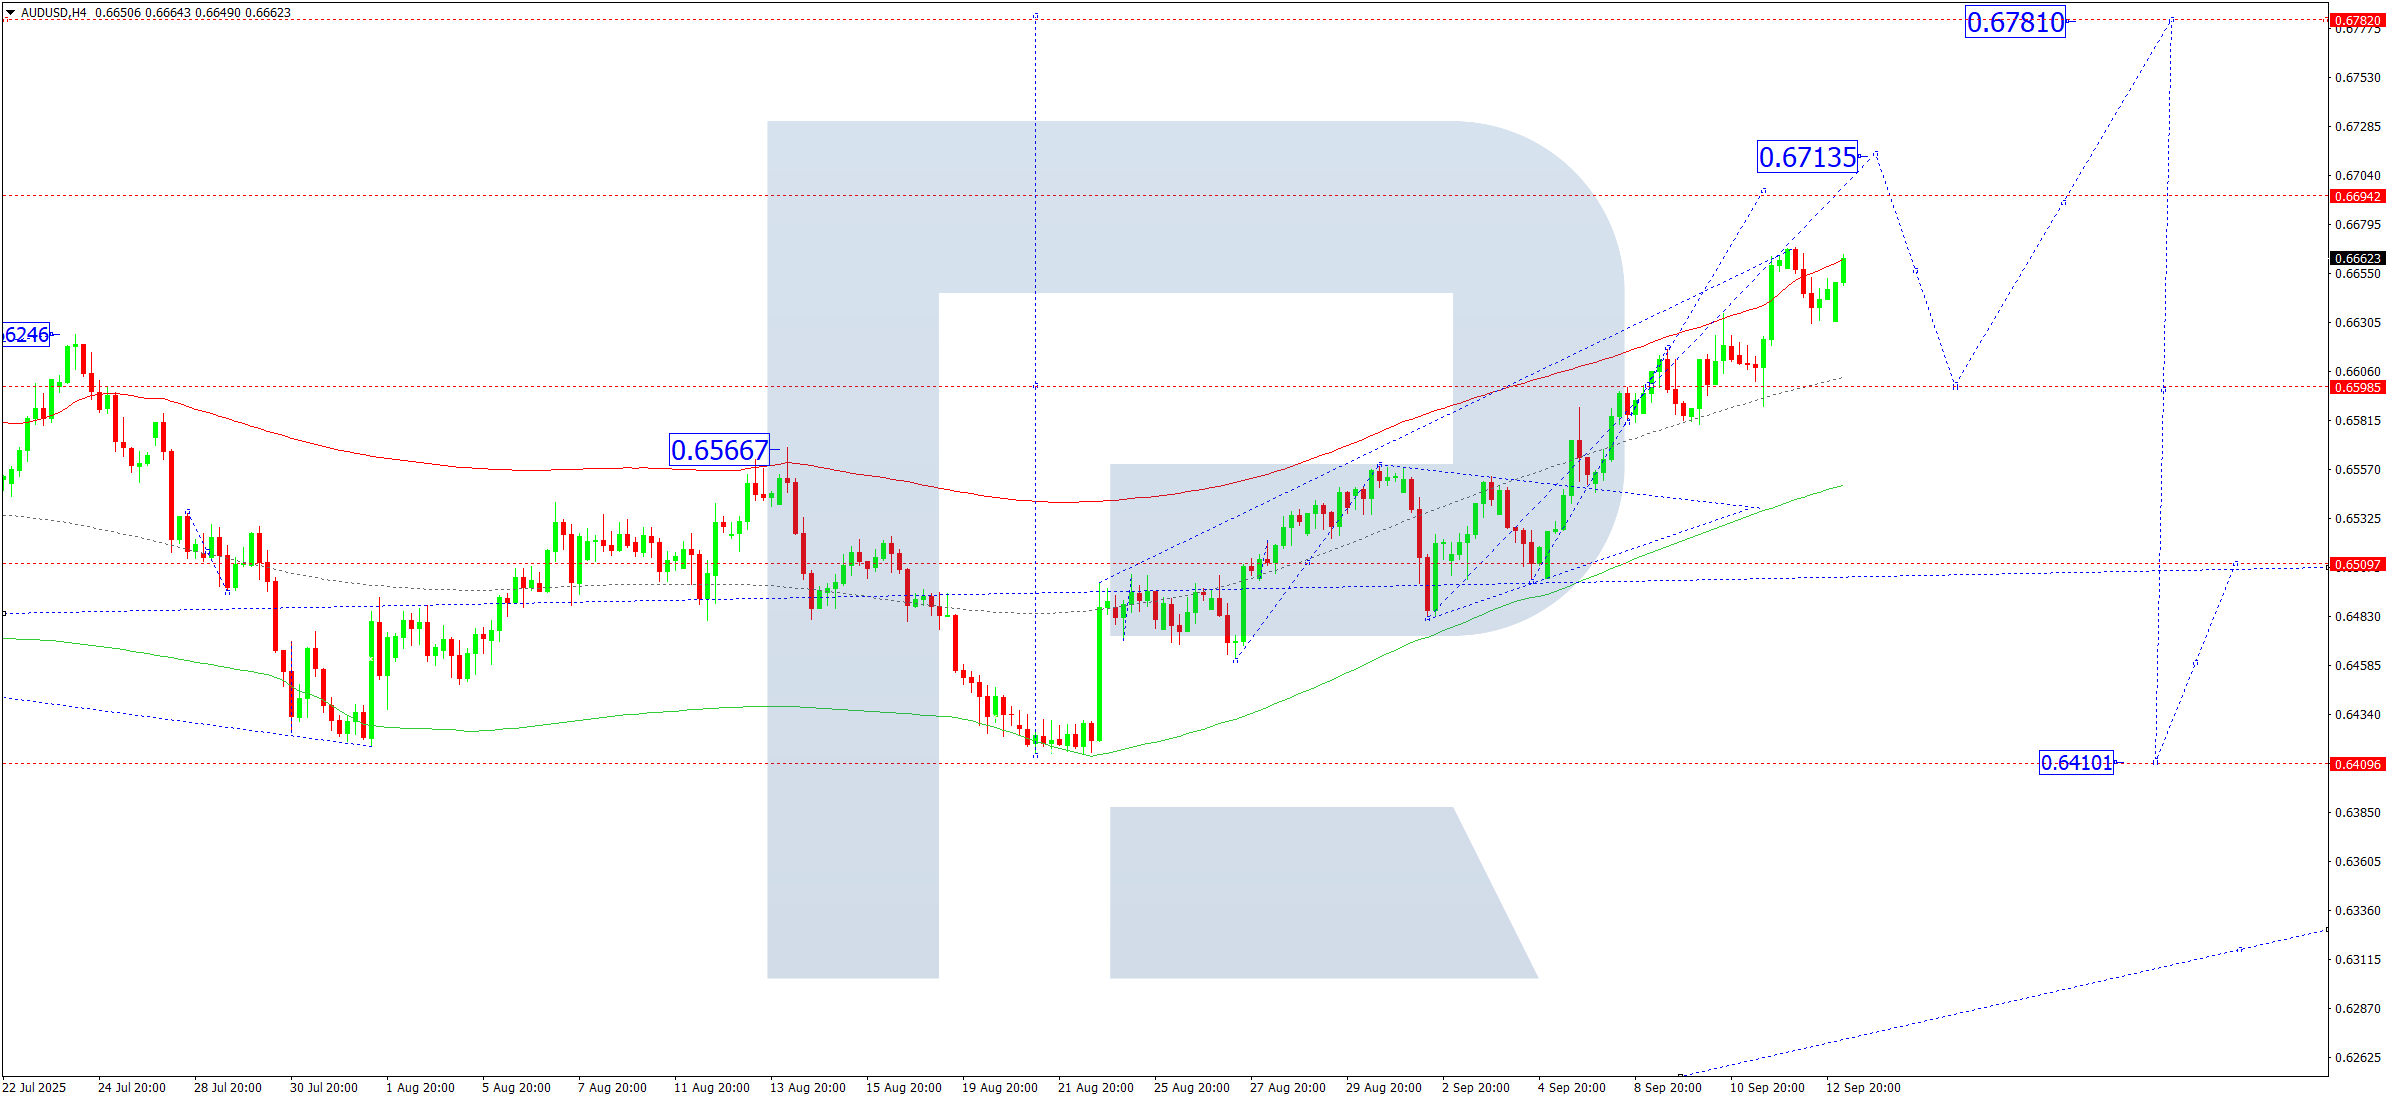
On the AUDUSD H4 chart, the market broke out upwards from its consolidation range, opening potential for a continued move towards 0.6713. Today, 15 September 2025, the price is expected to reach this level. Later, a correction towards 0.6600 is possible, followed by another upward wave to 0.6780.
Technically, the Elliott wave structure and the growth wave matrix with a pivot at 0.6600 confirm this scenario for AUDUSD. At the moment, the market is rising towards the upper boundary of the Price Envelope at 0.6713.
Technical indicators for today’s AUDUSD forecast suggest a growth wave towards 0.6713.
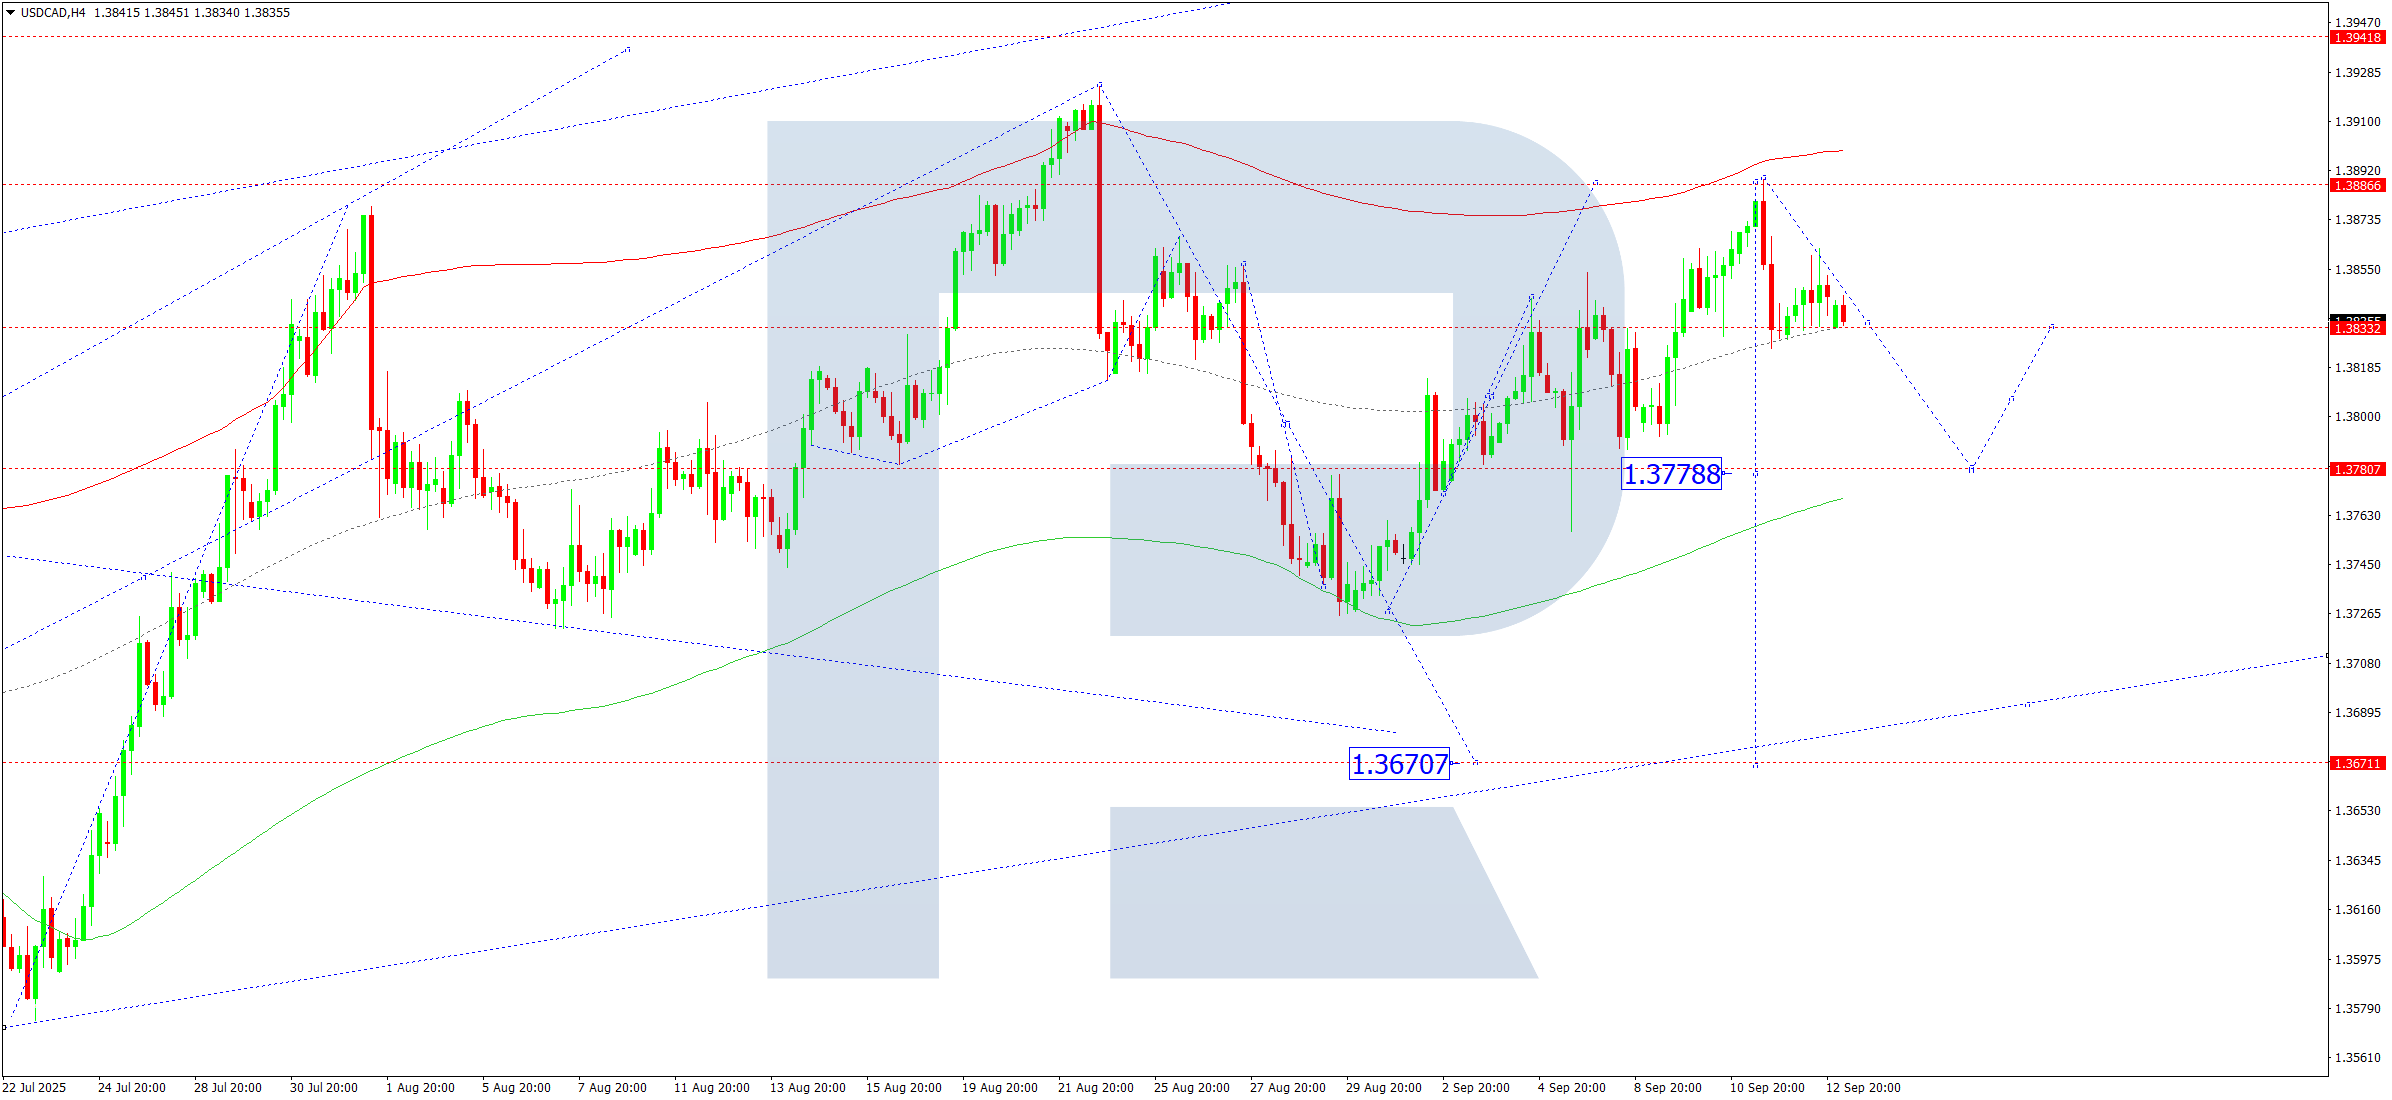
USDCAD forecast
On the USDCAD H4 chart, the market completed a growth wave, reaching 1.3888. Today, 15 September 2025, a downward wave to 1.3777 is possible, with the trend potentially continuing towards 1.3670.
Technically, the Elliott wave structure and the downward wave matrix with a pivot at 1.3800 confirm this scenario for USDCAD. At the moment, the market is forming a downward wave towards the lower boundary of the Price Envelope at 1.3777. Later, a retest of its central line at 1.3800 from below is possible, followed by another decline towards its lower boundary at 1.3670.
Technical indicators for today’s USDCAD forecast suggest a decline to 1.3777.
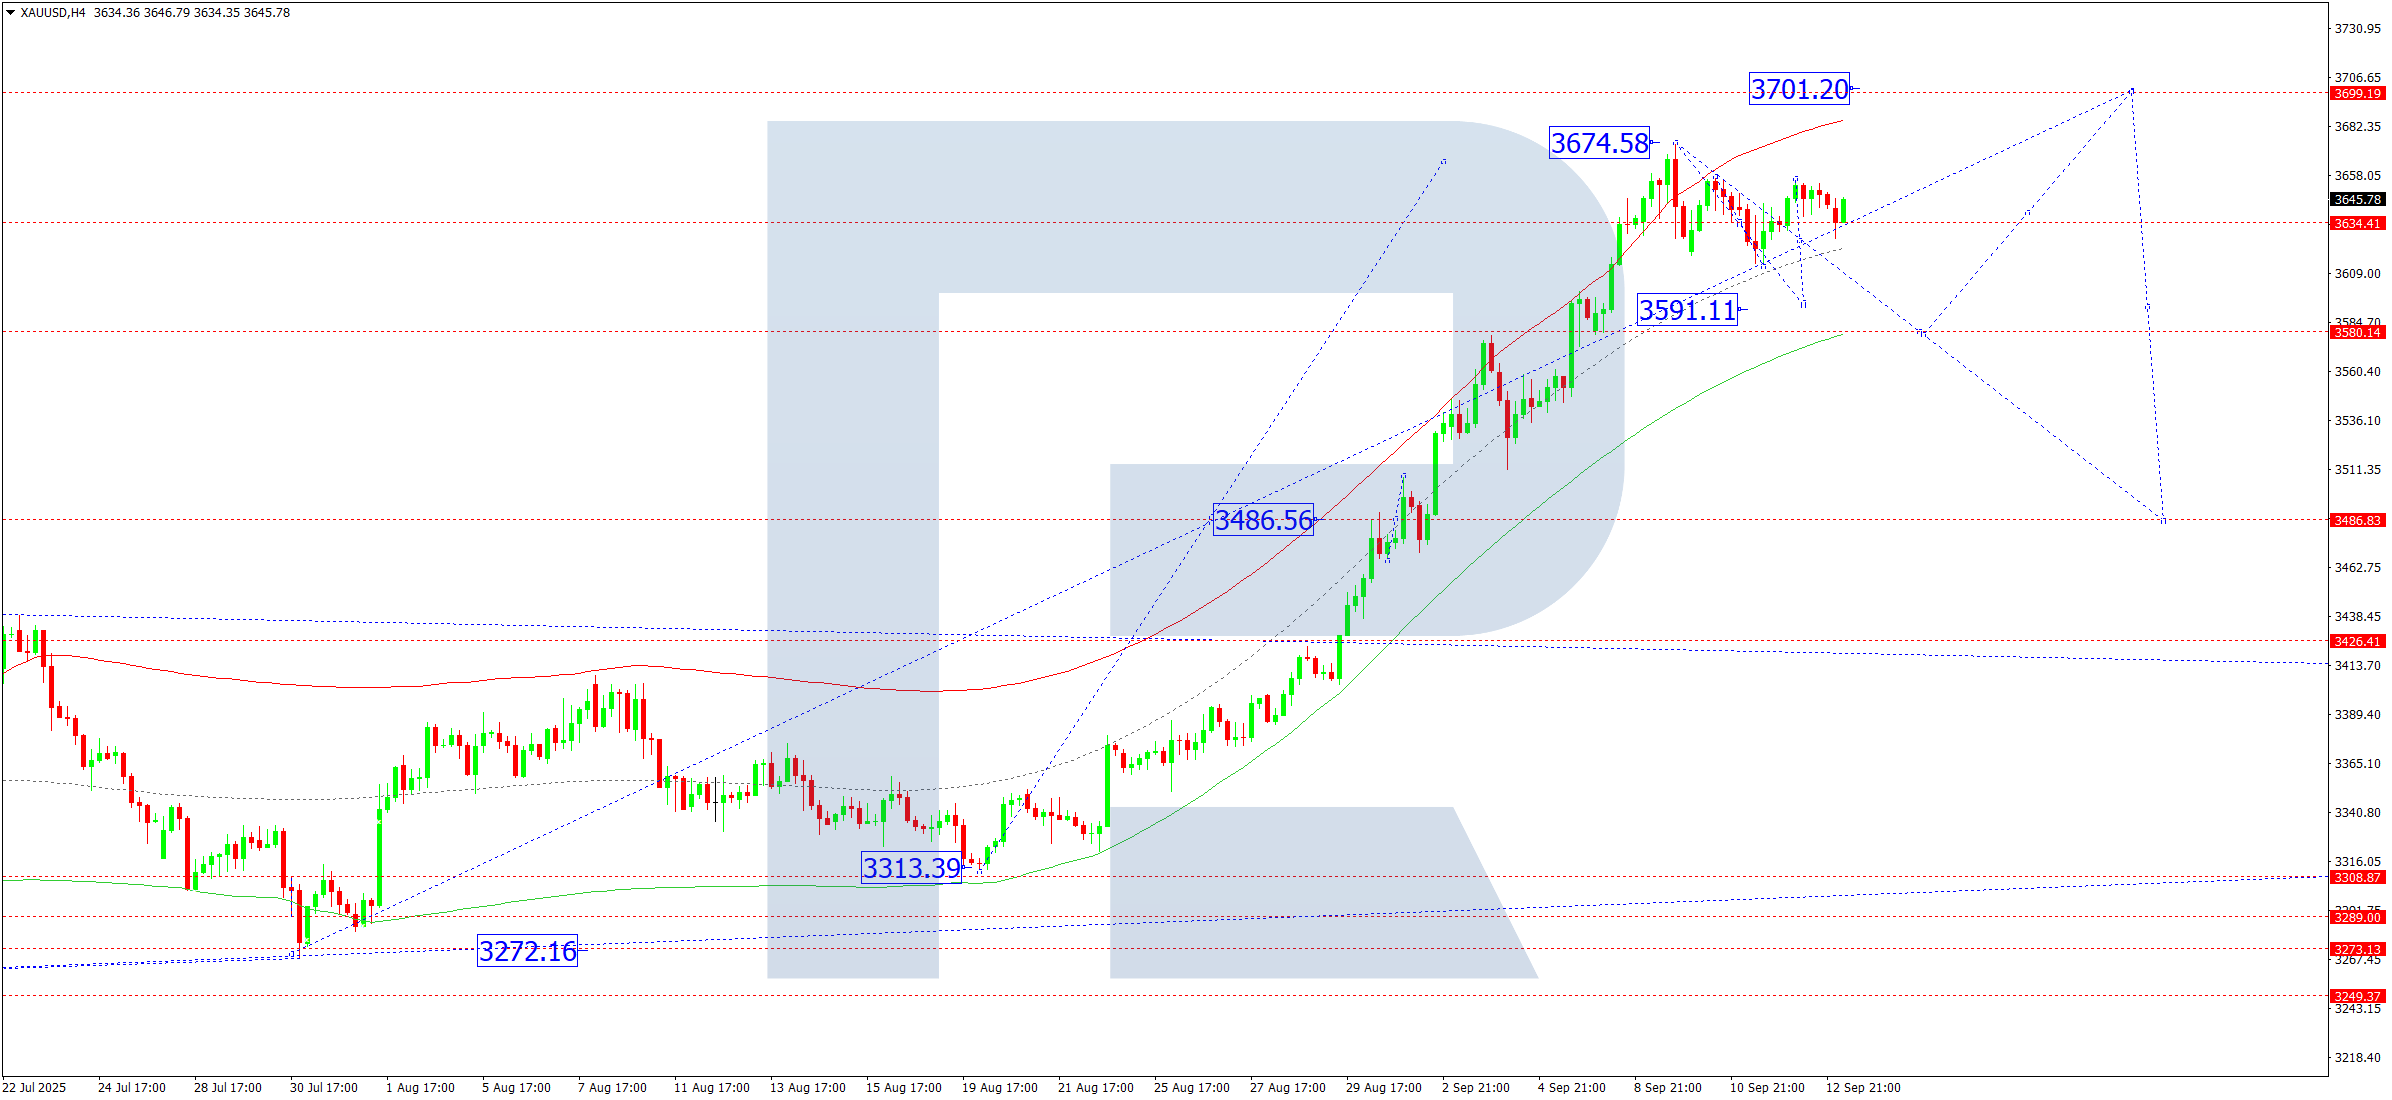
XAUUSD forecast
On the XAUUSD H4 chart, the market formed a consolidation range around 3,486 and broke upwards, completing a local growth wave to 3,675. Today, 15 September 2025, a consolidation range is forming around 3,636. A decline to 3,590 is possible, followed by a further correction towards 3,486. Later, another upward structure to 3,700 may develop.
Technically, the Elliott wave structure and the growth wave matrix with a pivot at 3,486 confirm this scenario for XAUUSD. At the moment, the market completed a growth wave, reaching the upper boundary of the Price Envelope at 3,675. A decline to its central line at 3,590 is expected, with a possible continuation to its lower boundary at 3,486.
Technical indicators for today’s XAUUSD forecast suggest a continued downward movement towards 3,590.
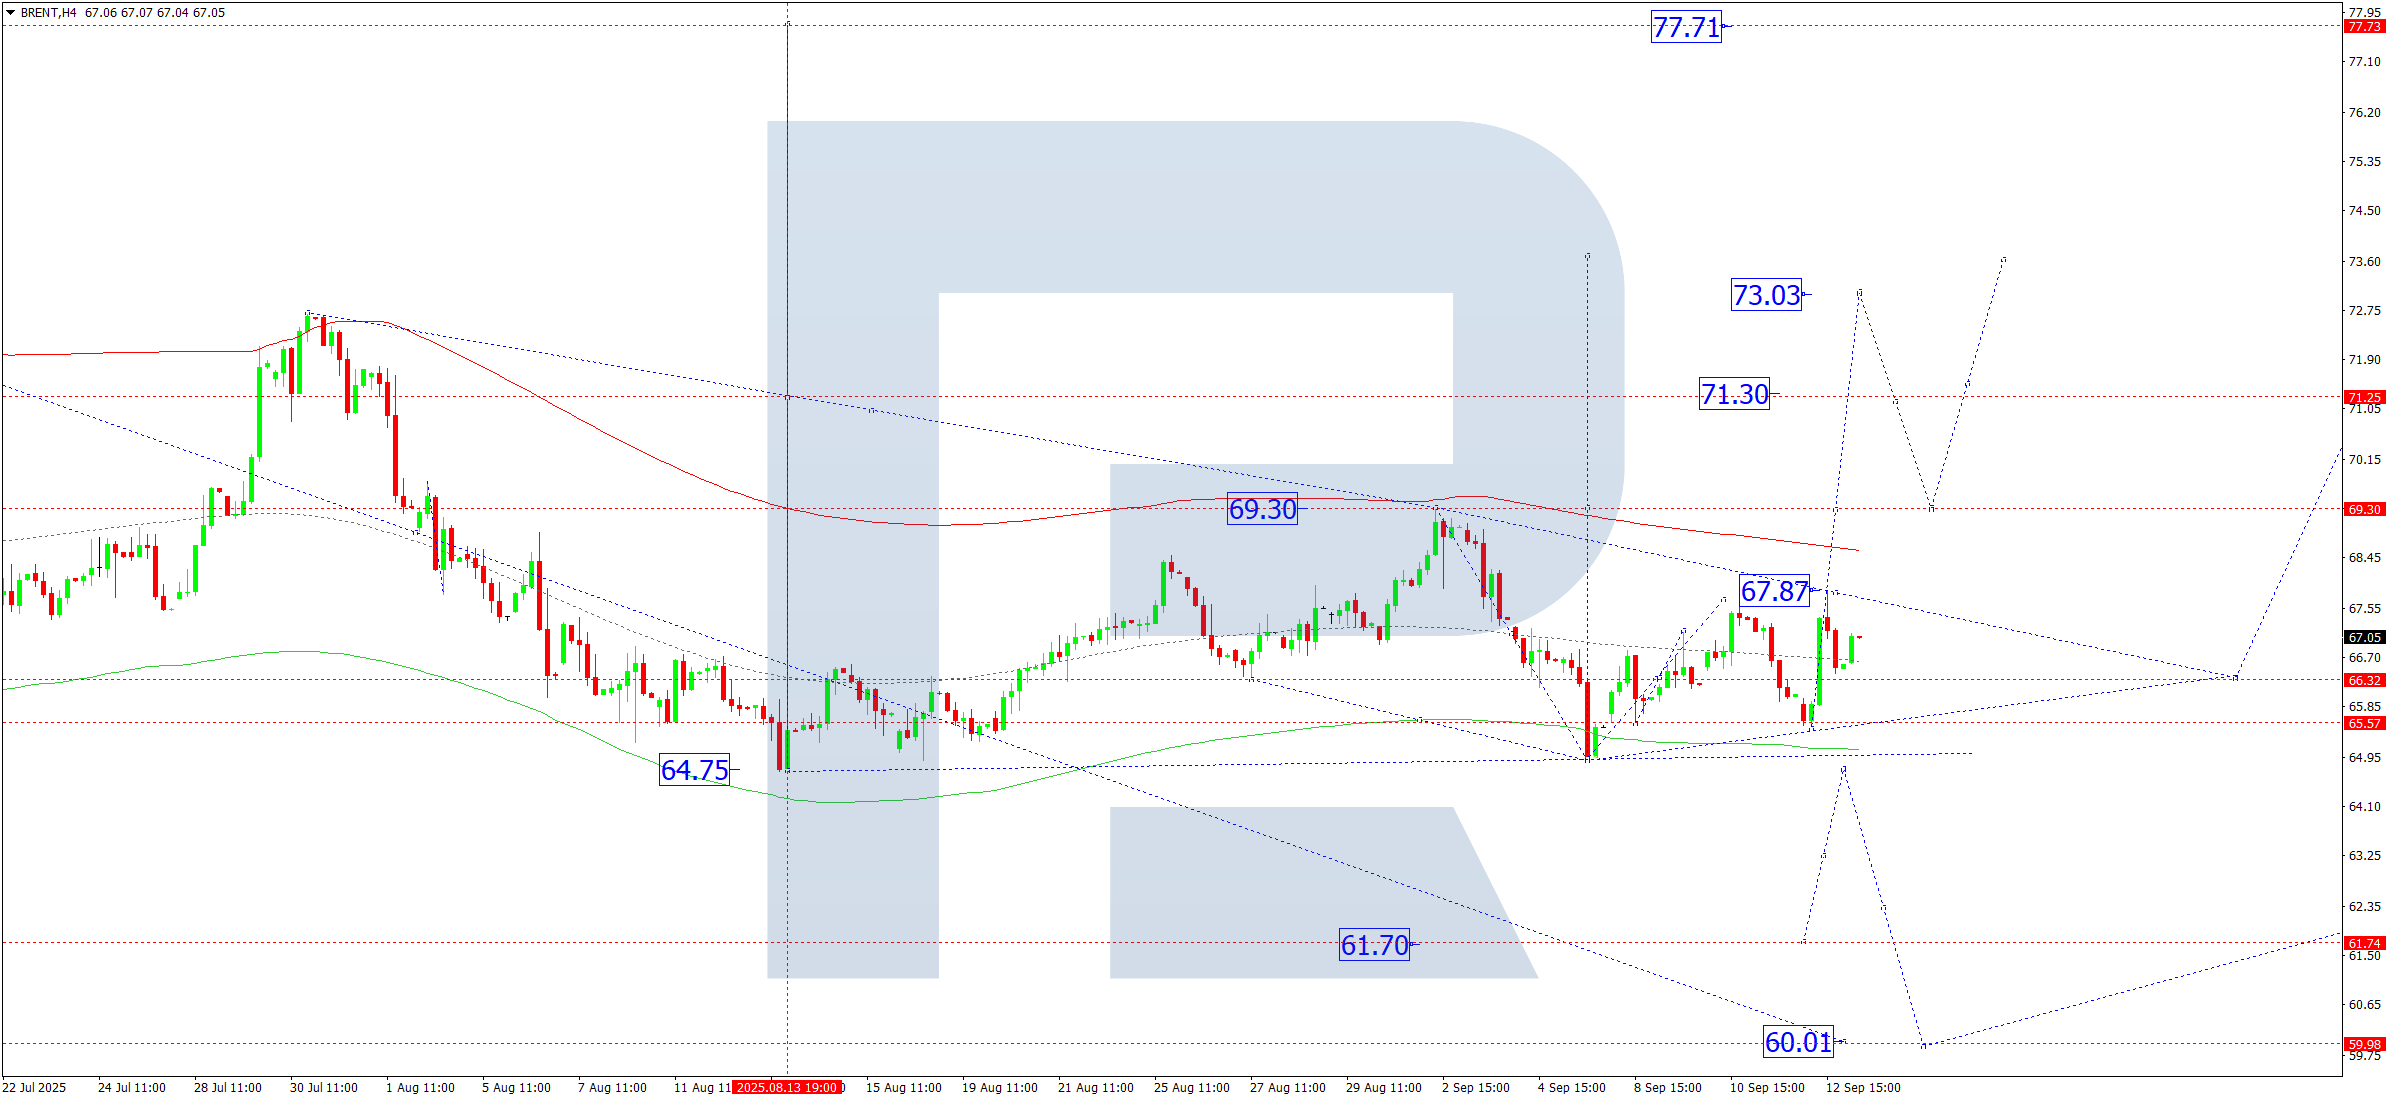
Brent forecast
On the Brent H4 chart, the market continues to consolidate broadly around 67.00. Today, 15 September 2025, a growth move to 69.30 is possible. A breakout of this level may extend the wave to 73.00. A decline to 65.55 and its breakout may open the potential for a continued move down to 61.70.
Technically, the Elliott wave structure and the growth wave matrix with a pivot at 67.00 confirm this scenario for Brent. At the moment, the market continues to develop a growth wave to the upper boundary of the Price Envelope at 69.30. Later, a correction to its central line at 67.00 is possible.
Technical indicators for today’s Brent forecast suggest a growth wave to 69.30.
Forecasts presented in this section only reflect the author’s private opinion and should not be considered as guidance for trading. RoboForex bears no responsibility for trading results based on trading recommendations described in these analytical reviews.