Daily technical analysis and forecast for 26 August 2025
Here is a detailed daily technical analysis and forecast for EURUSD, USDJPY, GBPUSD, AUDUSD, USDCAD, XAUUSD and Brent for 26 August 2025.
EURUSD forecast
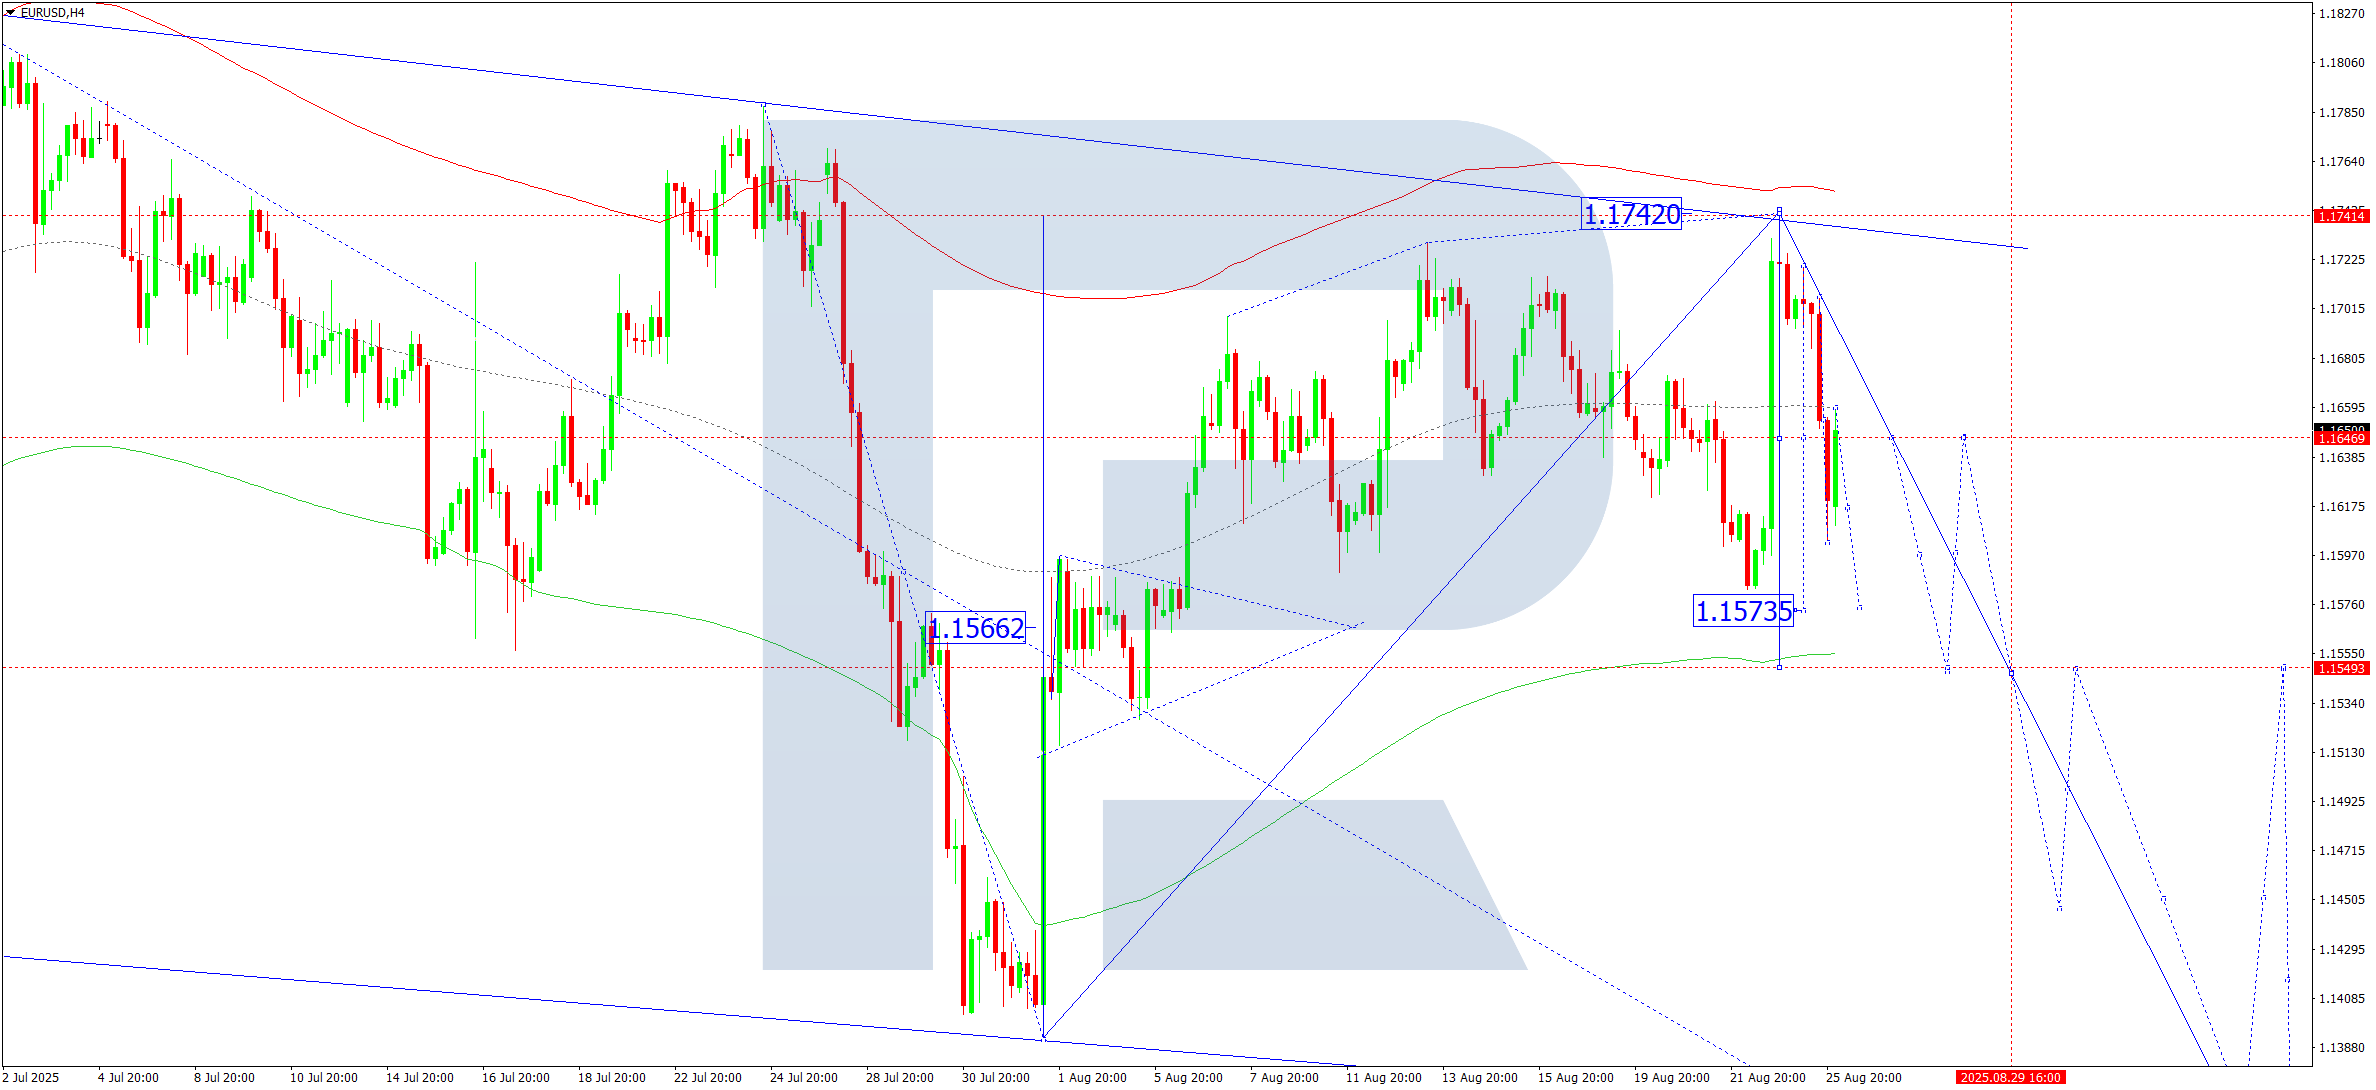
On the H4 chart of EURUSD, the market broke through 1.1650 and continues developing a downward wave to 1.1590. Today, 26 August 2025, we expect this target to be reached. Later, a correction to 1.1620 is possible, followed by another decline to 1.1550 as the first target. Practically, the market continues to develop a wide consolidation range around 1.1650.
Technically, the Elliott wave structure and the downward wave matrix with a pivot at 1.1650 confirm this as the key scenario for EURUSD. At the moment, the market is forming a downward wave to the lower boundary of the Price Envelope at 1.1550.
Technical indicators for today’s EURUSD forecast suggest a further decline to 1.1550.
USDJPY forecast
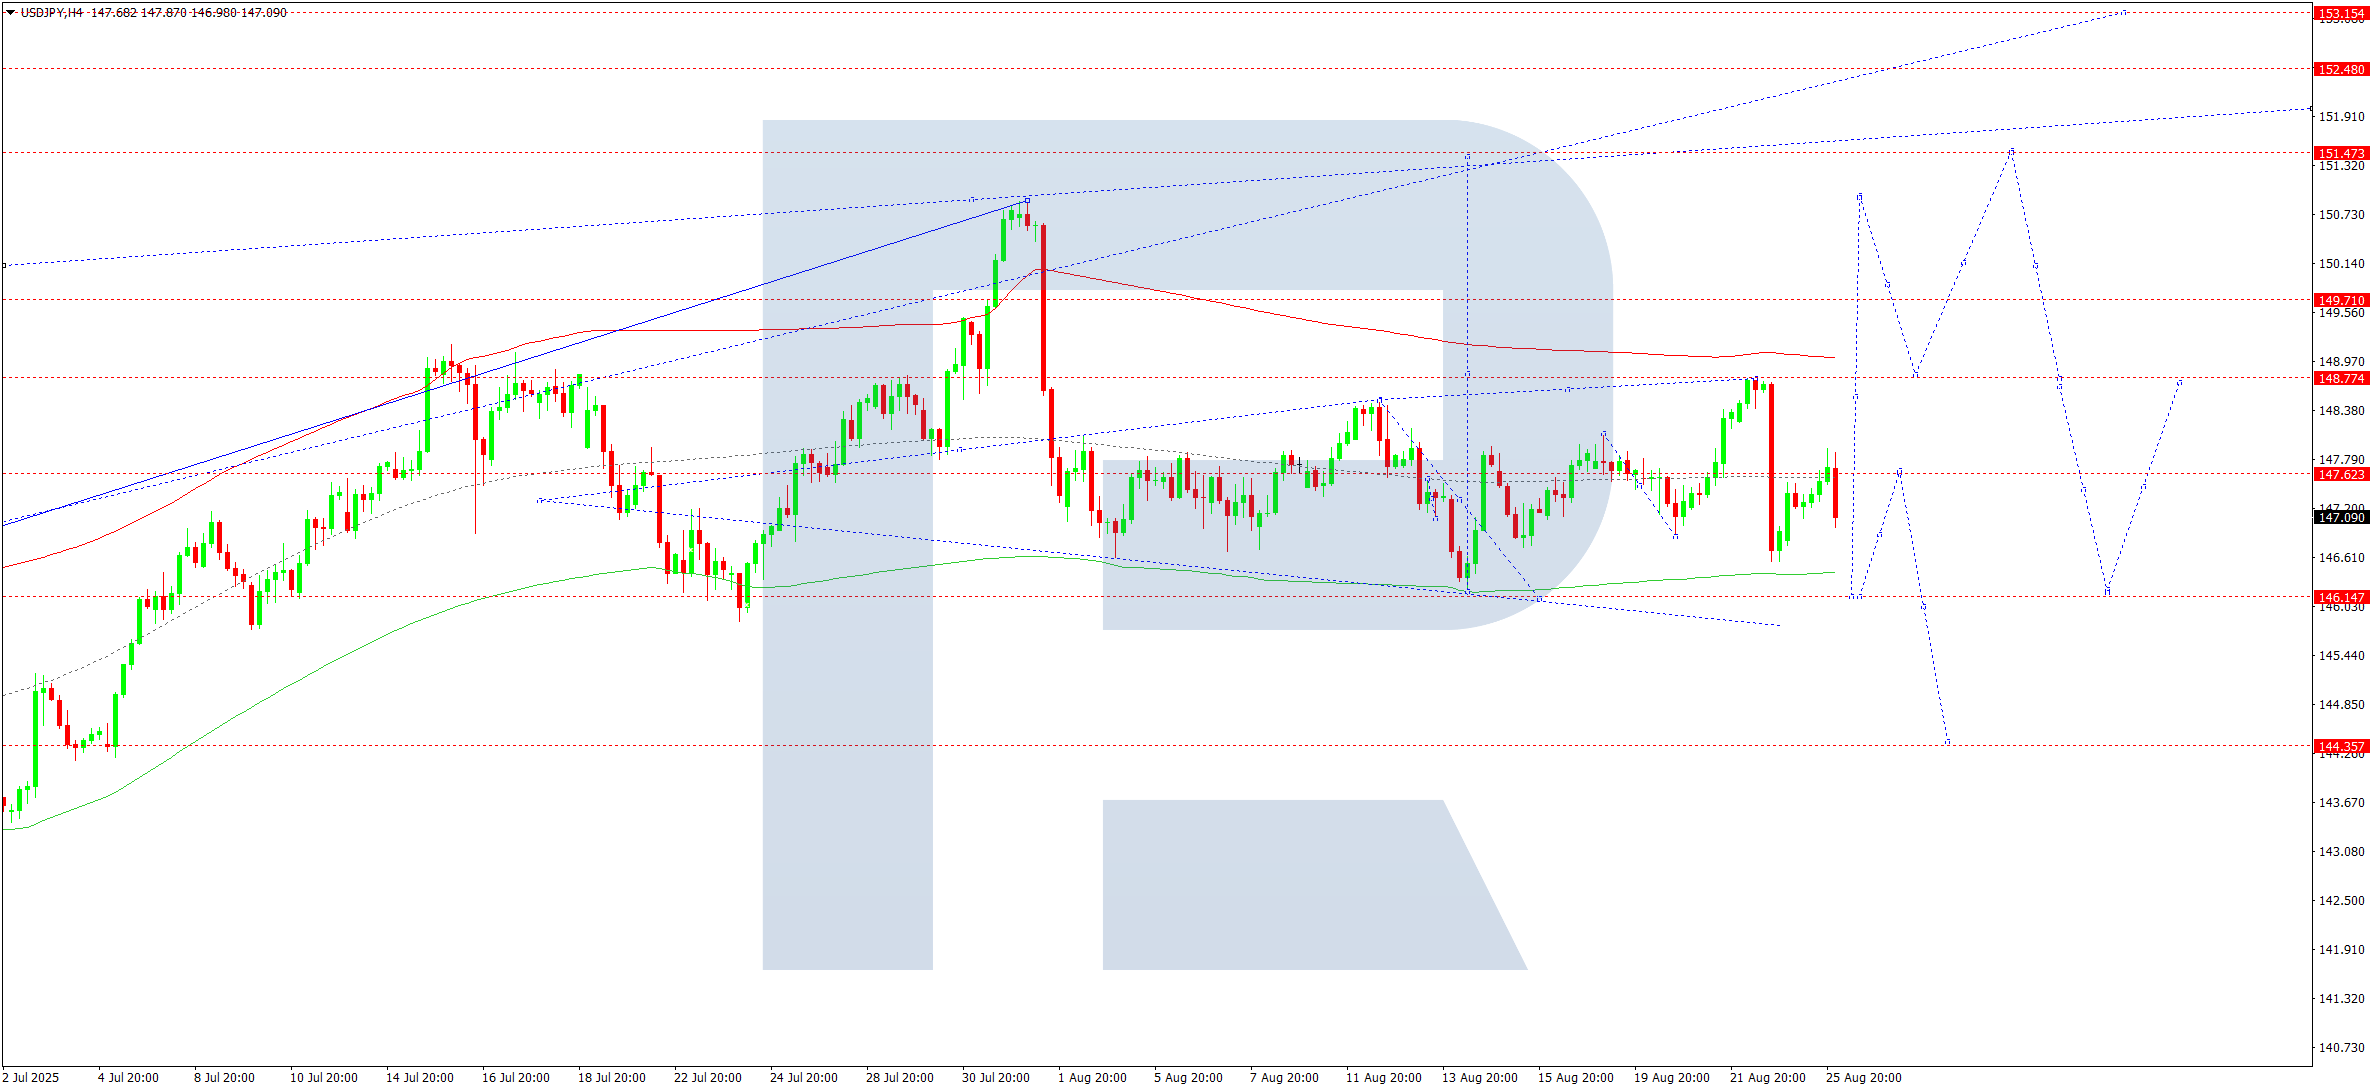
On the H4 chart of USDJPY, the market continues to consolidate around 147.32, with the range extending up to 148.77 and down to 146.55. Today, 26 August 2025, the market continues to develop a downward structure to 146.15. After reaching this level, a rise to 147.60 is possible.
Technically, the Elliott wave structure and the upward wave matrix with a pivot at 146.15 confirm this as the key scenario for USDJPY. At the moment, the market continues to develop a growth wave to the upper boundary of the Price Envelope at 151.47. For now, consolidation continues around the central line at 147.60, with potential expansion down to 146.15.
Technical indicators for today’s USDJPY forecast suggest growth towards 150.75.
GBPUSD forecast
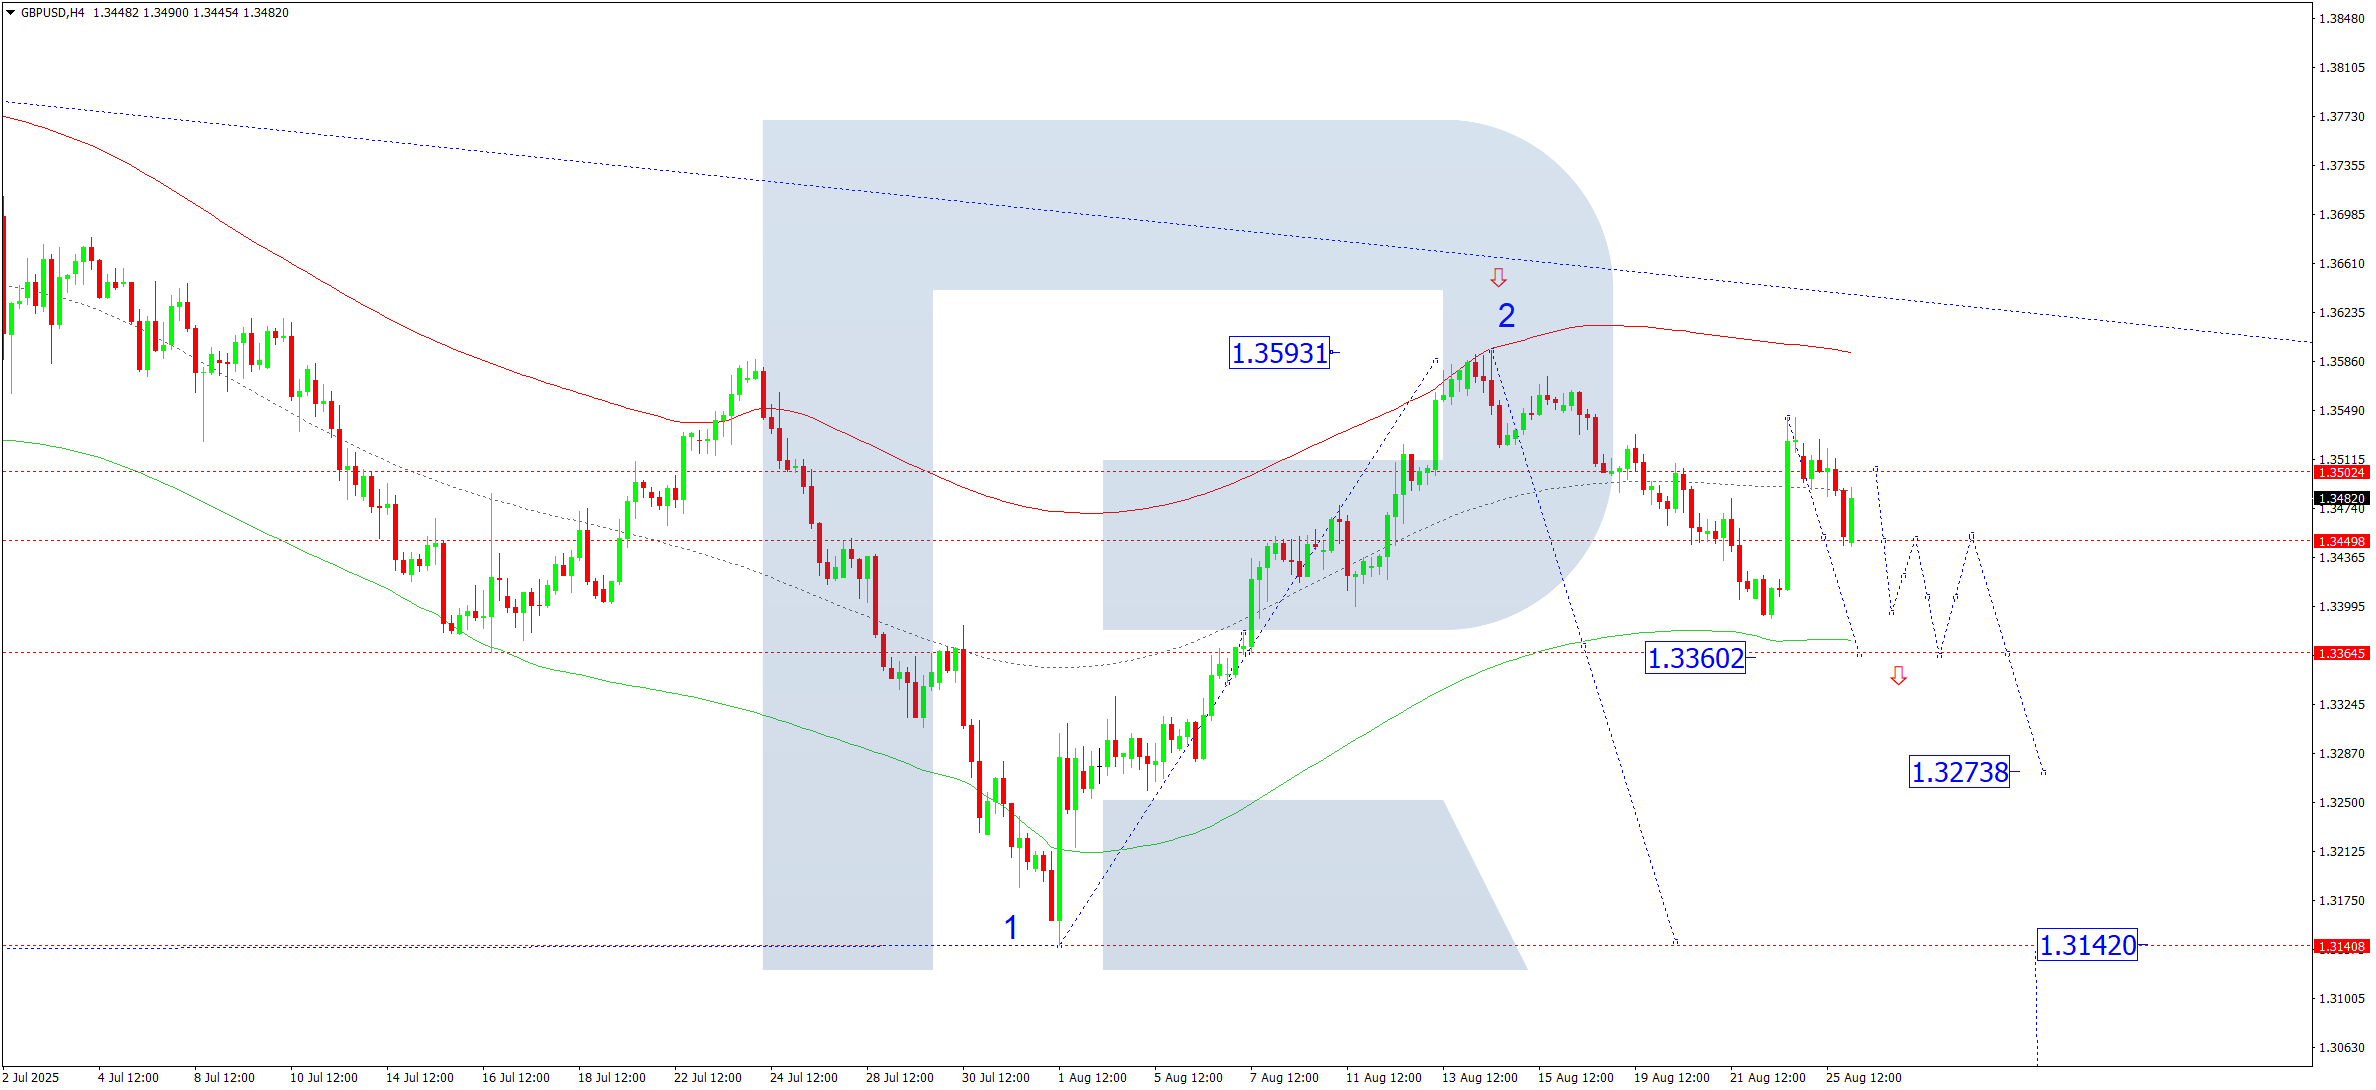
On the H4 chart of GBPUSD, the market continues to develop a downward wave to 1.3360. Today, 26 August 2025, this target may be reached. After that, a correction towards 1.3500 is possible. A wide consolidation range continues to form around this level. A further decline to 1.3140 remains relevant as the first target in the next wave.
Technically, the Elliott wave structure and the downward wave matrix with a pivot at 1.3475 confirm this as the key scenario for the GBPUSD pair. At the moment, the market is forming a downward wave to the lower boundary of the Price Envelope at 1.3360. Later, a correction to its central line at 1.3475 is possible.
Technical indicators for today’s GBPUSD forecast suggest a continuation of the downward wave towards 1.3360.
AUDUSD forecast
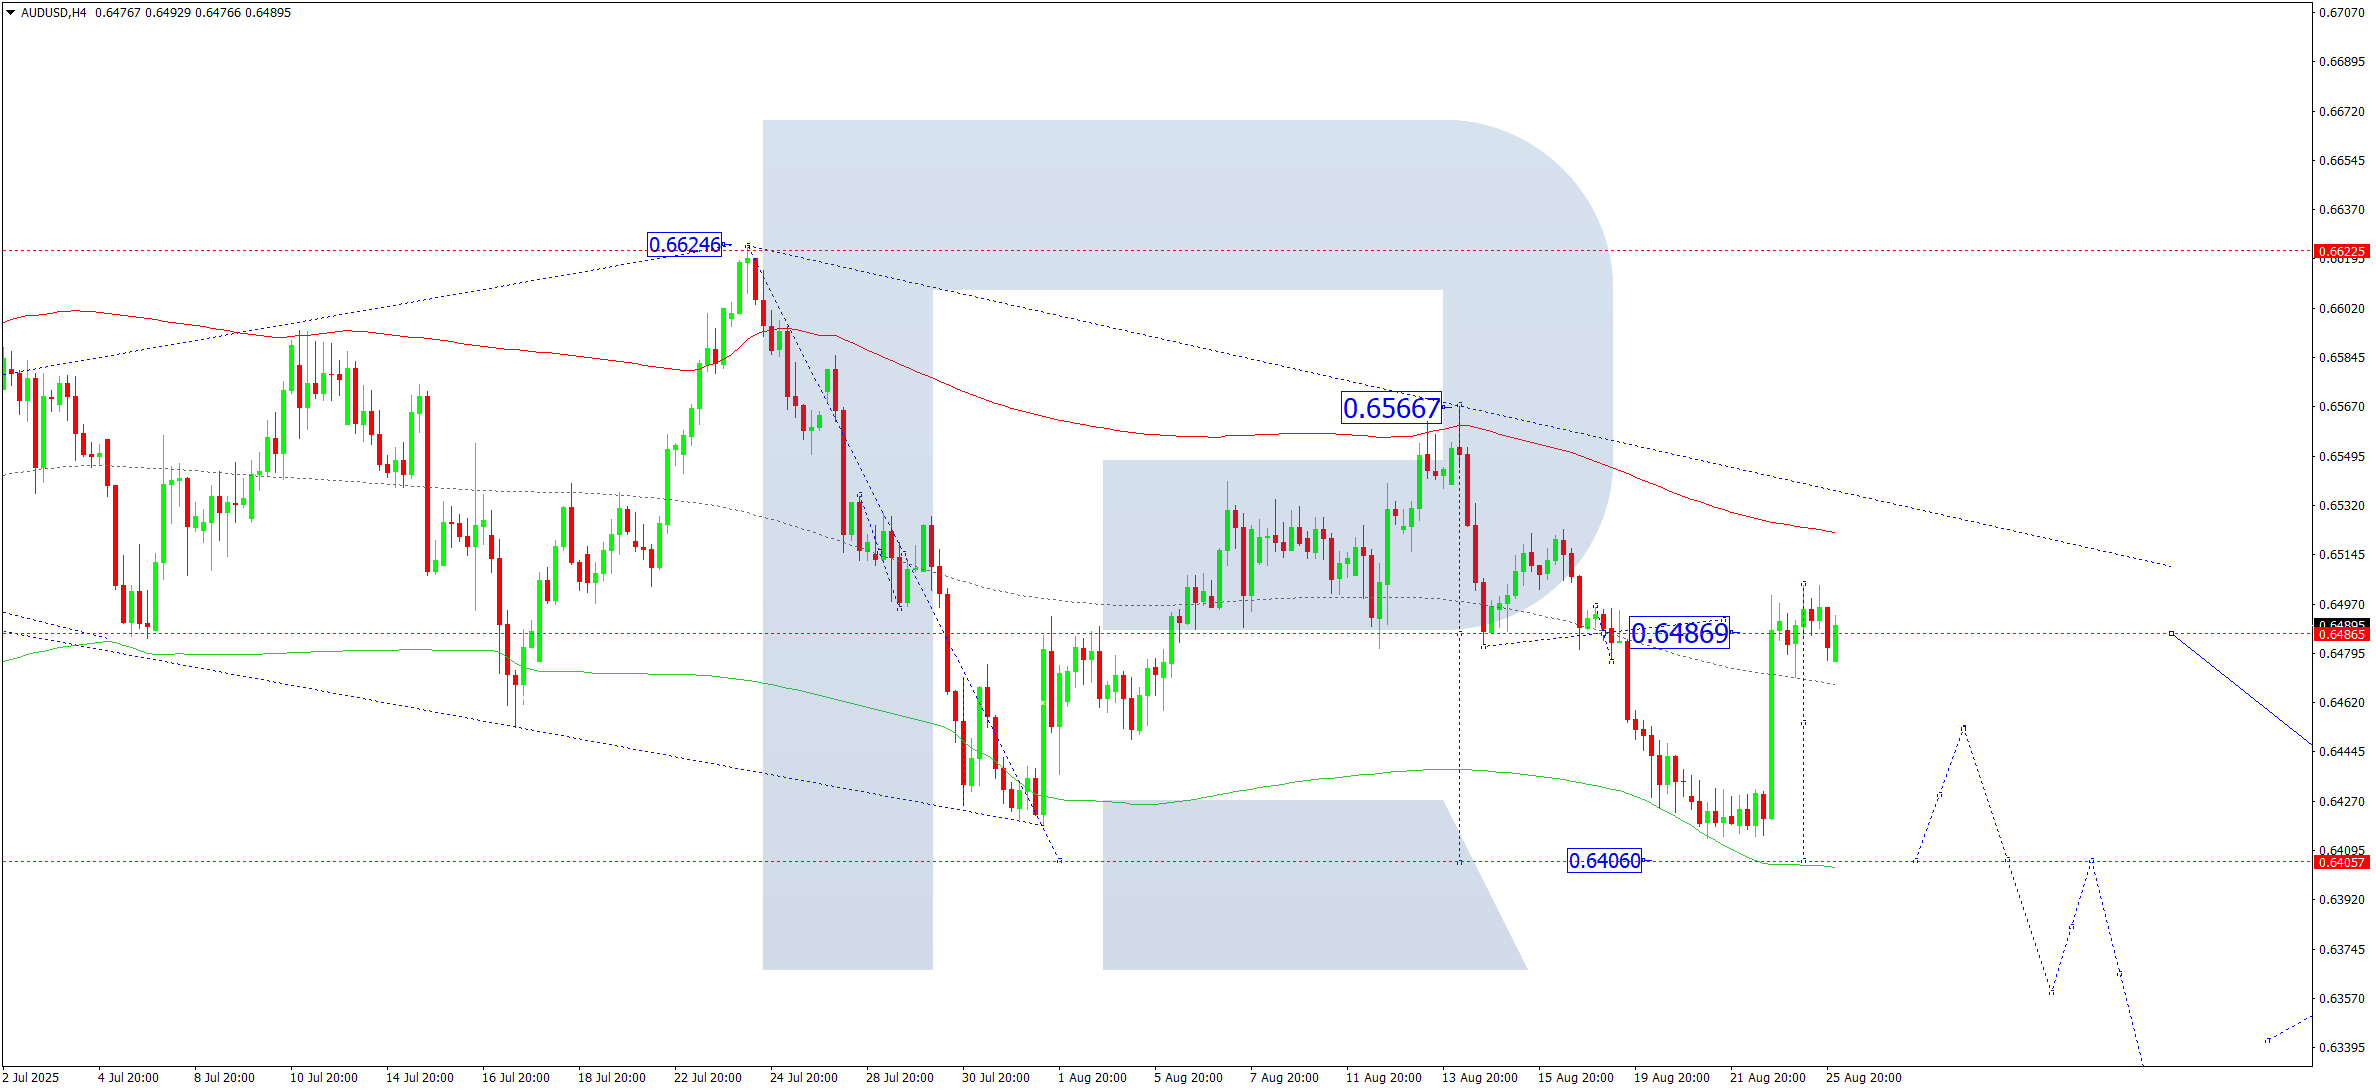
On the H4 chart of AUDUSD, the market is consolidating around 0.6486. Today, 26 August 2025, a downward breakout is expected with the downward wave continuing towards 0.6400. After reaching this level, a correction towards 0.6480 is possible.
Technically, the Elliott wave structure and the downward wave matrix with a pivot at 0.6515 confirm this as the key scenario for AUDUSD. At the moment, the market is forming the fifth downward wave to the lower boundary of the Price Envelope at 0.6400.
Technical indicators for today’s AUDUSD forecast suggest a continued downward move towards 0.6400.
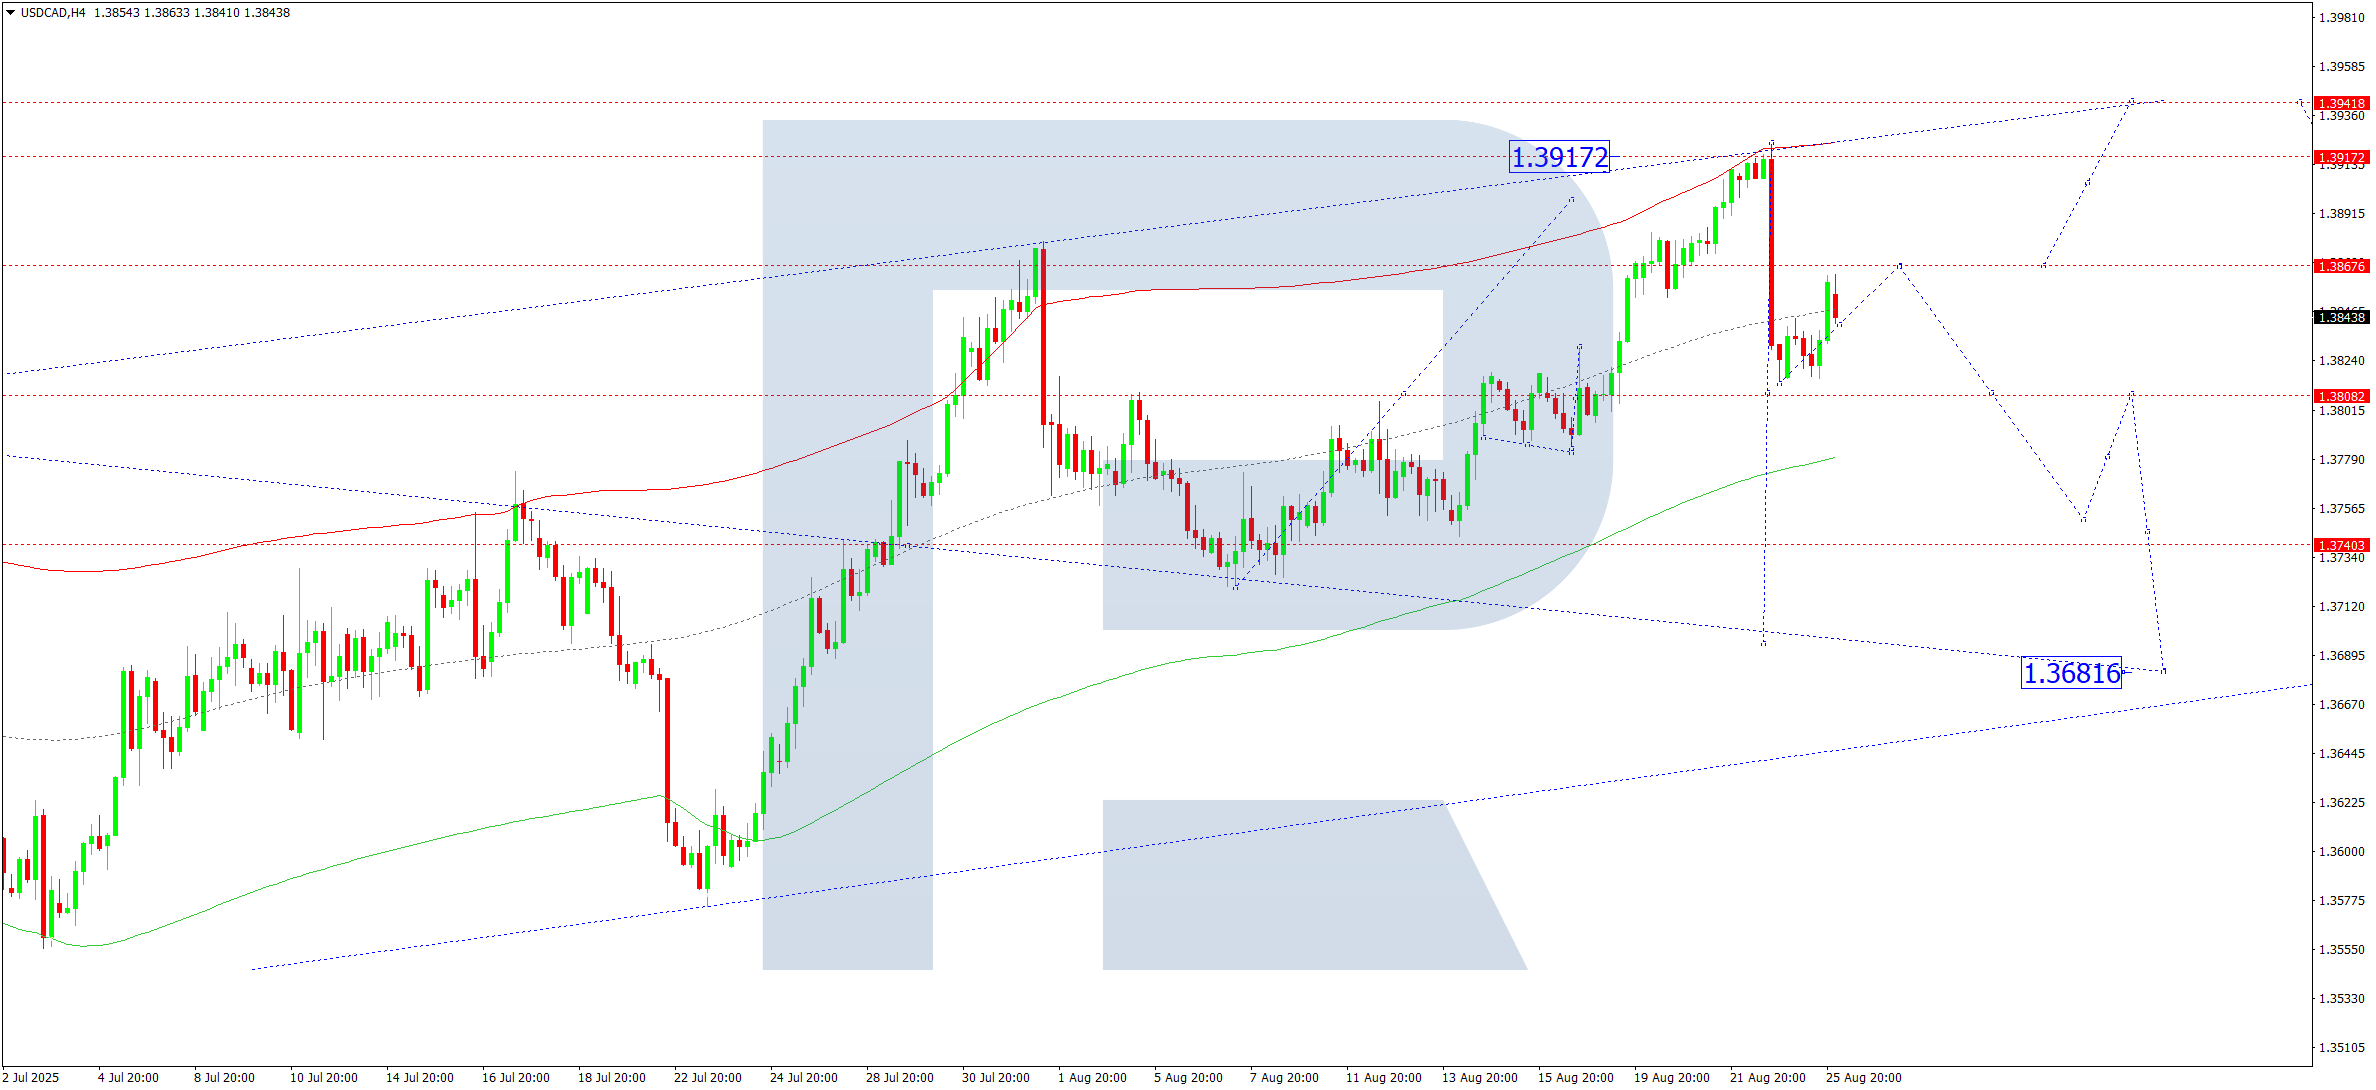
USDCAD forecast
On the H4 chart of USDCAD, the market corrected to 1.3814. Today, 26 August 2025, growth to 1.3868 is possible. This will mark the consolidation range boundaries around this level. If it breaks upwards, growth to 1.3942 may follow. If it breaks downwards, the correction could continue towards 1.3777.
Technically, the Elliott wave structure and the upward wave matrix with a pivot at 1.3740 confirm this as the key scenario for USDCAD. At the moment, the market has completed a growth wave to the upper boundary of the Price Envelope at 1.3917. It remains relevant to consider a decline to the lower boundary at 1.3800, with a possible extension to 1.3688.
Technical indicators for today’s USDCAD forecast suggest growth to 1.3868.
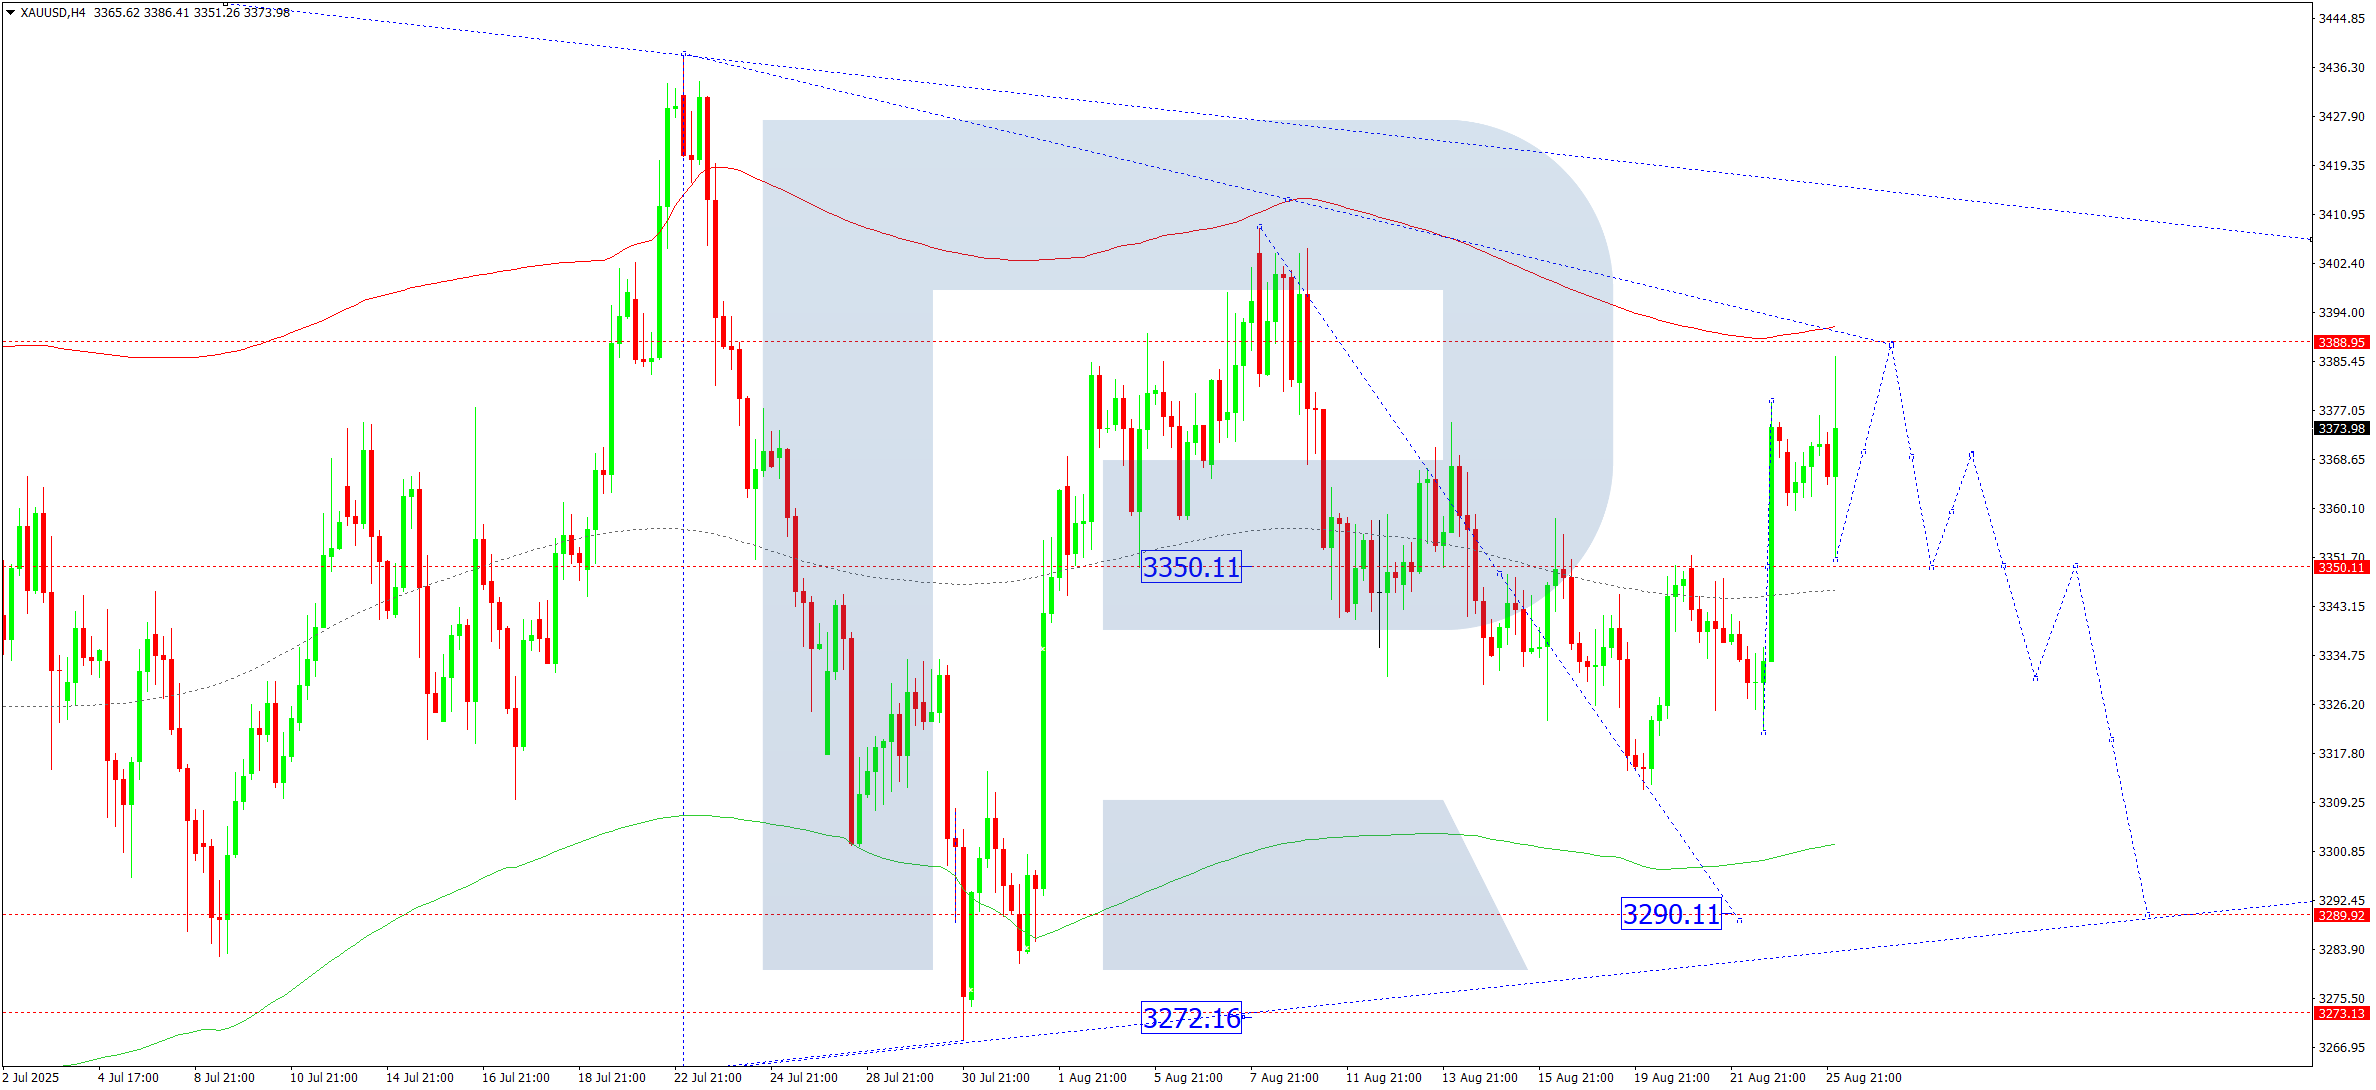
XAUUSD forecast
On the H4 chart of XAUUSD, the market continues to consolidate around 3,350. Recently, a rise to 3,386 was completed. Today, 26 August 2025, further growth to 3,388 is possible. Later, a new downward wave to 3,290 may follow.
Technically, the Elliott wave structure and the downward wave matrix with a pivot at 3,349 confirm this as the key scenario for XAUUSD. At the moment, the market is consolidating around the central line of the Price Envelope at 3,349. Expansion upwards to 3,388 is possible, followed by a decline to its lower boundary at 3,290.
Technical indicators for today’s XAUUSD forecast suggest a continuation of the upward wave to 3,388.
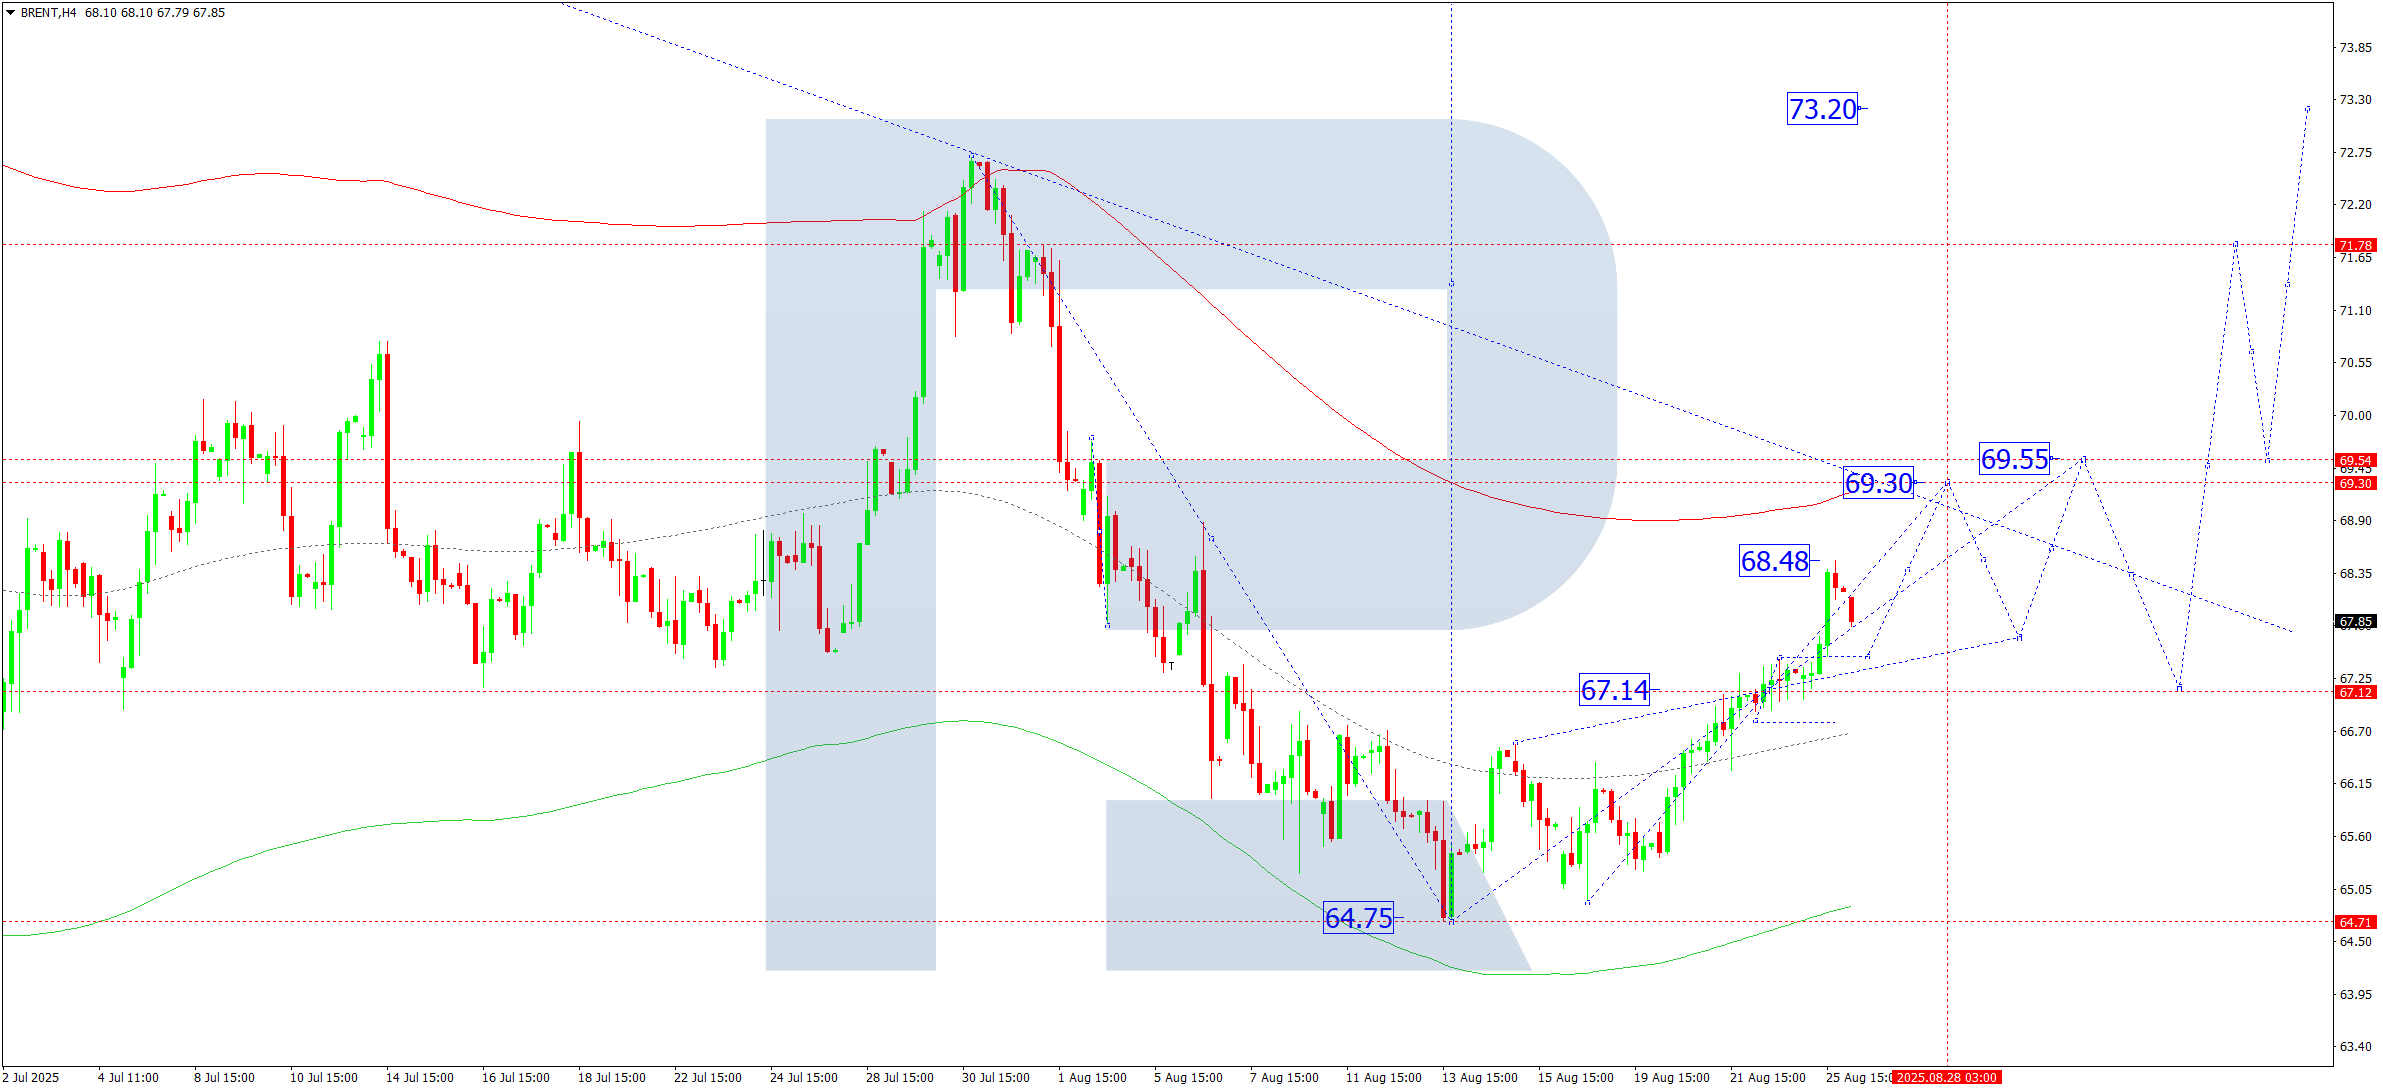
Brent forecast
On the H4 chart of Brent, the market completed a growth wave to 68.48. Today, 26 August 2025, a correction to 67.45 is possible. Later, growth to 69.30 may follow, with the trend potentially continuing to 69.55 as the first target.
Technically, the Elliott wave structure and the upward wave matrix with a pivot at 67.14 confirm this as the key scenario for Brent. At the moment, the market continues a growth wave to the upper boundary of the Price Envelope at 69.55. Later, a correction to its central line at 67.14 may follow.
Technical indicators for today’s Brent forecast suggest growth to 69.30.
Forecasts presented in this section only reflect the author’s private opinion and should not be considered as guidance for trading. RoboForex bears no responsibility for trading results based on trading recommendations described in these analytical reviews.