Daily technical analysis and forecast for 25 August 2025
Here is a detailed daily technical analysis and forecast for EURUSD, USDJPY, GBPUSD, AUDUSD, USDCAD, XAUUSD and Brent for 25 August 2025.
EURUSD forecast
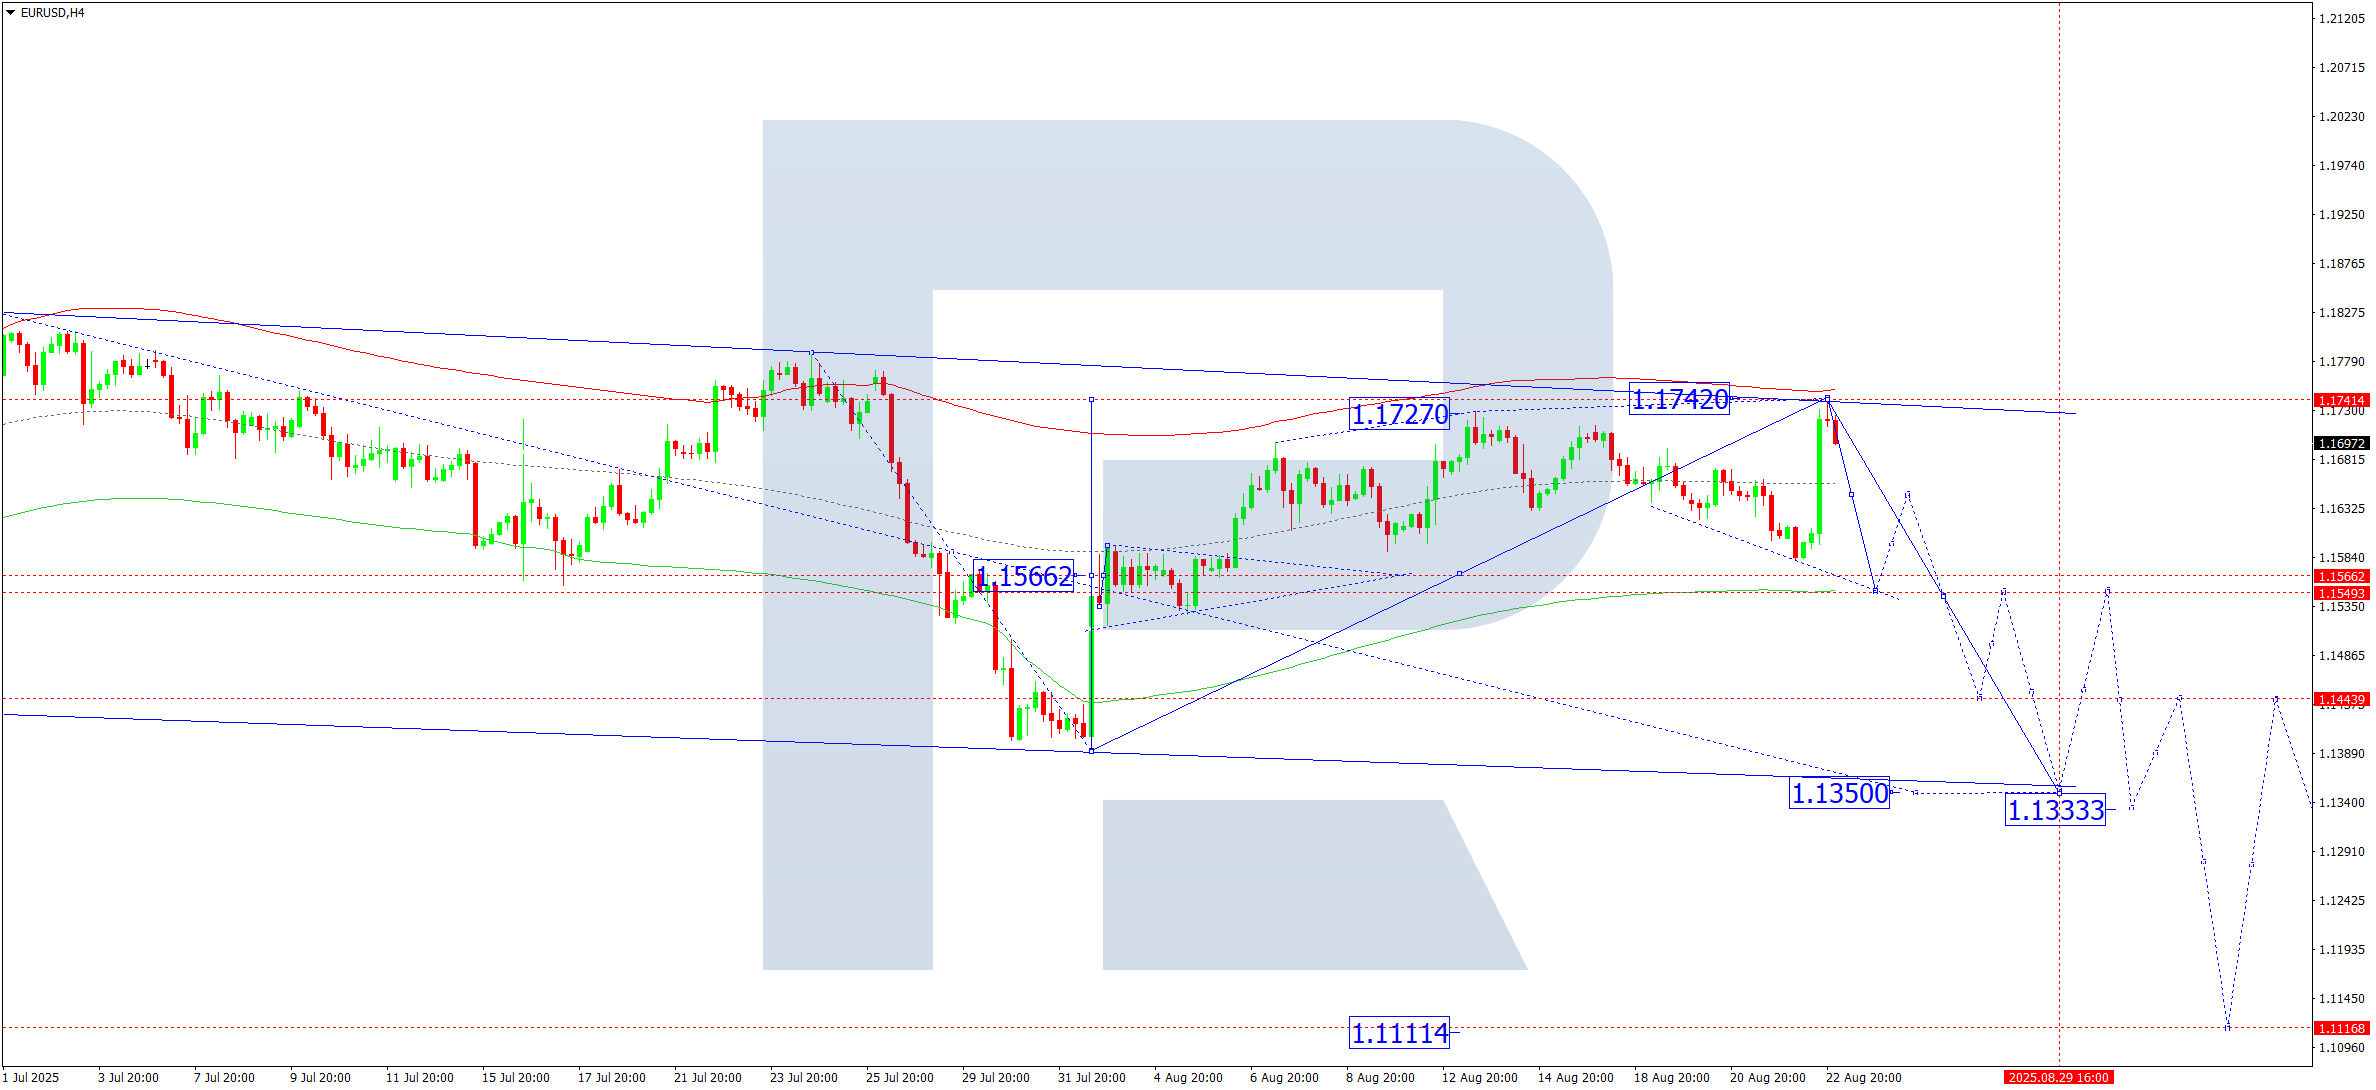
On the H4 chart of EURUSD, the market received support at 1.1583 and completed another corrective growth structure to 1.1742. Today, 25 August 2025, a downward wave is expected to start, aiming for 1.1550. After reaching this level, a rise to 1.1646 is possible. Practically, the market continues to form a wide consolidation range around 1.1646.
Technically, the Elliott wave structure and the downward wave matrix with a pivot at 1.1566 confirm this as the key scenario for EURUSD. At the moment, the market has completed a growth wave to the upper boundary of the Price Envelope at 1.1742. The pair is expected to develop a downward wave to its lower boundary at 1.1550.
Technical indicators for today’s EURUSD forecast suggest a continuation of the downward wave to 1.1550.
USDJPY forecast
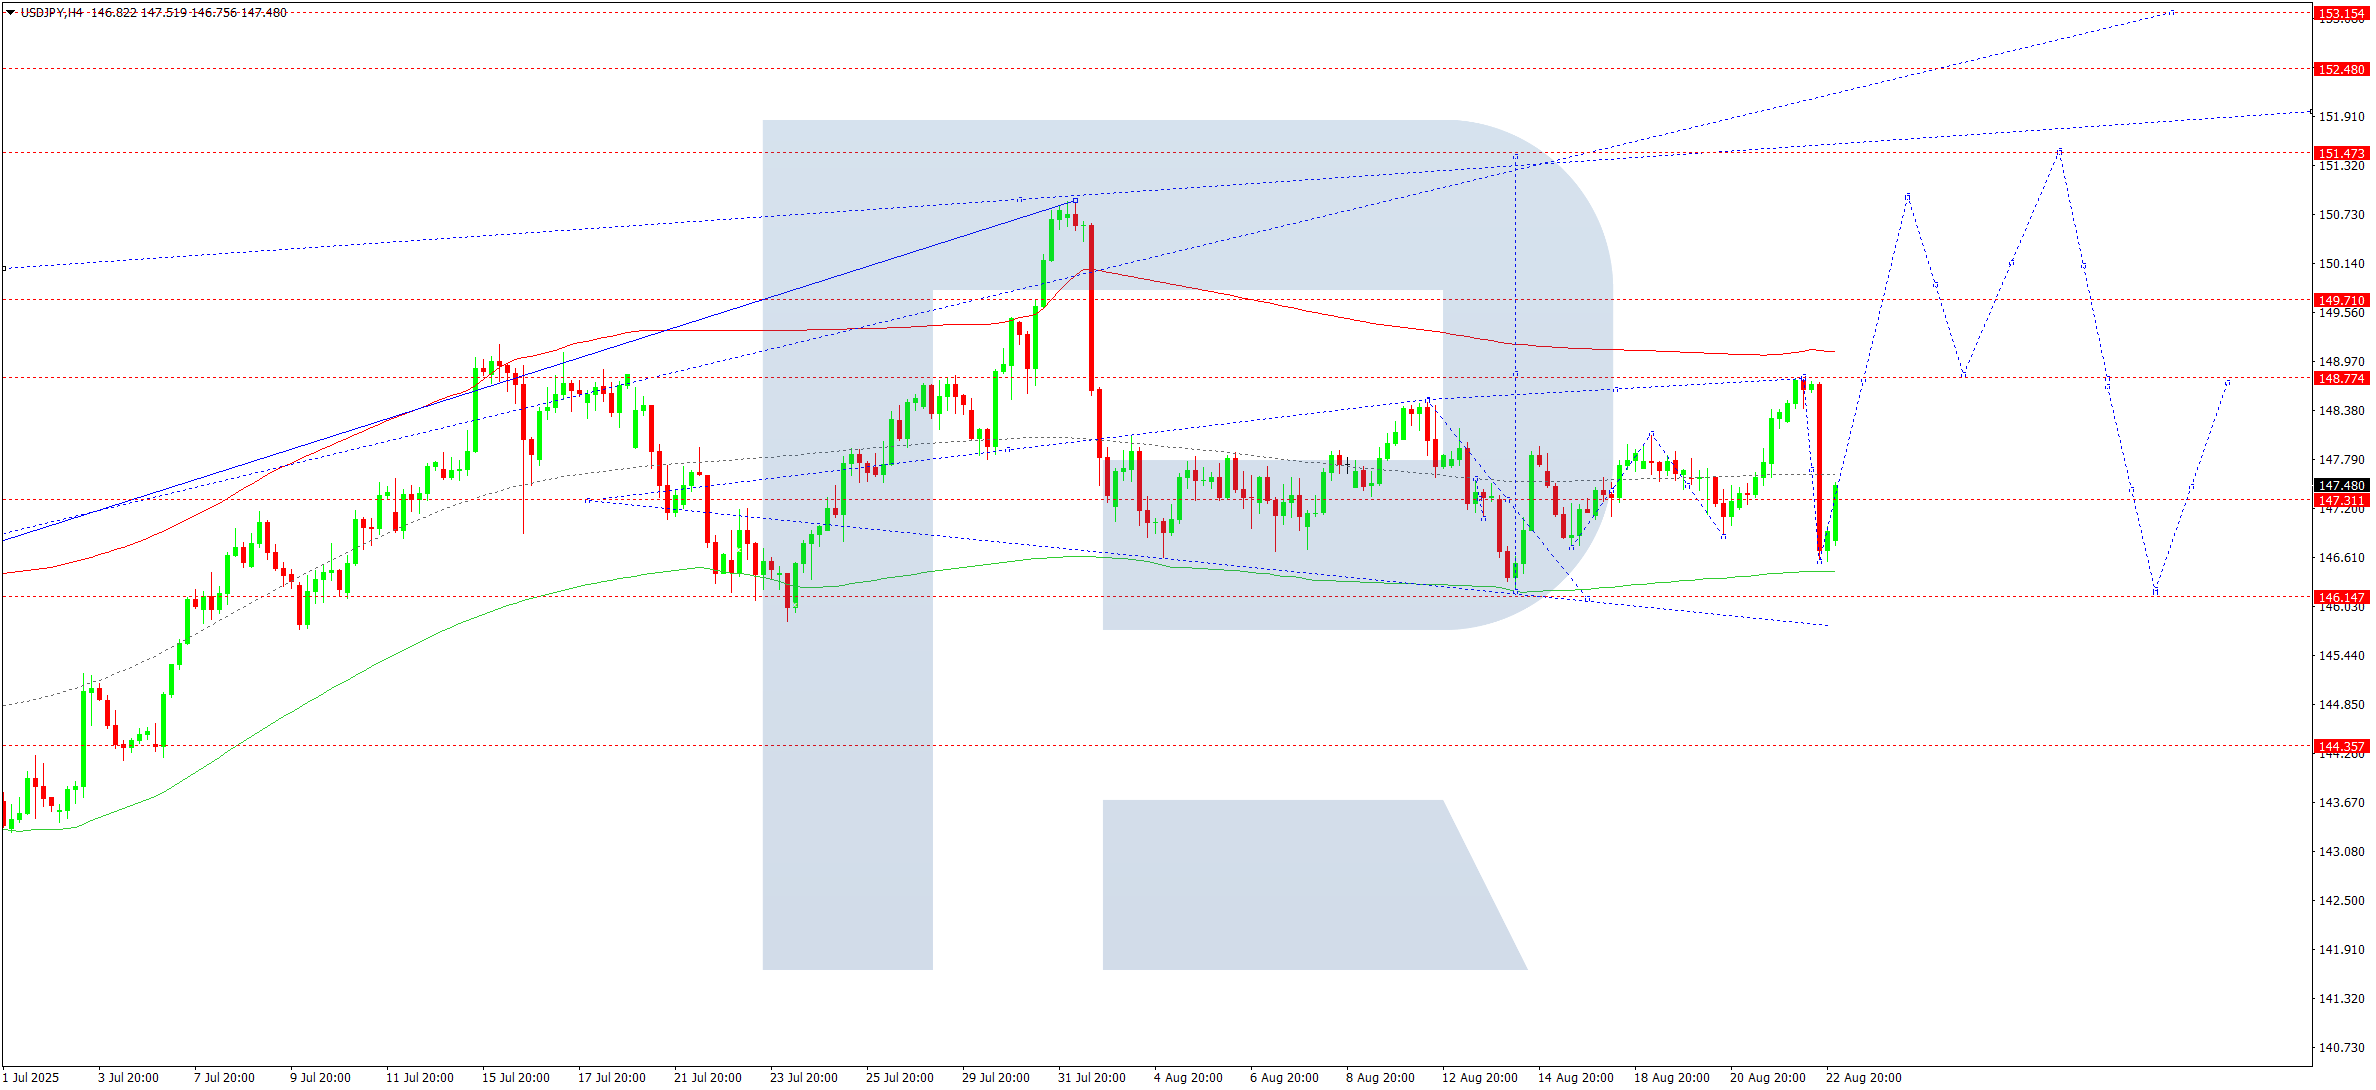
On the H4 chart of USDJPY, the market continues developing a consolidation range around 147.32. The range has been extended upwards to 148.77 and down to 146.55. A decline to 146.15 is possible. Today, 25 August 2025, if the market breaks out upwards, growth to 150.75 may follow. If it breaks downwards, a decline to 144.44 is possible.
Technically, the Elliott wave structure and the upward wave matrix with a pivot at 146.55 confirm this as the key scenario for USDJPY. At the moment, the market continues developing a growth wave towards the upper boundary of the Price Envelope at 151.47. For now, it consolidates around the central line at 147.33. Expansion downwards to 146.15 is also possible.
Technical indicators for today’s USDJPY forecast suggest growth towards 150.75.
GBPUSD forecast
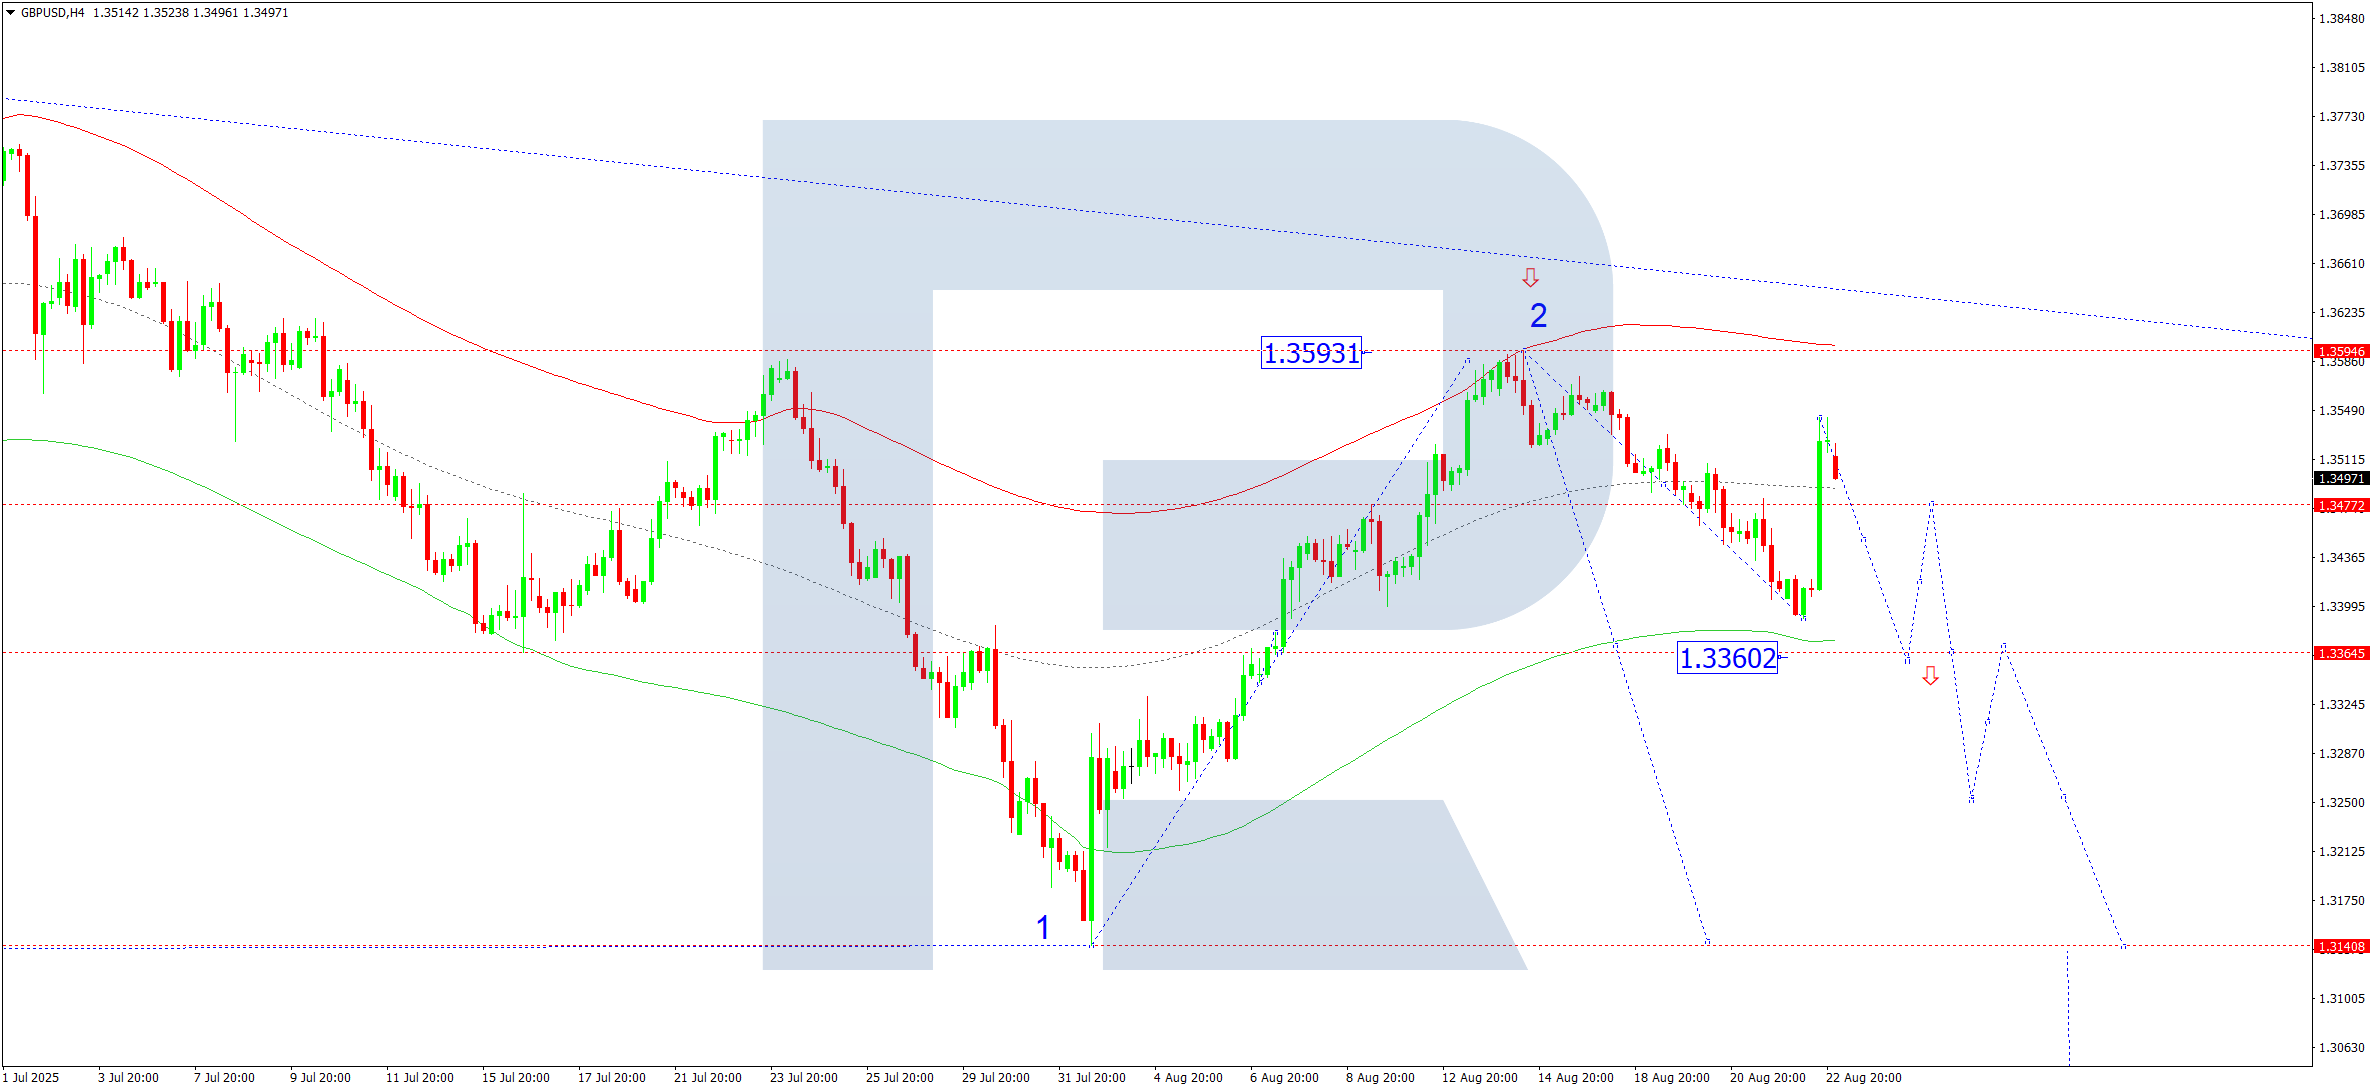
On the H4 chart of GBPUSD, the market corrected towards 1.3540. Today, 25 August 2025, a downward wave is expected to start, aiming for 1.3360. After reaching this level, a correction to 1.3500 is possible. The market is practically forming a wide consolidation range around this level. A further decline to 1.3140 remains relevant as the first target in the next wave.
Technically, the Elliott wave structure and the downward wave matrix with a pivot at 1.3475 confirm this as the key scenario for GBPUSD. At the moment, the market is developing a downward wave to the lower boundary of the Price Envelope at 1.3360. Later, a correction to its central line at 1.3475 is possible.
Technical indicators for today’s GBPUSD forecast suggest a continuation of the downward wave to 1.3360.
AUDUSD forecast
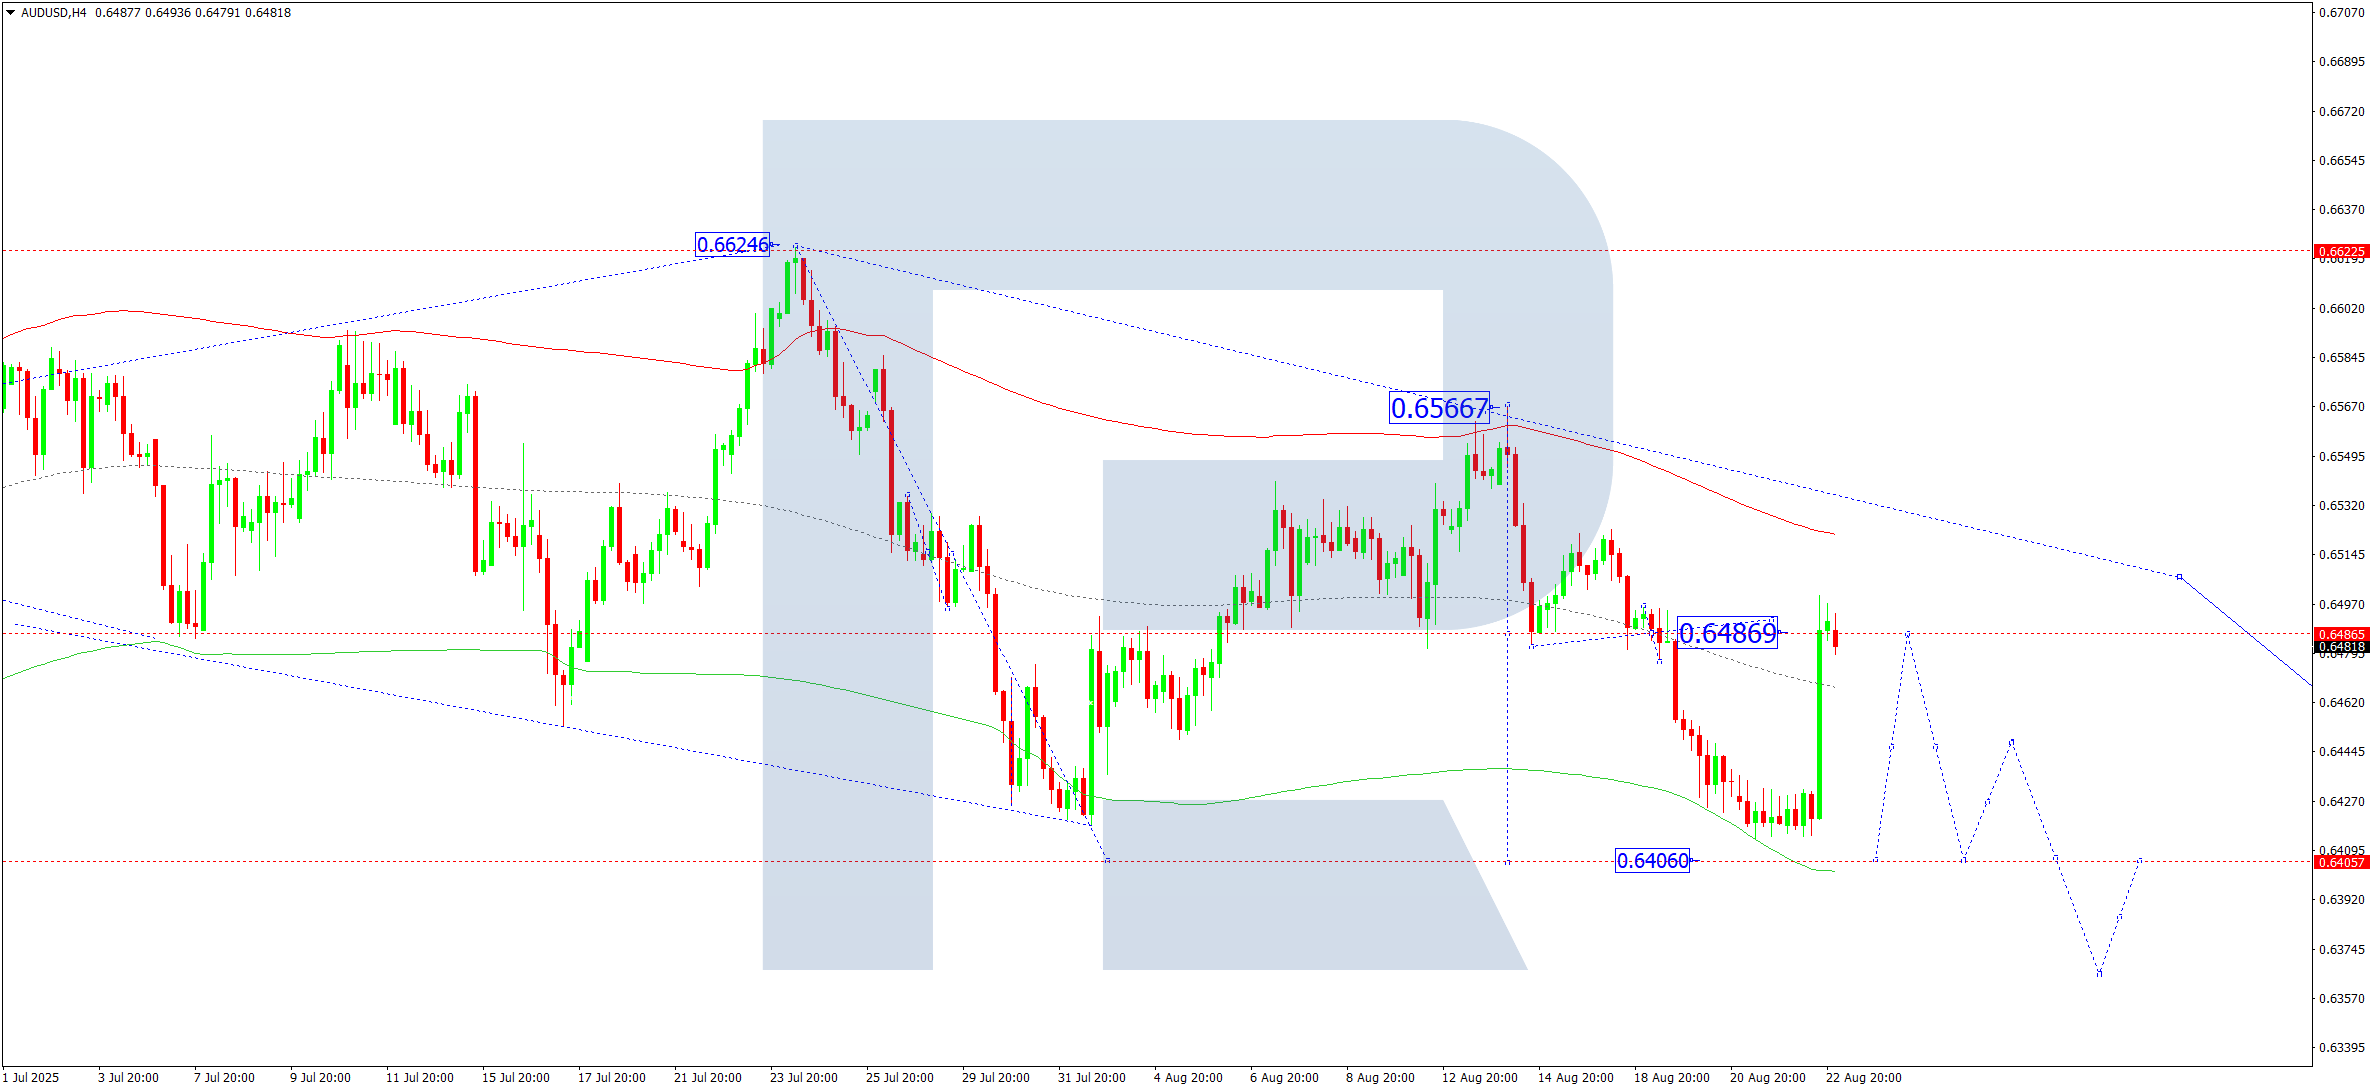
On the H4 chart of AUDUSD, the market corrected towards 0.6499. Today, 25 August 2025, the downward wave is expected to continue to 0.6400. After reaching this level, a correction to 0.6490 is possible.
Technically, the Elliott wave structure and the downward wave matrix with a pivot at 0.6515 confirm this as the key scenario for AUDUSD. At the moment, the market is forming the fifth downward wave towards the lower boundary of the Price Envelope at 0.6400.
Technical indicators for today’s AUDUSD forecast suggest a continued downward movement to 0.6400.
USDCAD forecast
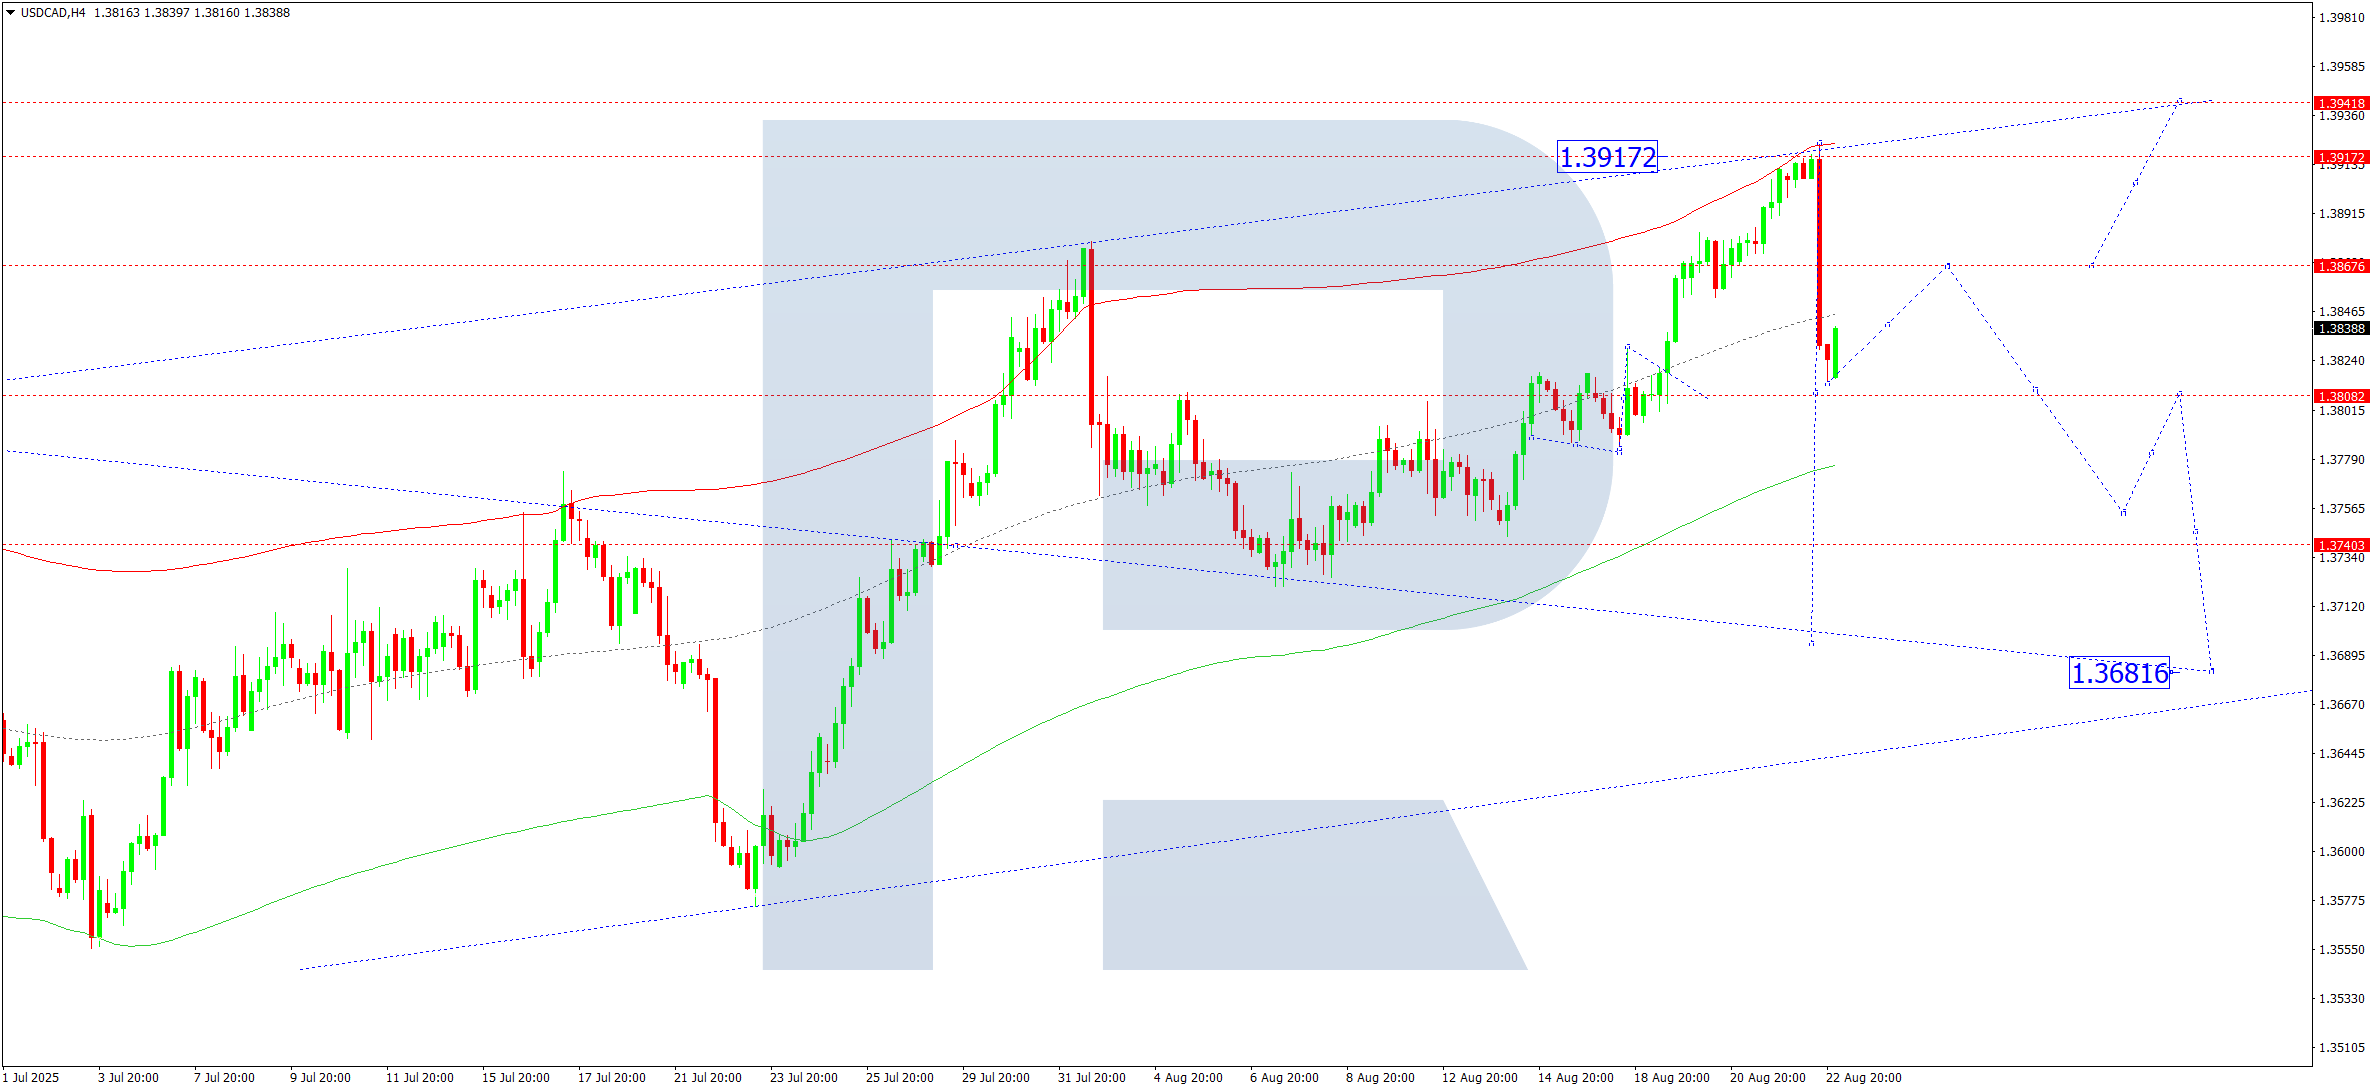
On the H4 chart of USDCAD, the market corrected to 1.3814. Today, 25 August 2025, growth to 1.3868 is possible, setting the consolidation range boundaries around this level. If it breaks upwards, growth to 1.3942 may follow. If it breaks downwards, a continuation of the correction to 1.3777 is possible.
Technically, the Elliott wave structure and the upward wave matrix with a pivot at 1.3727 confirm this as the key scenario for USDCAD. At the moment, the market has completed a growth wave to the upper boundary of the Price Envelope at 1.3917. It remains relevant to consider a decline to the lower boundary at 1.3800, with potential extension to 1.3688.
Technical indicators for today’s USDCAD forecast suggest growth to 1.3868.
XAUUSD forecast
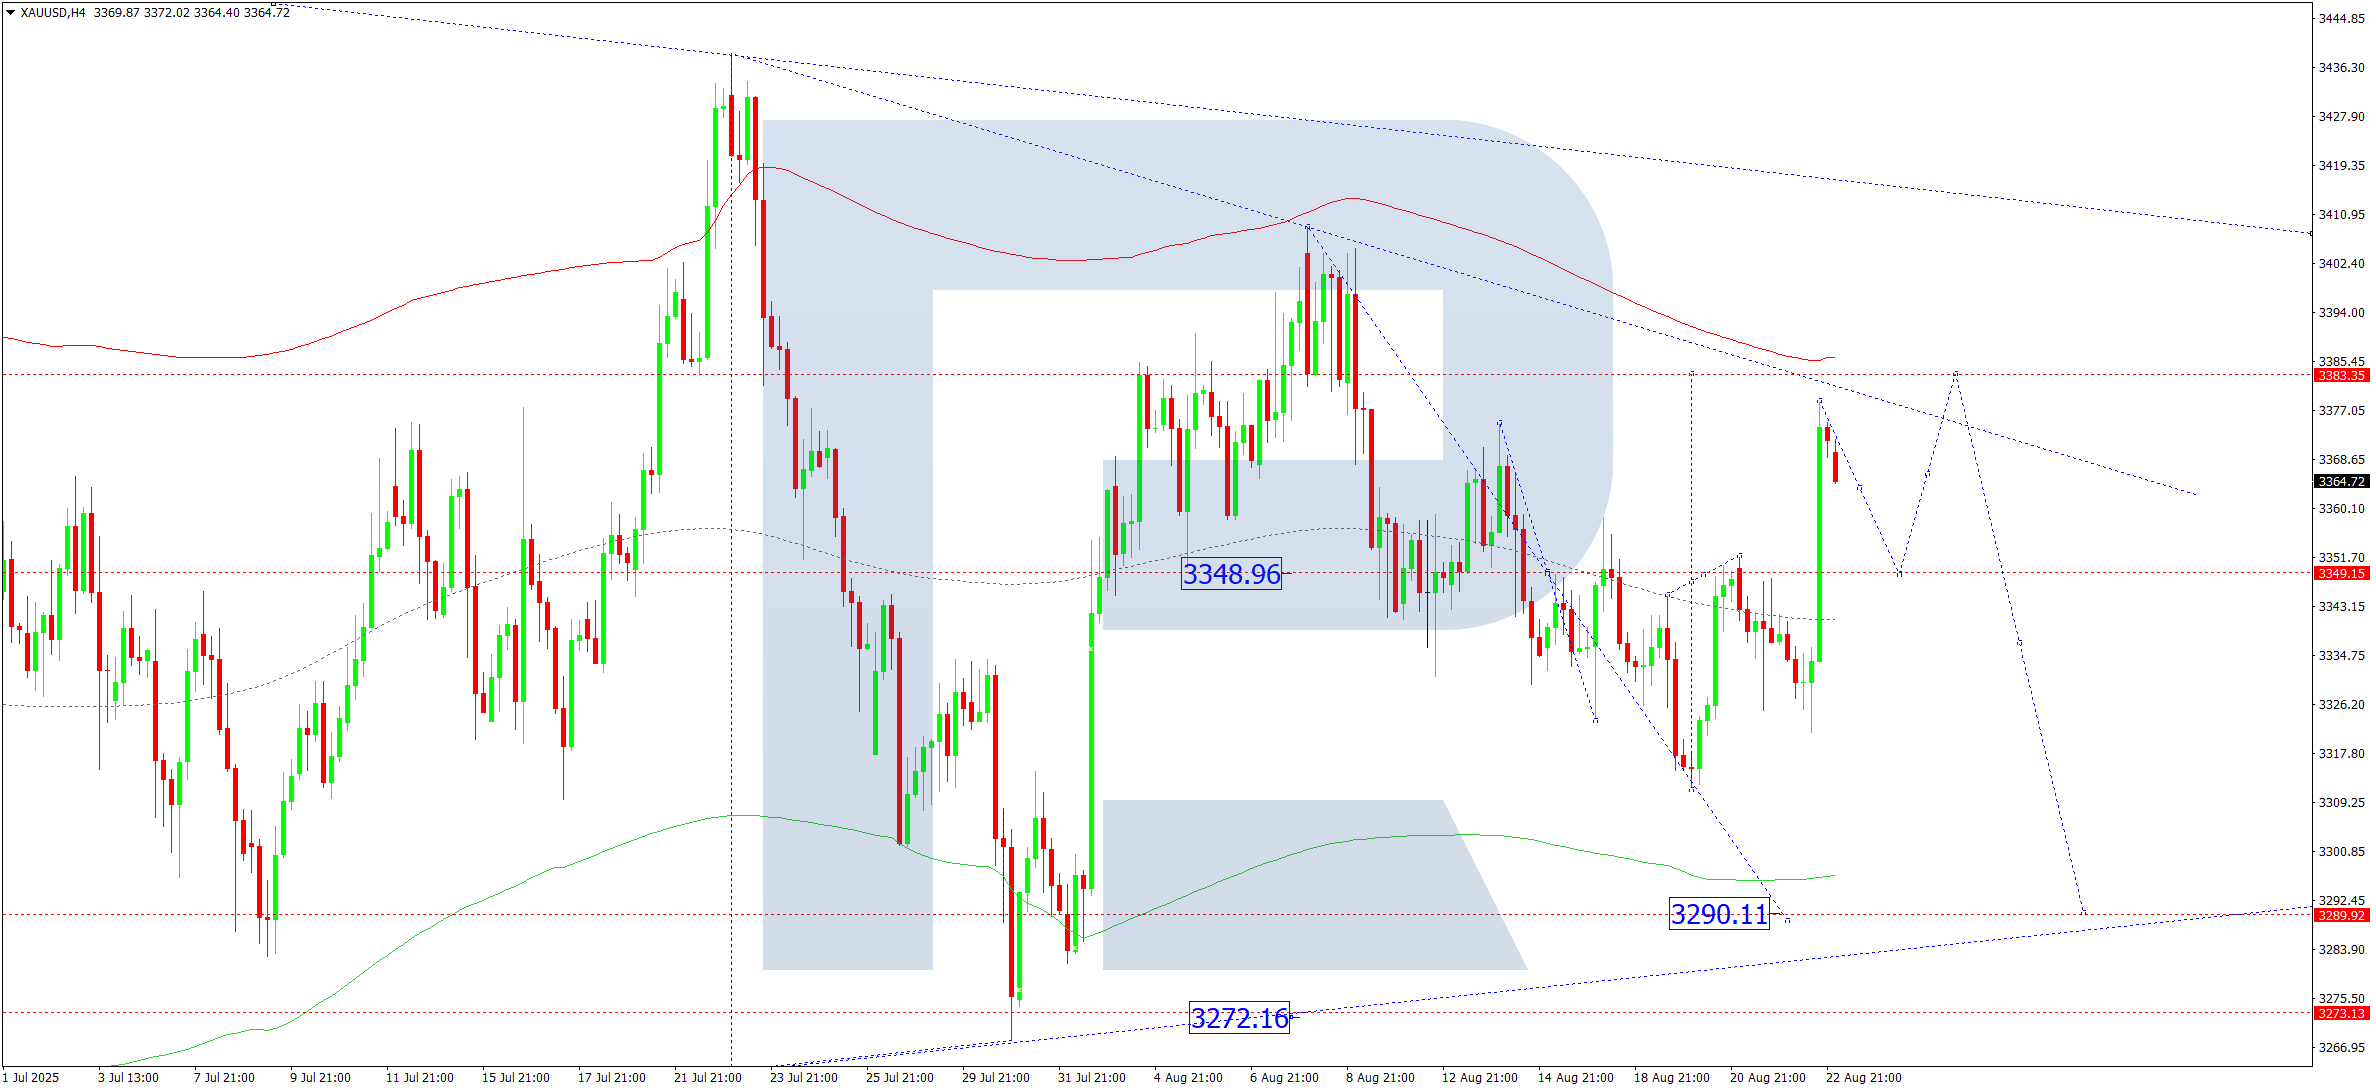
On the H4 chart of XAUUSD, the market continues to consolidate around 3,349. Recently, a growth move to 3,377 was completed. Today, 25 August 2025, prices are expected to decline to 3,349. Later, the range may expand upwards to 3,388. This growth is viewed as a correction to the previous downward wave. After that, a new downward wave to 3,290 may start.
Technically, the Elliott wave structure and the downward wave matrix with a pivot at 3,349 confirm this as the key scenario for XAUUSD. At the moment, the market is consolidating around the central line of the Price Envelope at 3,349. Expansion upwards to 3,388 is possible, followed by a decline to the lower boundary at 3,290.
Technical indicators for today’s XAUUSD forecast suggest growth to 3,388.
Brent forecast
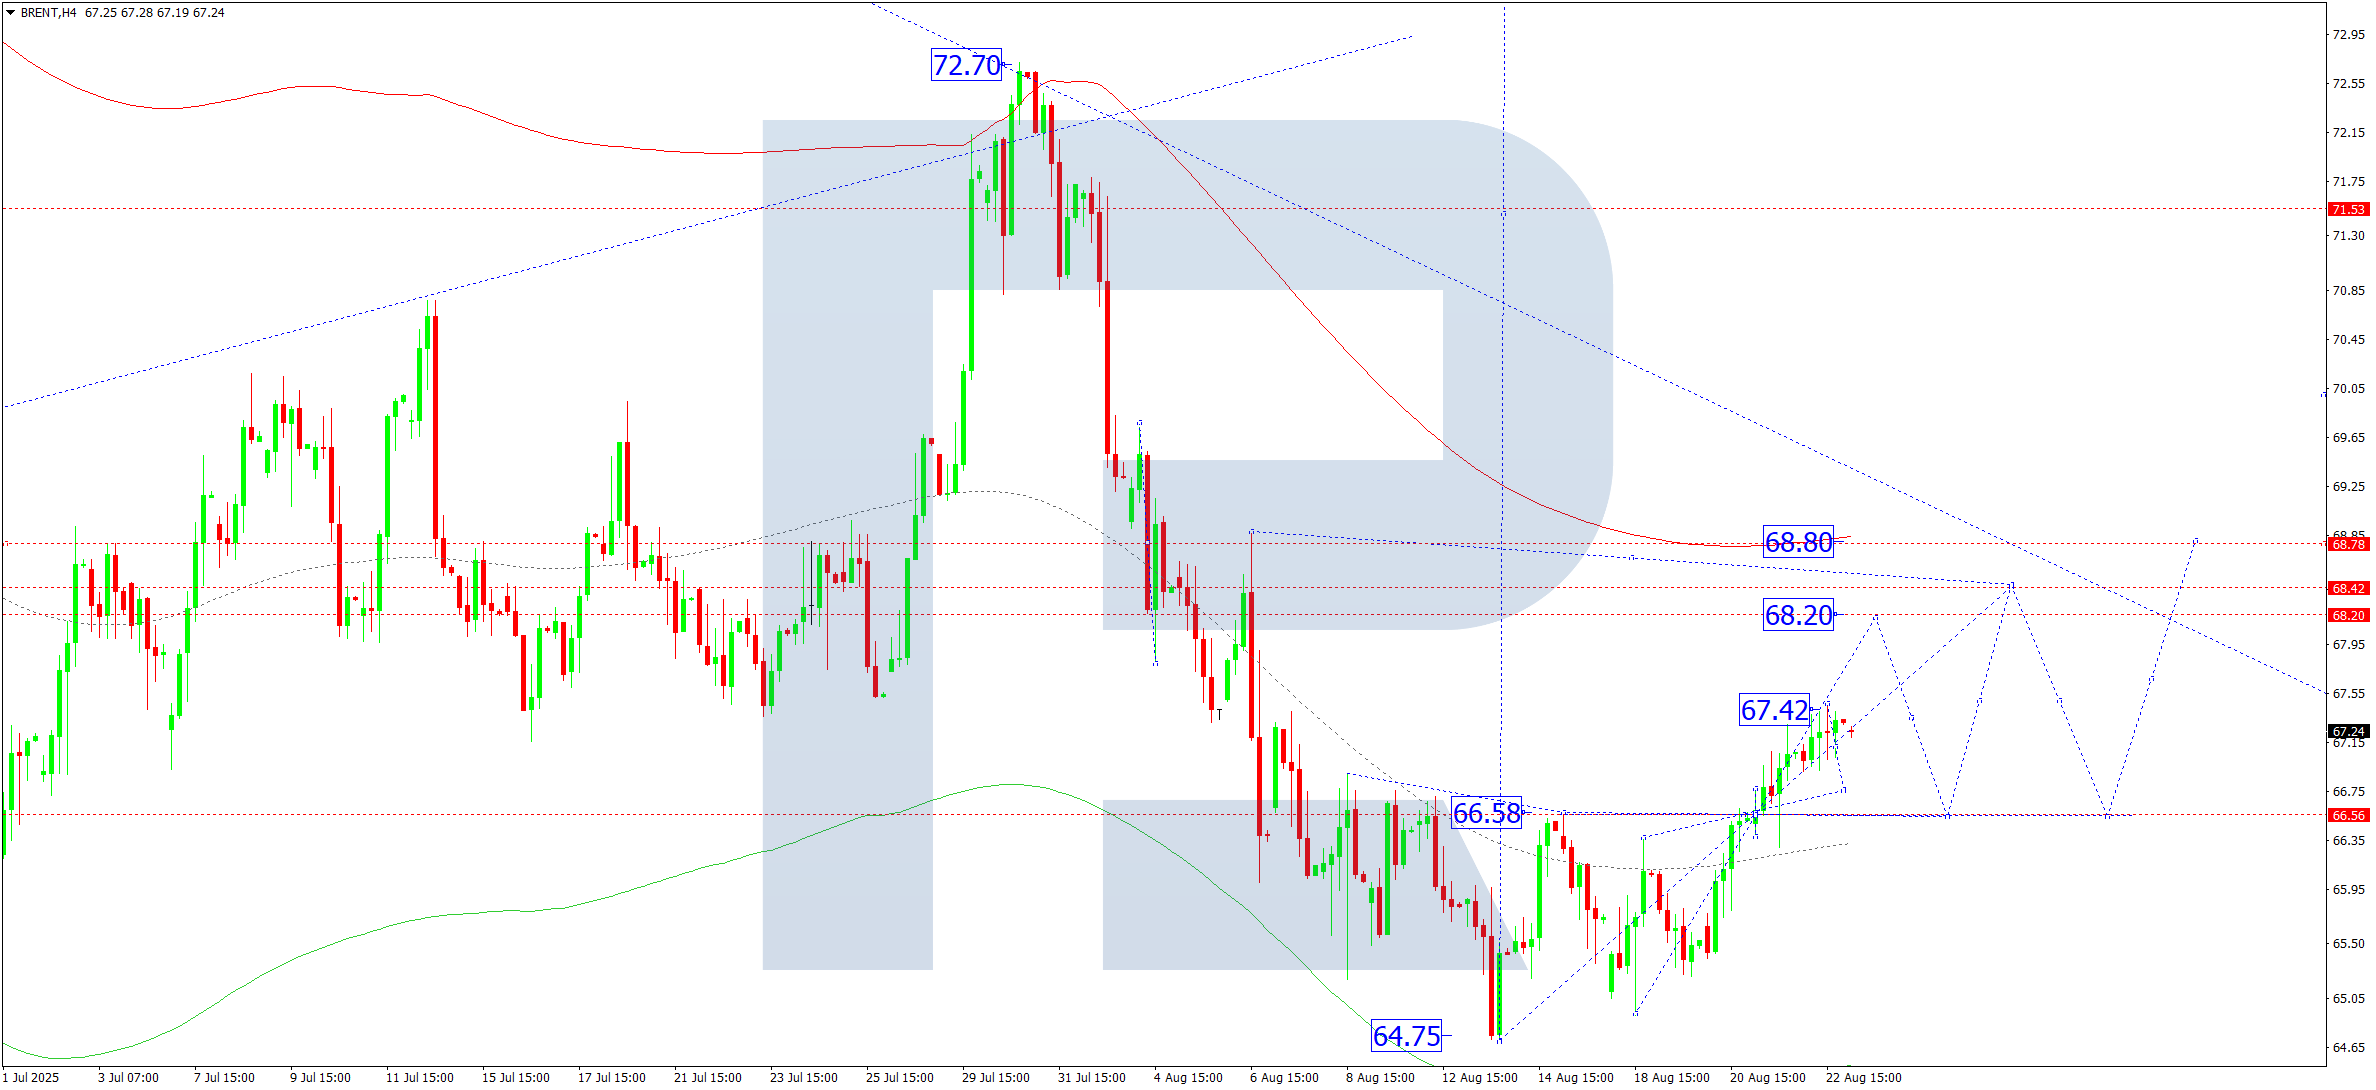
On the H4 chart of Brent, the market completed a growth wave to 67.42. Today, 25 August 2025, a correction to 66.60 is possible. Afterwards, the market may grow to 68.20, with the prospect of continuing the trend to 68.40 as the first target.
Technically, the Elliott wave structure and the upward wave matrix with a pivot at 66.60 confirm this as the key scenario for Brent. At the moment, the market is moving towards the upper boundary of the Price Envelope at 68.40. Later, a correction to its central line at 66.60 may follow.
Technical indicators for today’s Brent forecast suggest a potential upward move towards 68.40.
Forecasts presented in this section only reflect the author’s private opinion and should not be considered as guidance for trading. RoboForex bears no responsibility for trading results based on trading recommendations described in these analytical reviews.