Daily technical analysis and forecast for 19 August 2025
Here is a detailed daily technical analysis and forecast for EURUSD, USDJPY, GBPUSD, AUDUSD, USDCAD, XAUUSD and Brent for 19 August 2025.
EURUSD forecast
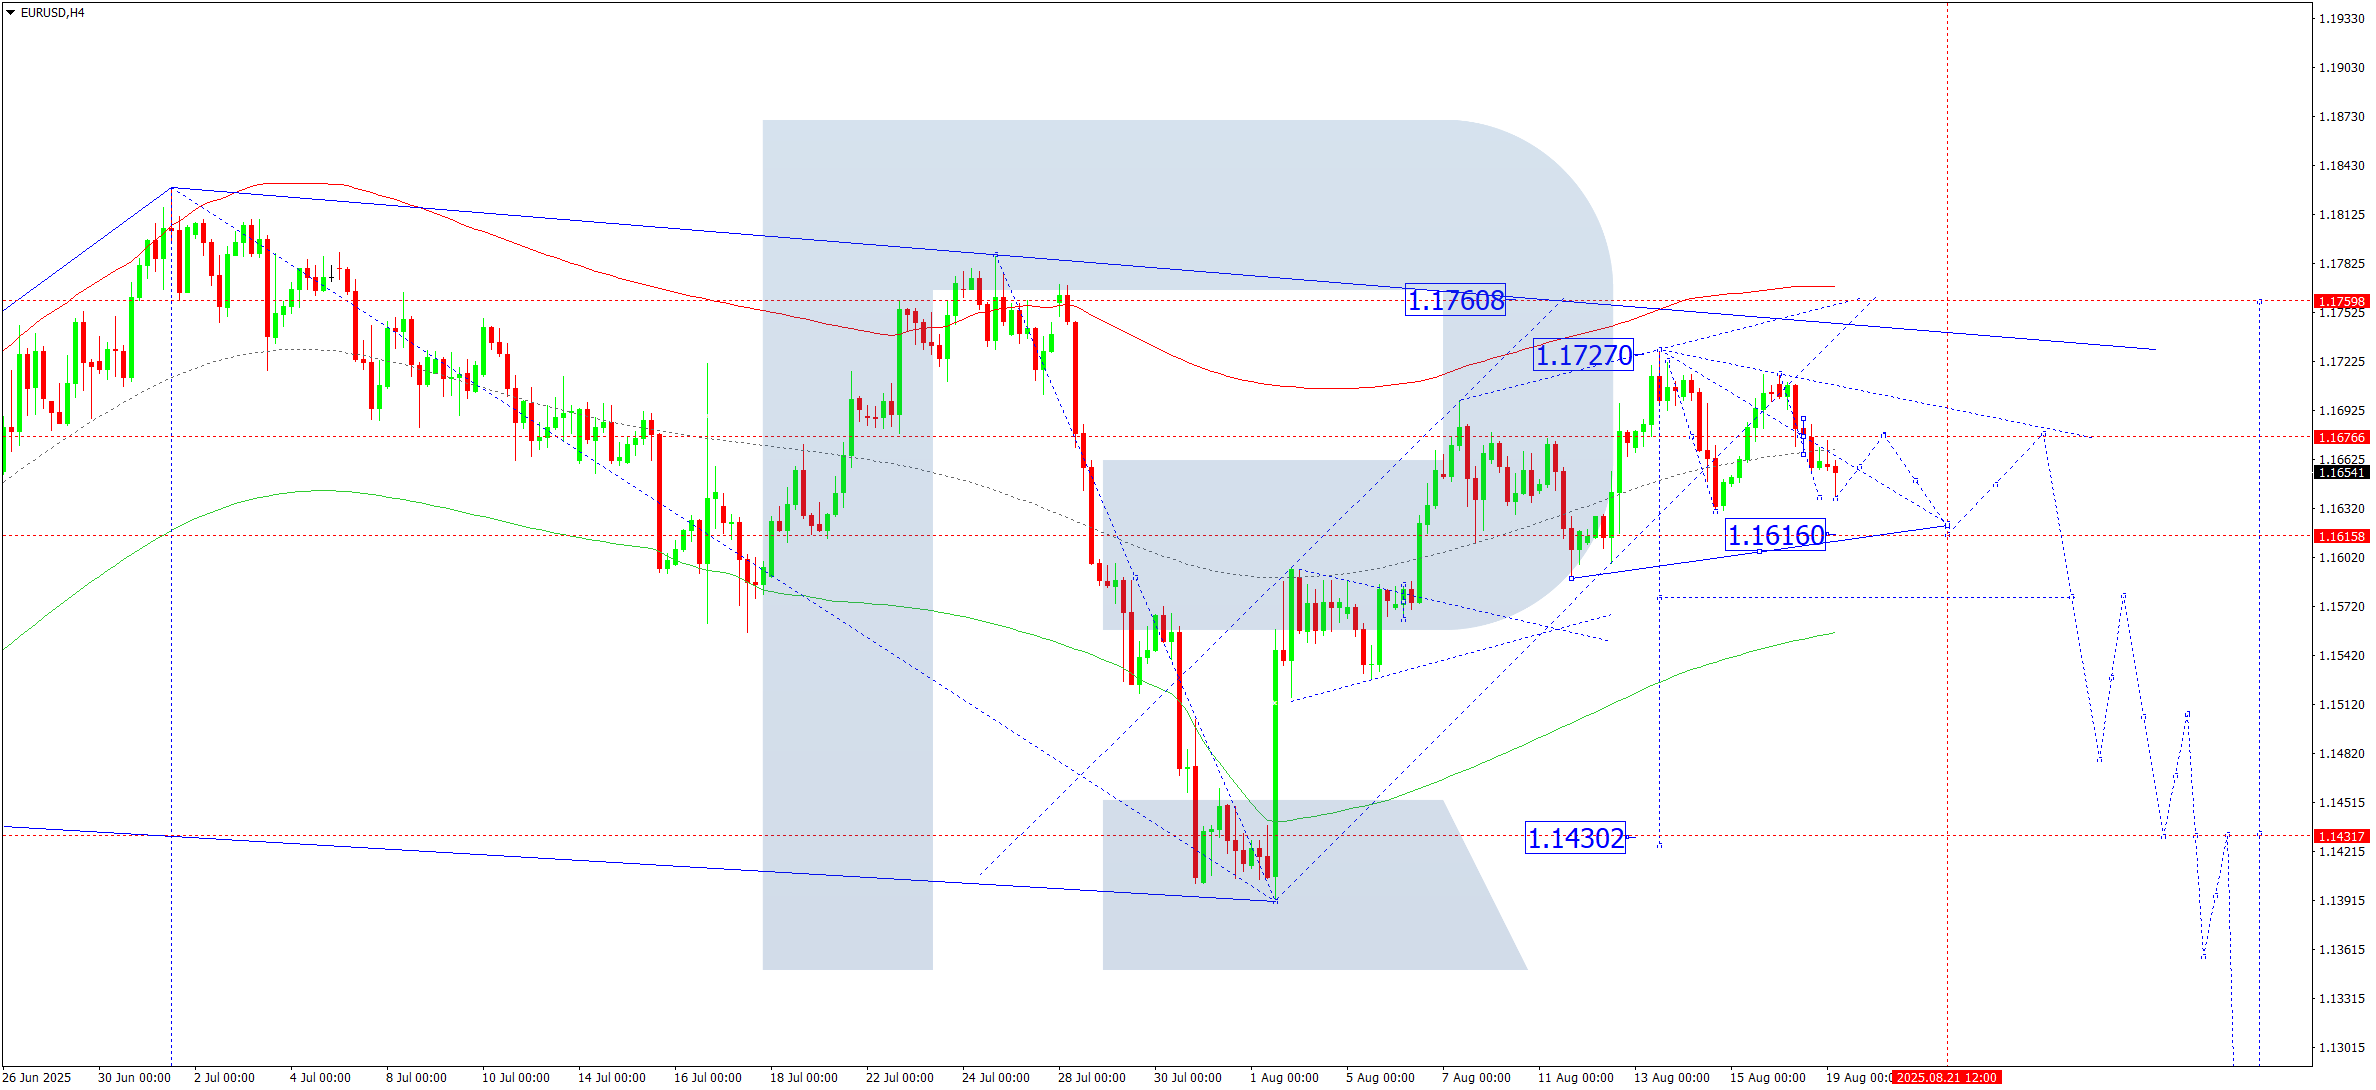
On the H4 chart of EURUSD, the market continues developing a consolidation range around 1.1676. The range has extended upwards to 1.1715 and downwards to 1.1638. Today, 19 August 2025, the pair could rise towards 1.1676 (testing from below). The main scenario suggests a decline to 1.1616, followed by growth to 1.1676. If the range breaks upwards, the wave may stretch to 1.1760. A downward breakout will open the potential for a continued move towards 1.1577, with a prospect of extending the trend to 1.1477 as a local target.
Technically, the Elliott wave structure and the downward wave matrix with a pivot at 1.1590 confirm this scenario as key in the EURUSD wave structure. Currently, the market is correcting towards the upper boundary of the Price Envelope at 1.1760. After reaching this target, a new downward wave is expected to start, aiming for the lower boundary at 1.1577.
Technical indicators for today’s EURUSD forecast suggest a downward wave to 1.1616.
USDJPY forecast
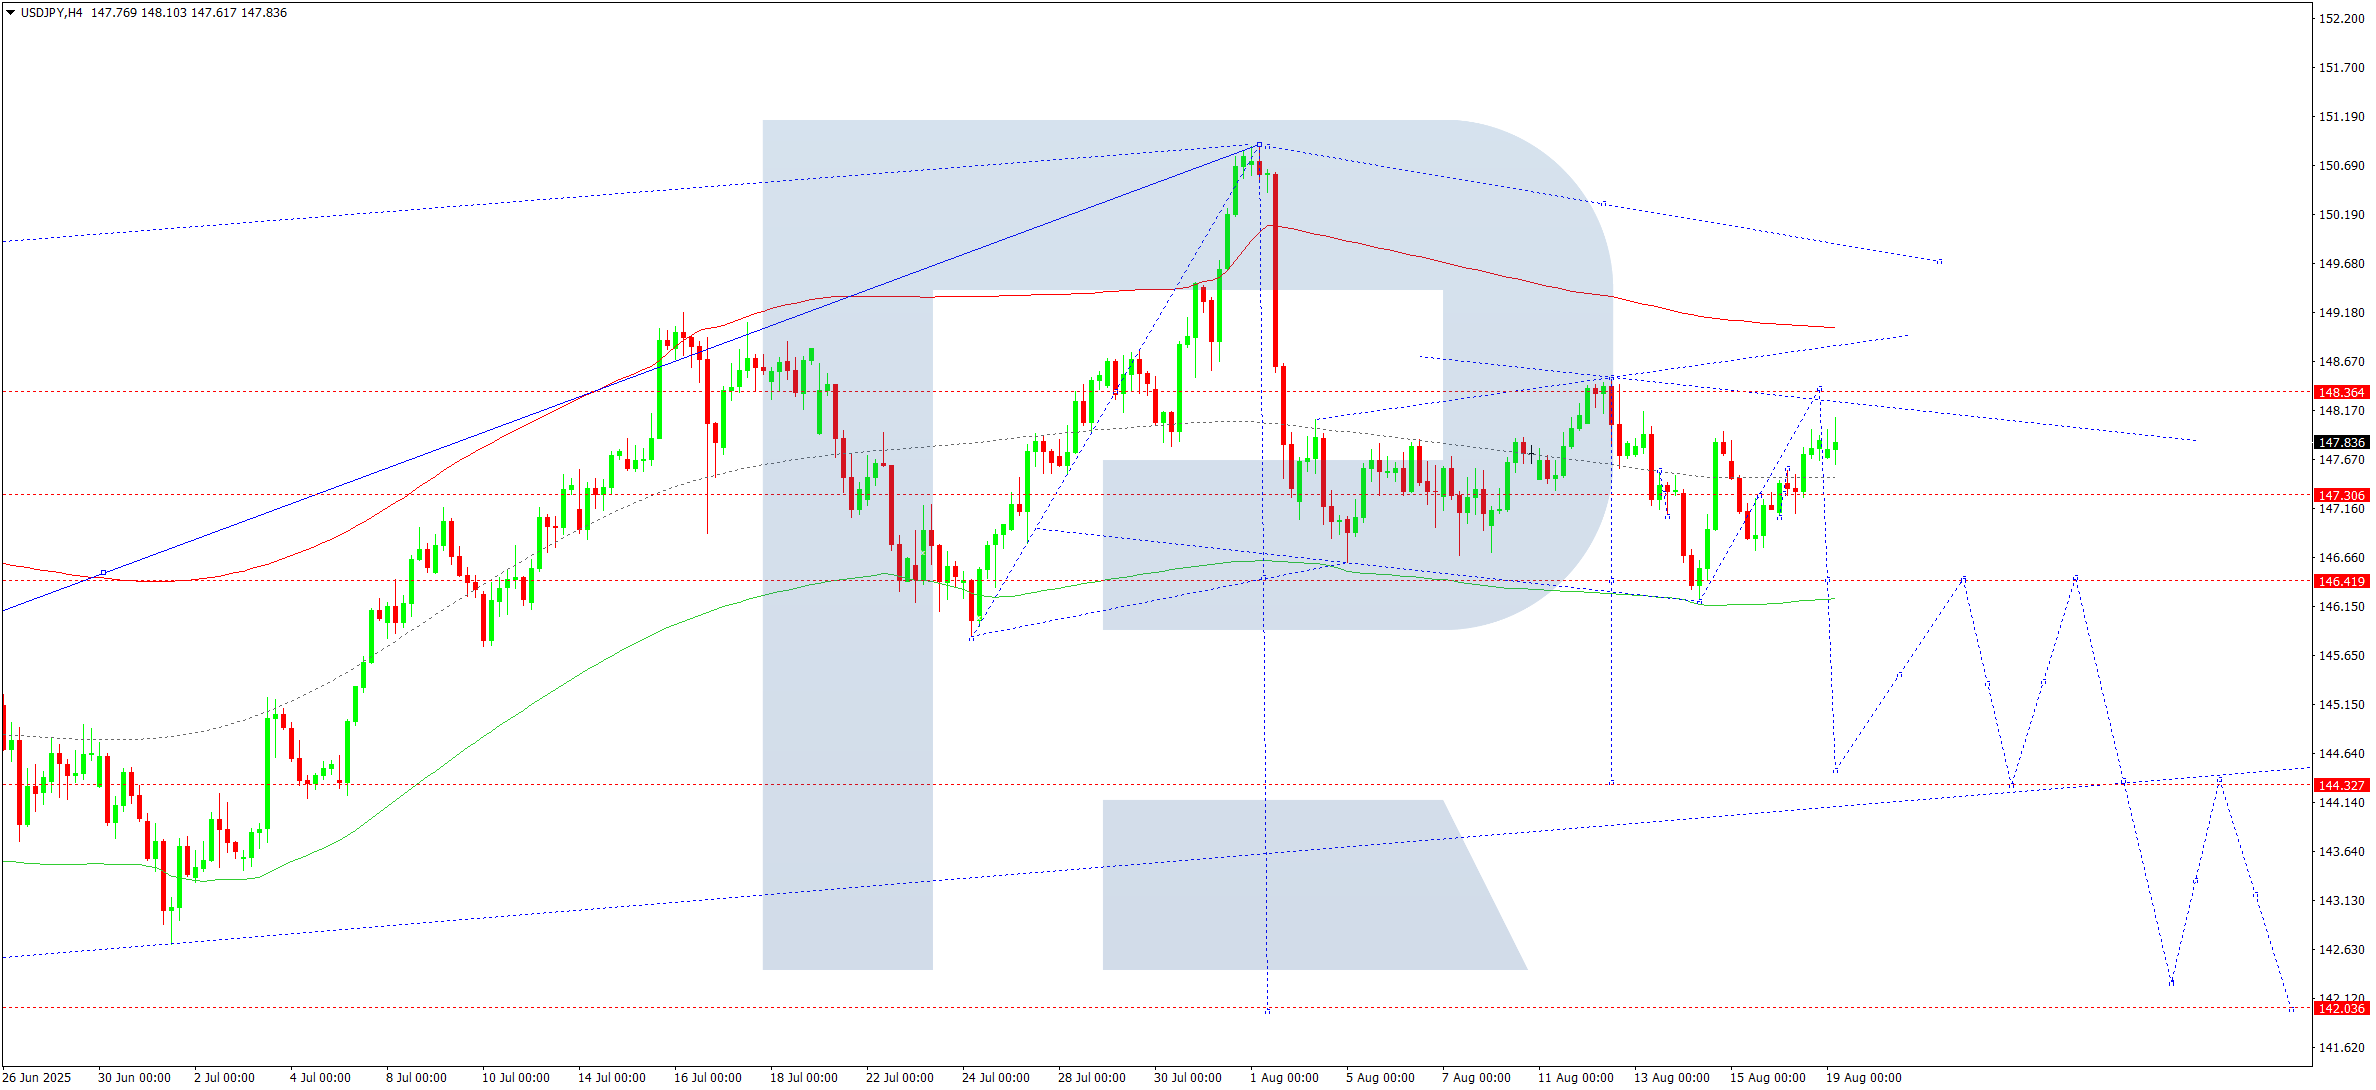
On the H4 chart of USDJPY, the market continues developing a narrow consolidation range around 147.30. Today, 19 August 2025, the pair is expected to climb to the upper boundary of the range at 148.30. A breakout above this level will open the potential for a wave towards 149.11. A downward breakout will bring a move towards 144.55 as a local target.
Technically, the Elliott wave structure and the downward wave matrix with a pivot at 147.30 confirm this scenario as key in the USDJPY structure. At the moment, the market has formed a consolidation around the central line of the Price Envelope at 147.30. A downward breakout and movement towards the lower boundary at 146.00 are expected. Later, a breakout below this level may extend the wave towards 144.55.
Technical indicators for today’s USDJPY forecast suggest a continued decline to 146.00.
GBPUSD forecast
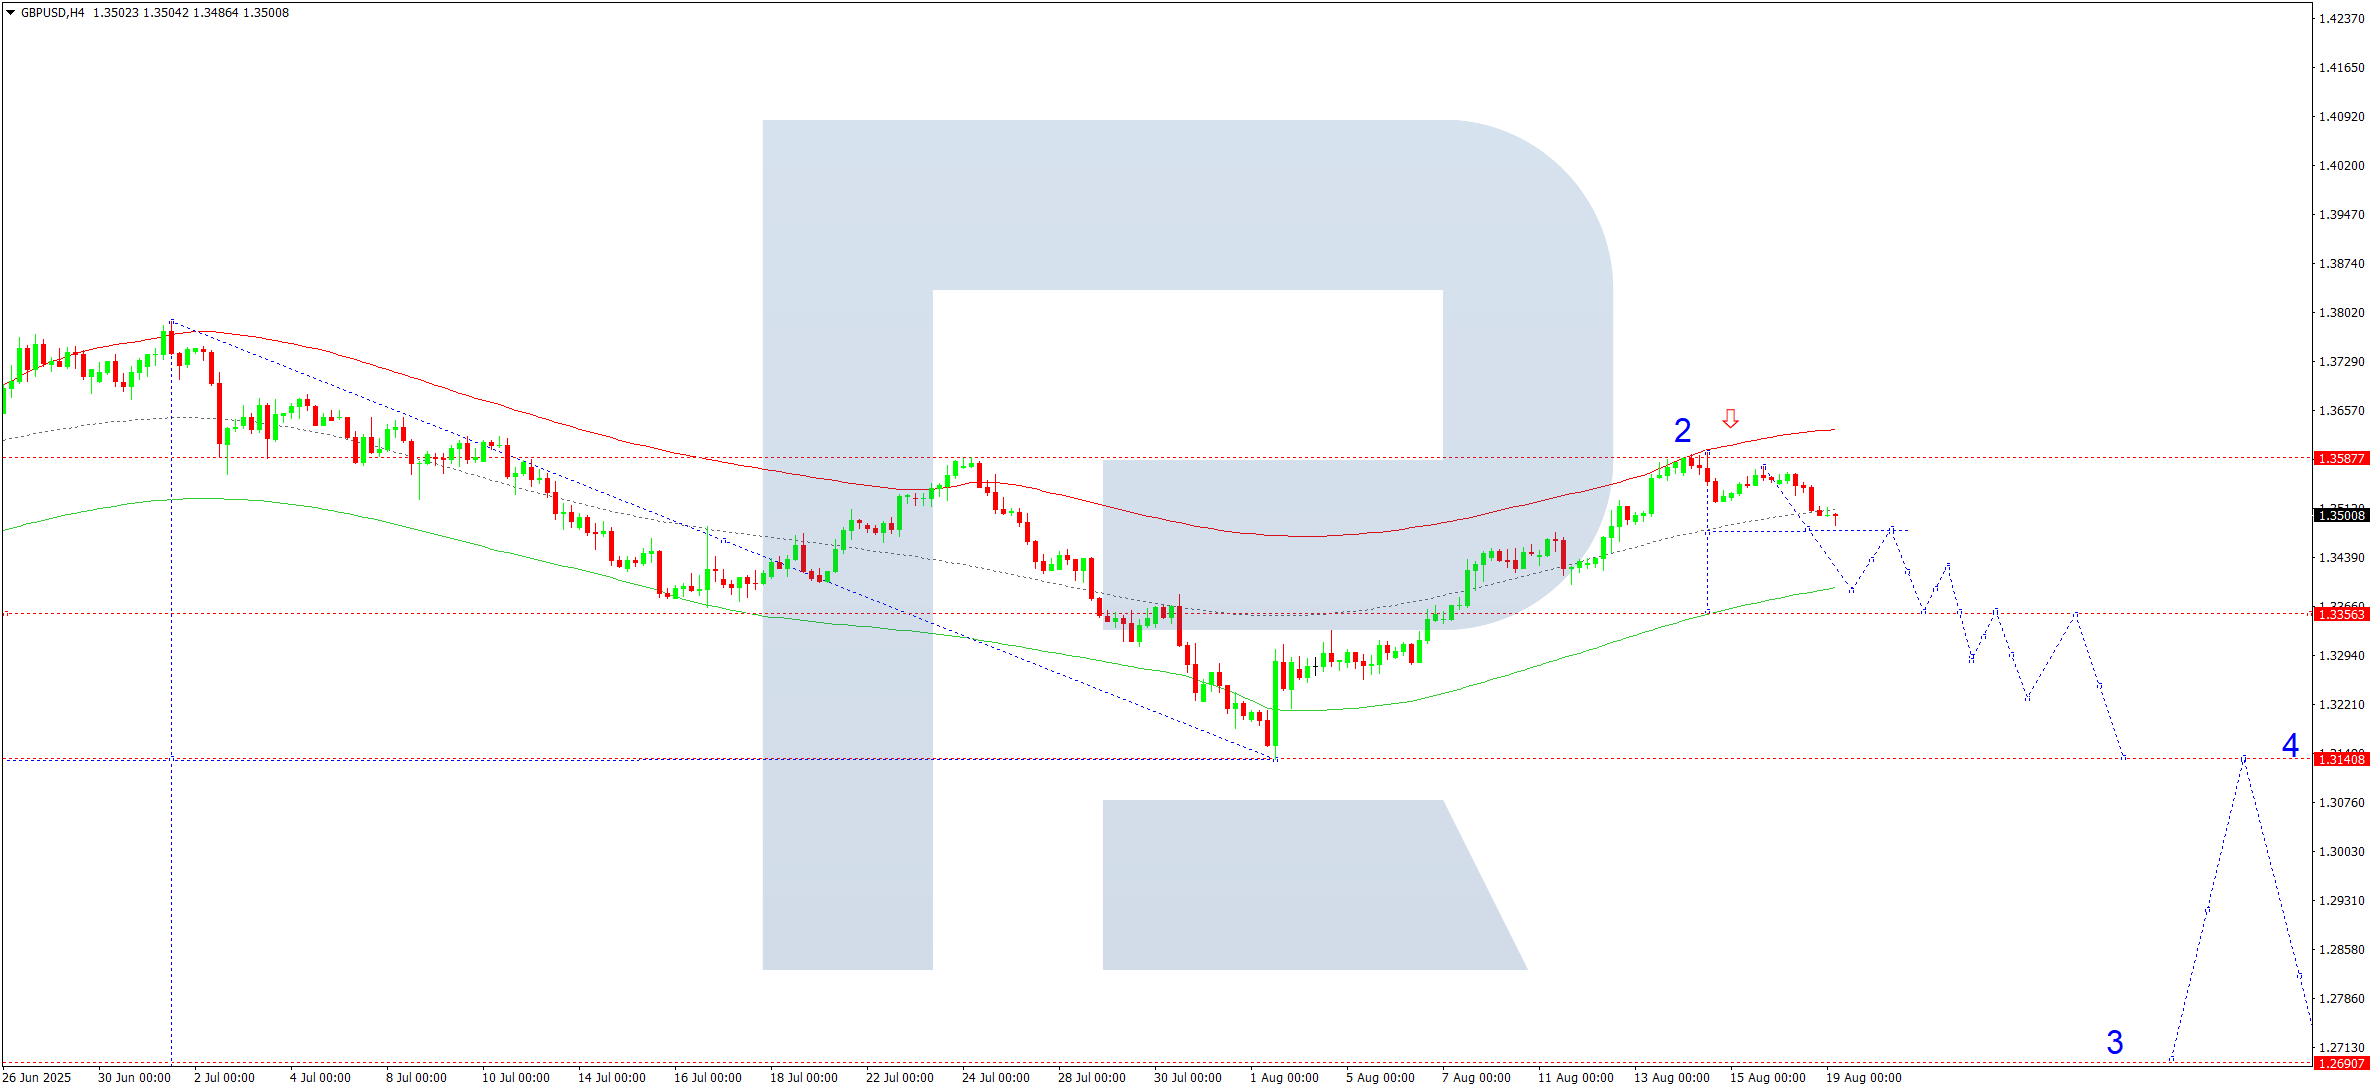
On the H4 chart of GBPUSD, the market has completed a correction structure to 1.3563. Today, 19 August 2025, the pair could break below the range’s lower boundary at 1.3500. If the breakout is confirmed, the market may begin a downward wave towards 1.3355. This is the first target in the structure, with potential continuation to 1.3140.
Technically, the Elliott wave structure and the downward wave matrix with a pivot at 1.3355 confirm this scenario as key for GBPUSD. Currently, the market has completed a corrective wave to the upper boundary of the Price Envelope at 1.3590. We expect consolidation below this level, followed by a downward wave towards the lower boundary at 1.3355.
Technical indicators for today’s GBPUSD forecast suggest a downward wave towards 1.3355.
AUDUSD forecast
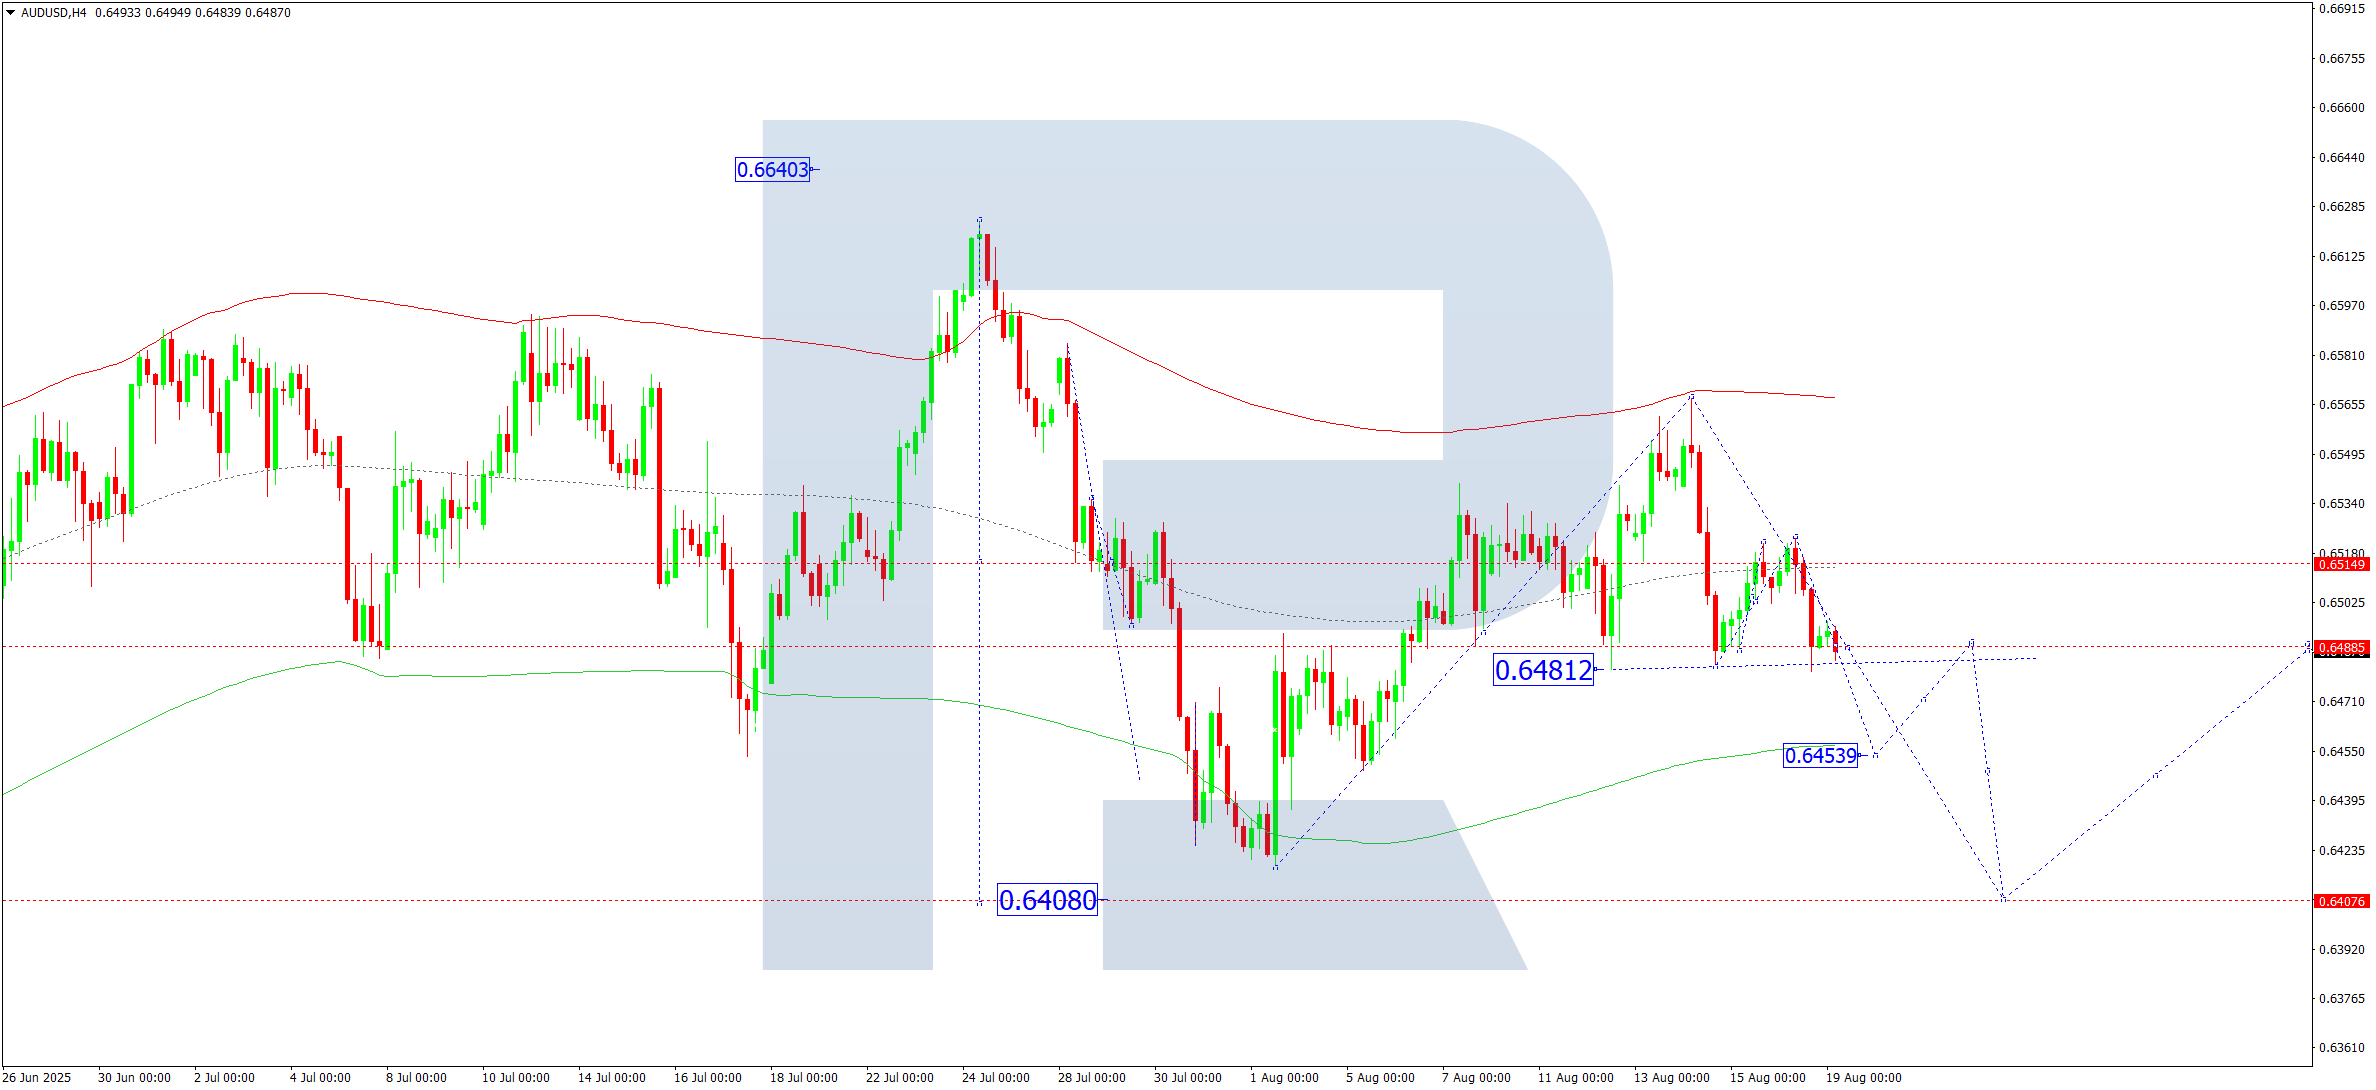
On the H4 chart of AUDUSD, the market completed a downward impulse, reaching 0.6480. Today, 19 August 2025, the pair is expected to break below this level and continue the wave to 0.6454. Afterwards, a correction back to 0.6480 (testing from below) is possible. Later, we may see the trend continue to 0.6408, the first target.
Technically, the Elliott wave structure and the downward wave matrix for AUDUSD with a pivot at 0.6515 confirm this scenario as key. At the moment, the market is forming the fifth downward wave towards the lower boundary of the Price Envelope at 0.6454. Afterwards, the price is expected to correct to the central line at 0.6480.
Technical indicators for today’s AUDUSD forecast suggest a downward wave towards 0.6454.
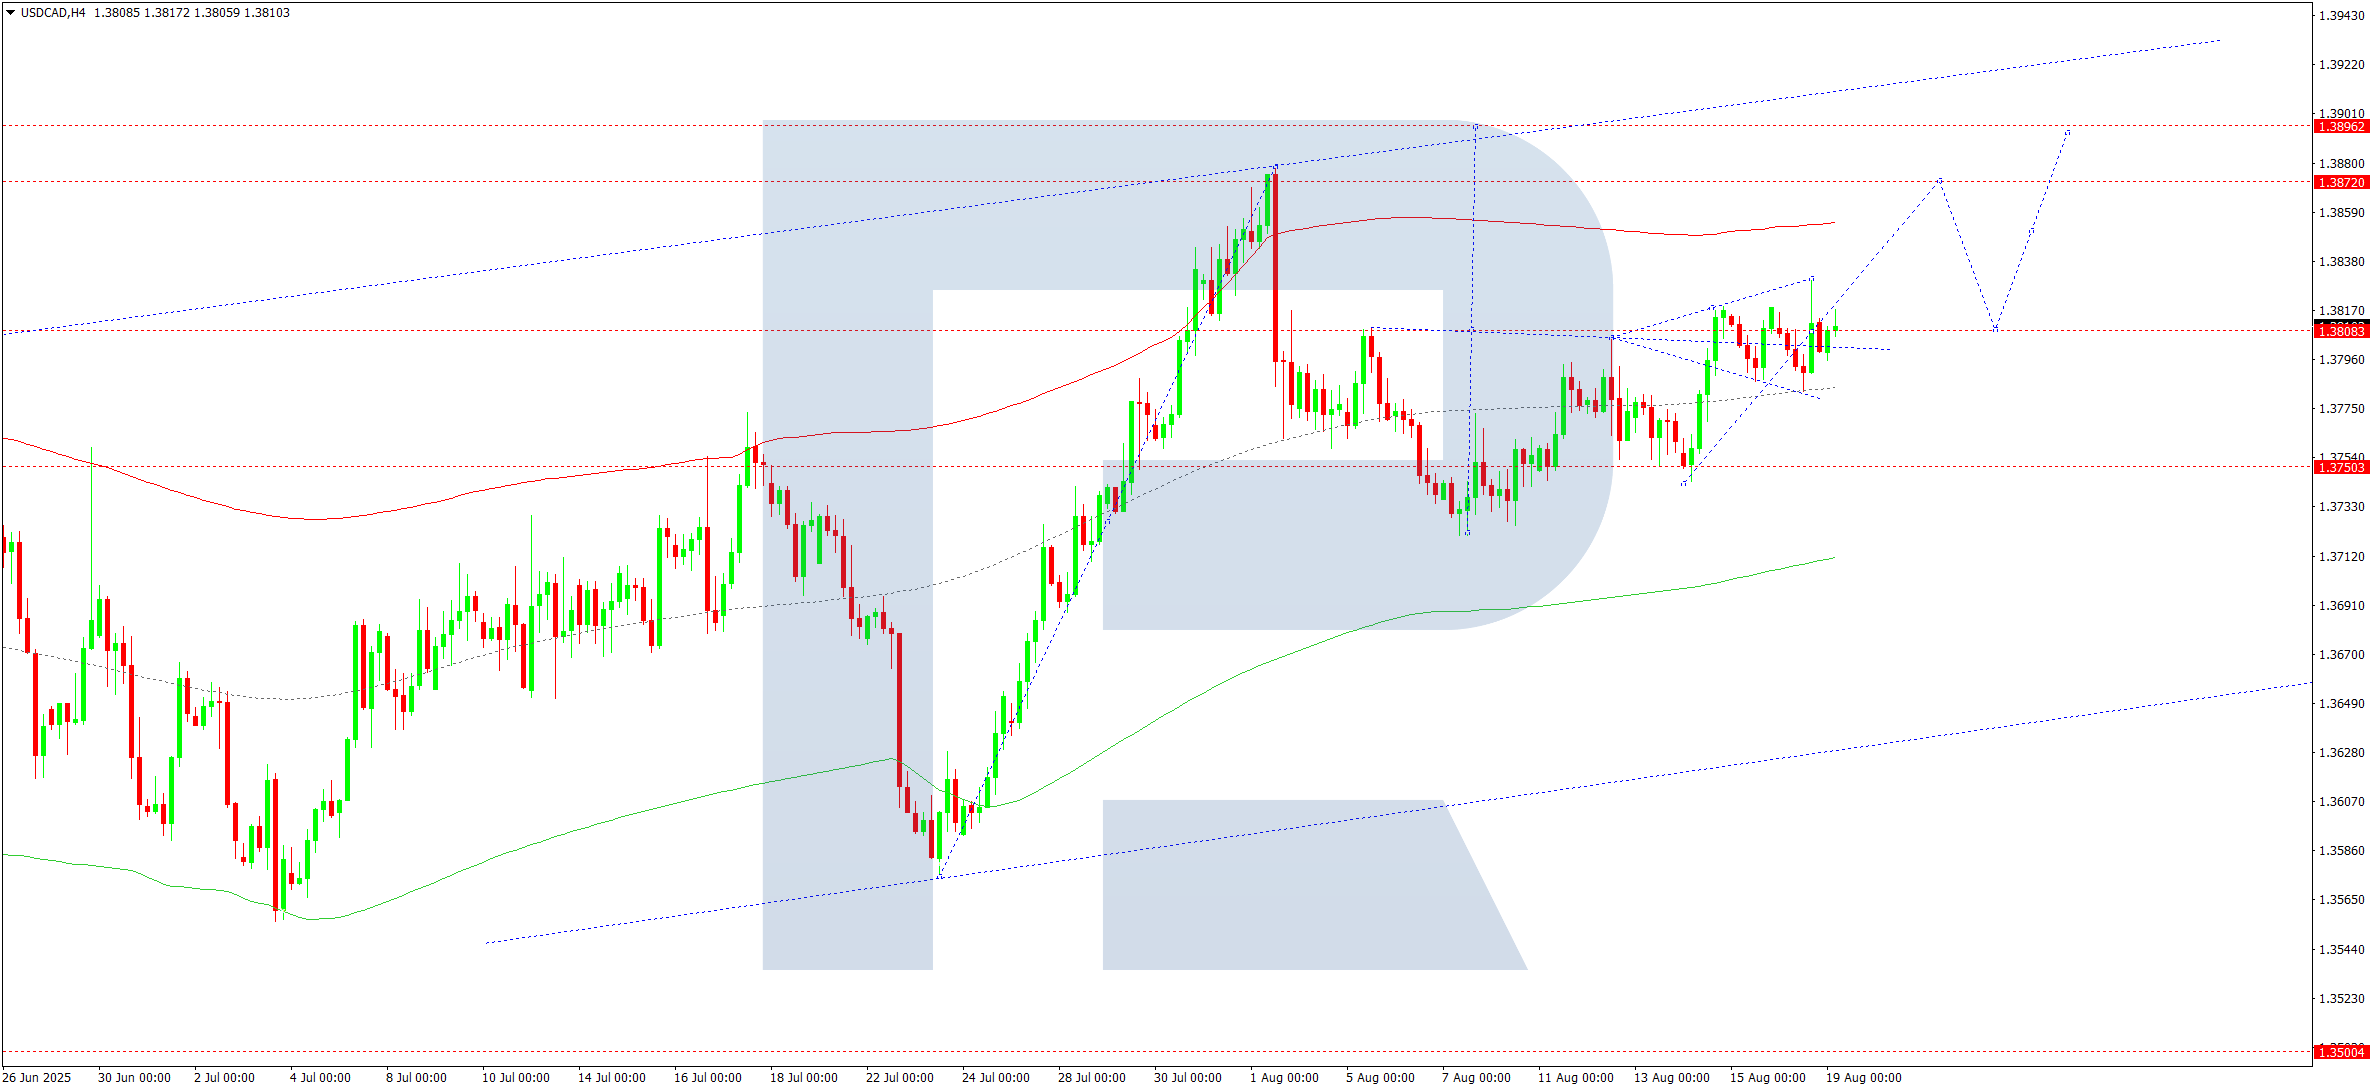
USDCAD forecast
On the H4 chart of USDCAD, the market continues developing a consolidation range around 1.3800. Today, 19 August 2025, the pair could break upwards, aiming for 1.3872 as a local target. Afterwards, a correction towards 1.3800 (testing from above) is possible, followed by another upward wave to 1.3890.
Technically, the Elliott wave structure and the growth wave matrix with a pivot at 1.3715 confirm this scenario as key for USDCAD. At the moment, the market has formed a consolidation range around the central line of the Price Envelope at 1.3800 and is breaking upwards. Today, growth towards the upper boundary at 1.3872 remains possible.
Technical indicators for today’s USDCAD forecast suggest a continuation of the upward wave to 1.3872.
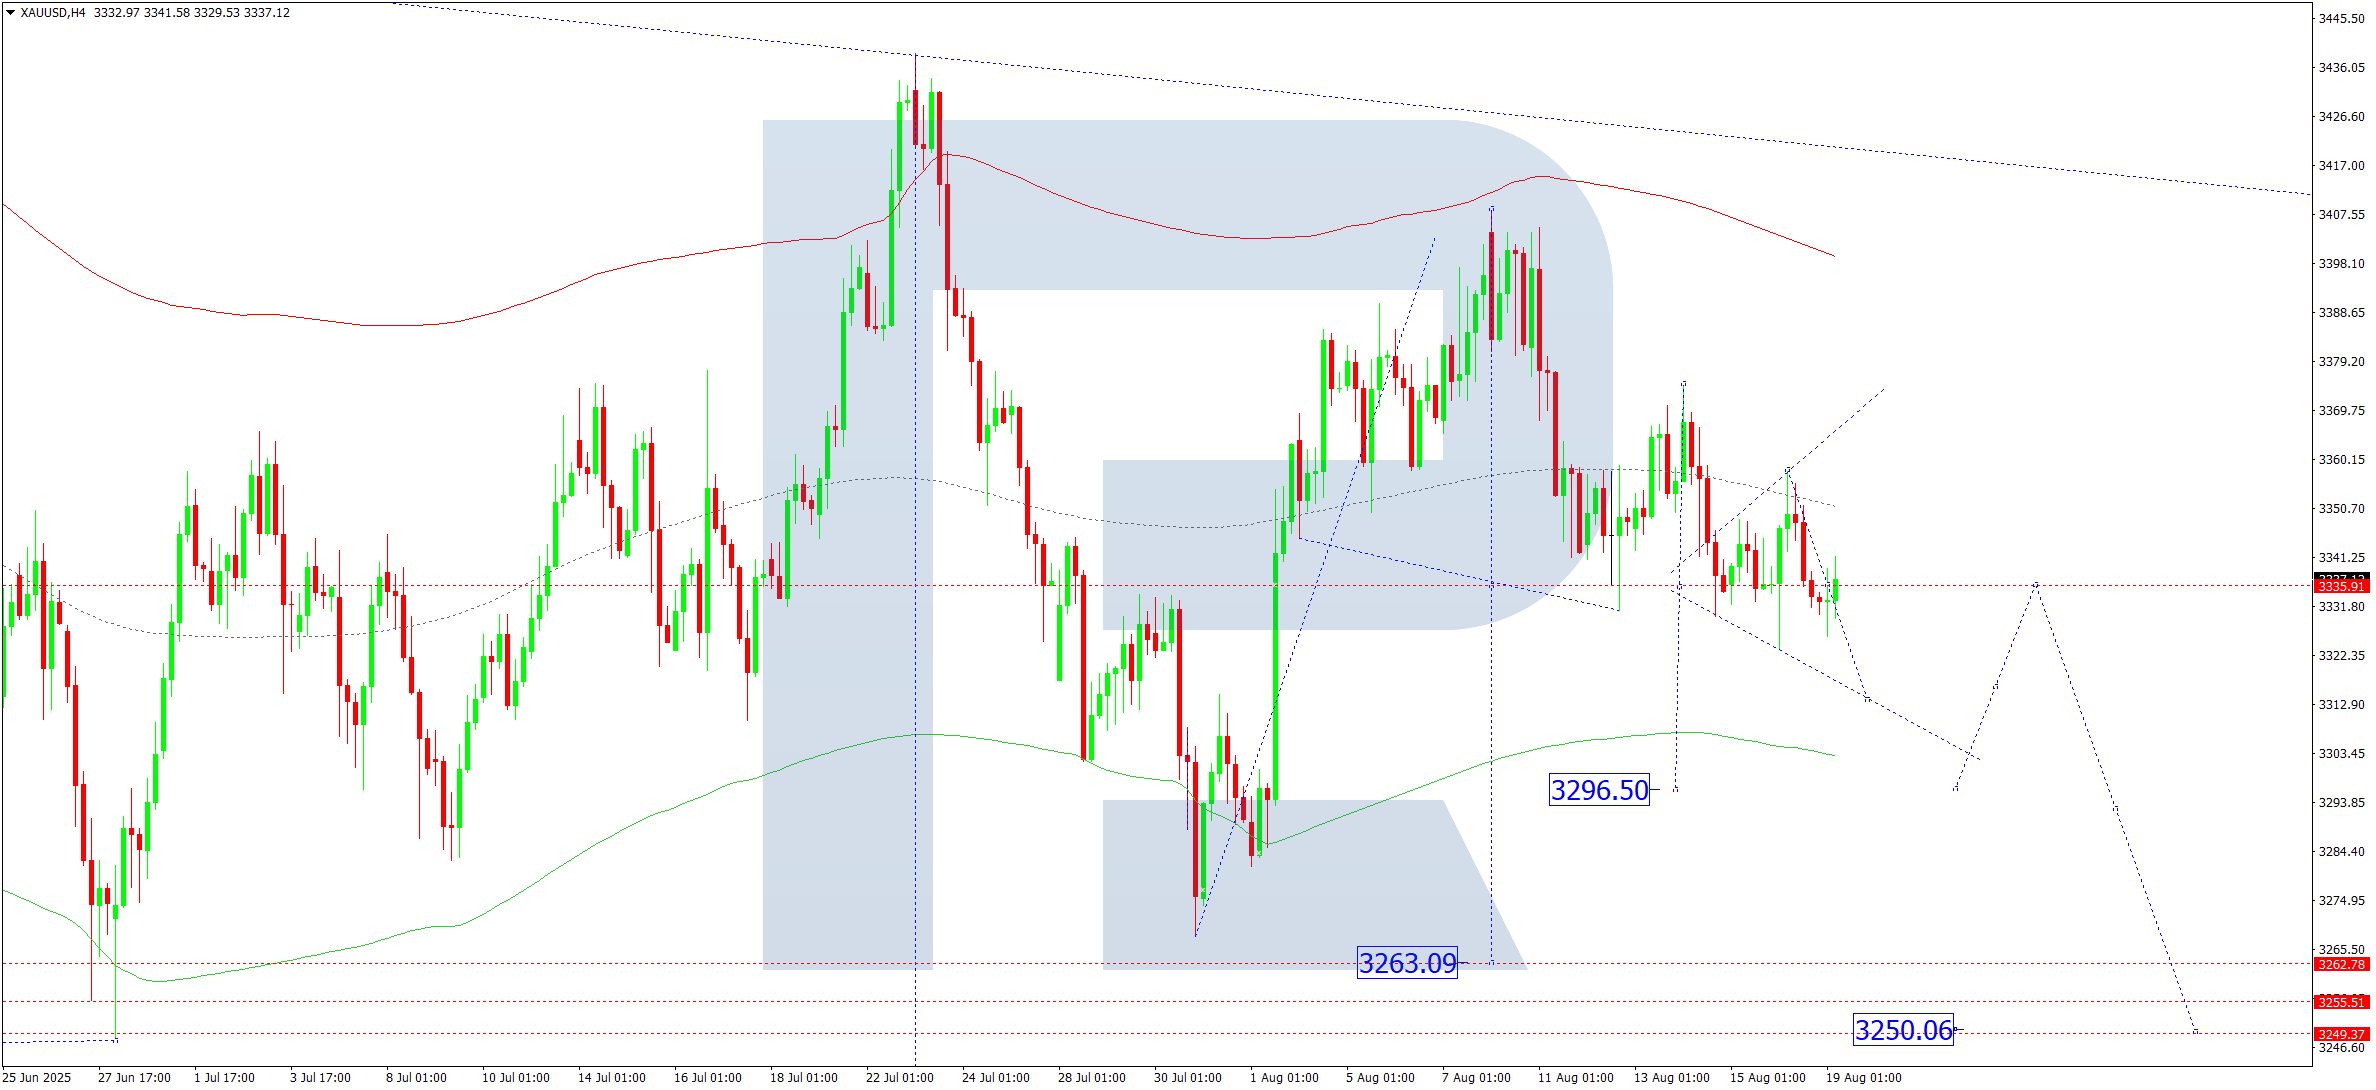
XAUUSD forecast
On the H4 chart of XAUUSD, the market is developing a consolidation range around 3,335 without a clear trend. Today, 19 August 2025, prices could break below the range, targeting 3,295, with continuation to 3,255.
Technically, the Elliott wave structure and the downward wave matrix with a pivot at 3,335 confirm this scenario as key for XAUUSD. At the moment, the market is correcting towards the lower boundary of the Price Envelope at 3,295. Later, prices may rebound to the central line at 3,335.
Technical indicators for today’s XAUUSD forecast point to a continued correction towards 3,295.
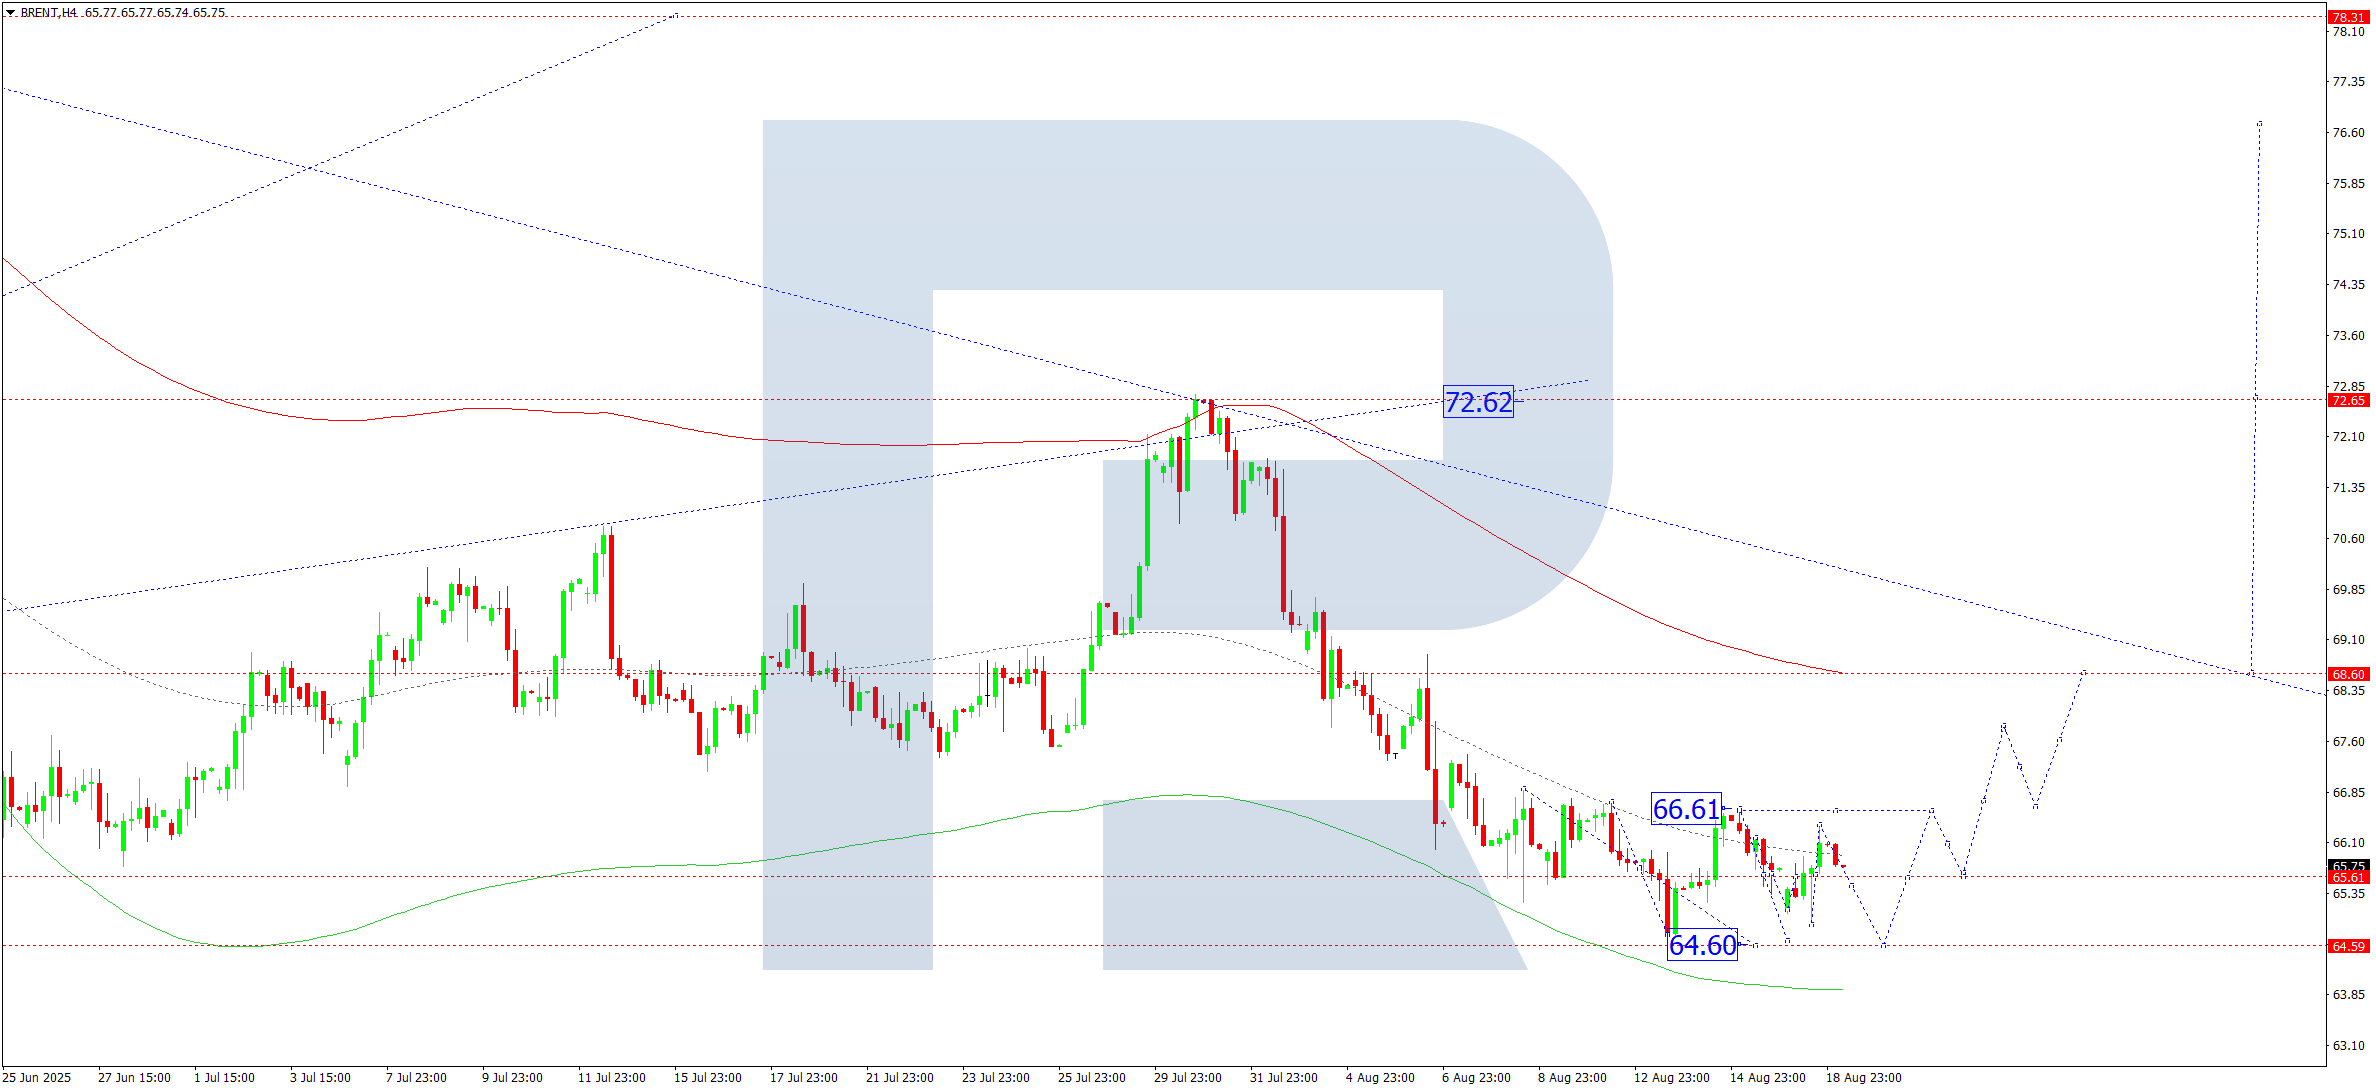
Brent forecast
On the H4 chart of Brent, the market continues to develop a consolidation range around 65.60. Today, 19 August 2025, the range may expand downwards to 64.60. Afterwards, we expect growth towards 66.60. If the market breaks this level upwards, the wave may extend to 68.60 with the prospect of continuing the trend to 72.60.
Technically, the Elliott wave structure and the downward wave matrix with a pivot at 68.60 confirm this scenario as key for Brent. At the moment, the market is completing a wave towards the lower boundary of the Price Envelope at 64.60. Later, prices could climb towards the upper boundary at 68.60 with the potential continuation of the trend to 72.60.
Technical indicators for today’s Brent forecast suggest a possible start of a growth wave towards 68.88.
Forecasts presented in this section only reflect the author’s private opinion and should not be considered as guidance for trading. RoboForex bears no responsibility for trading results based on trading recommendations described in these analytical reviews.