Daily technical analysis and forecast for 18 August 2025
Here is a detailed daily technical analysis and forecast for EURUSD, USDJPY, GBPUSD, AUDUSD, USDCAD, XAUUSD and Brent for 18 August 2025.
EURUSD forecast
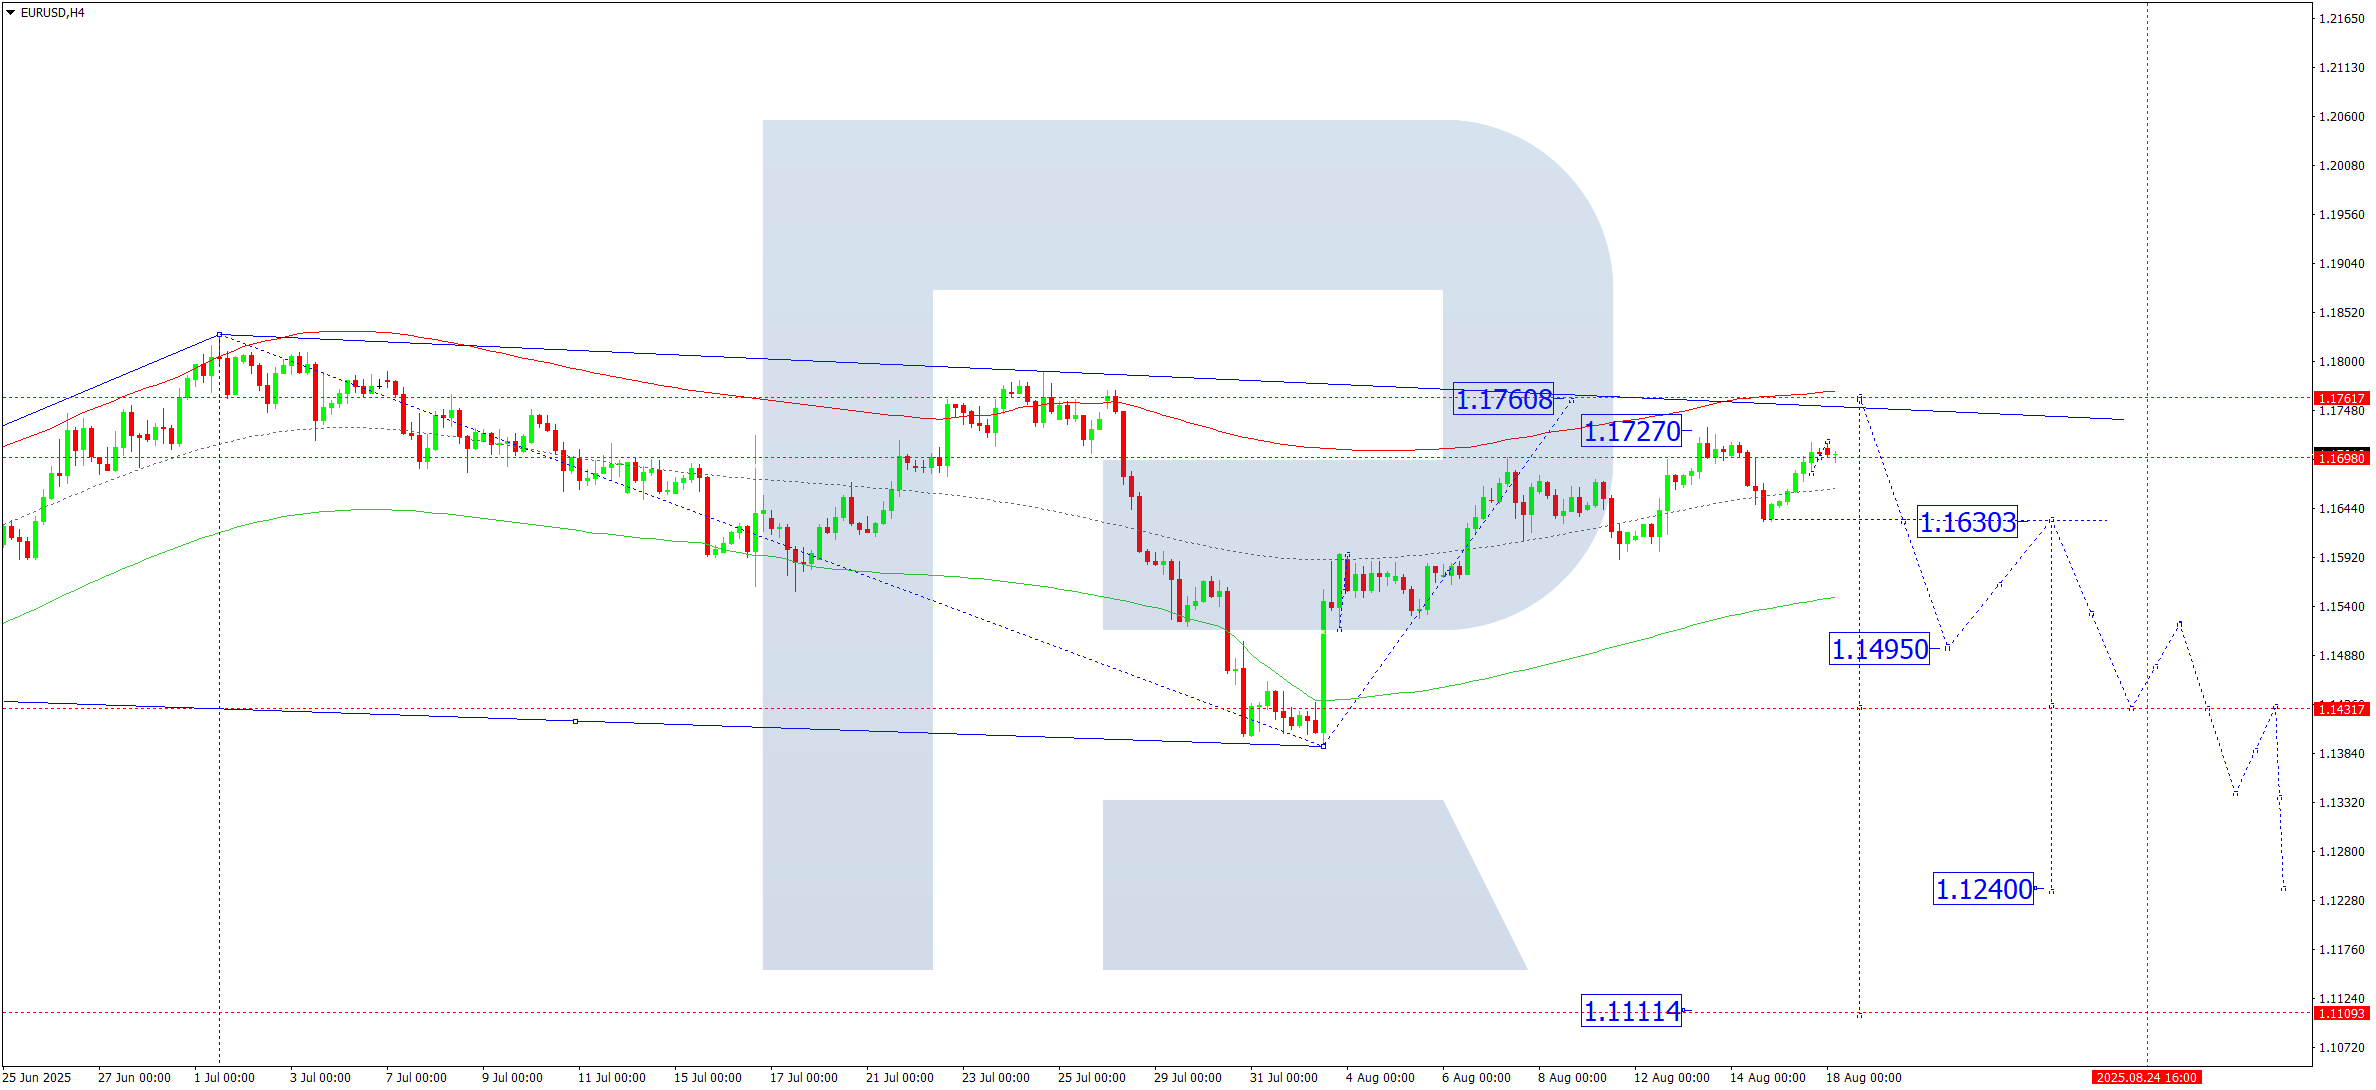
On the H4 chart of EURUSD, the market executed another growth structure to 1.1698. Practically, the potential of this upward structure, seen as a correction, has been completed. Today, 18 August 2025, a compact consolidation range could develop around this level. An upward breakout is not ruled out as an alternative, stretching the correction towards 1.1760. The main scenario remains a downward breakout towards 1.1630. Later on, another growth leg to 1.1690 is possible, followed by a decline to 1.1430 with further prospects of a wave extending to 1.1240 and 1.1111.
Technically, this scenario is supported by the Elliott wave structure and the decline wave matrix with a pivot at 1.1590, considered key for the EURUSD wave structure. At the moment, the market is correcting towards the upper boundary of the Price Envelope at 1.1760. After the price reaches this target, a new downward wave is expected to start, aiming for the lower boundary at 1.1495.
Technical indicators for today’s EURUSD forecast suggest a downward wave towards 1.1495.
USDJPY forecast
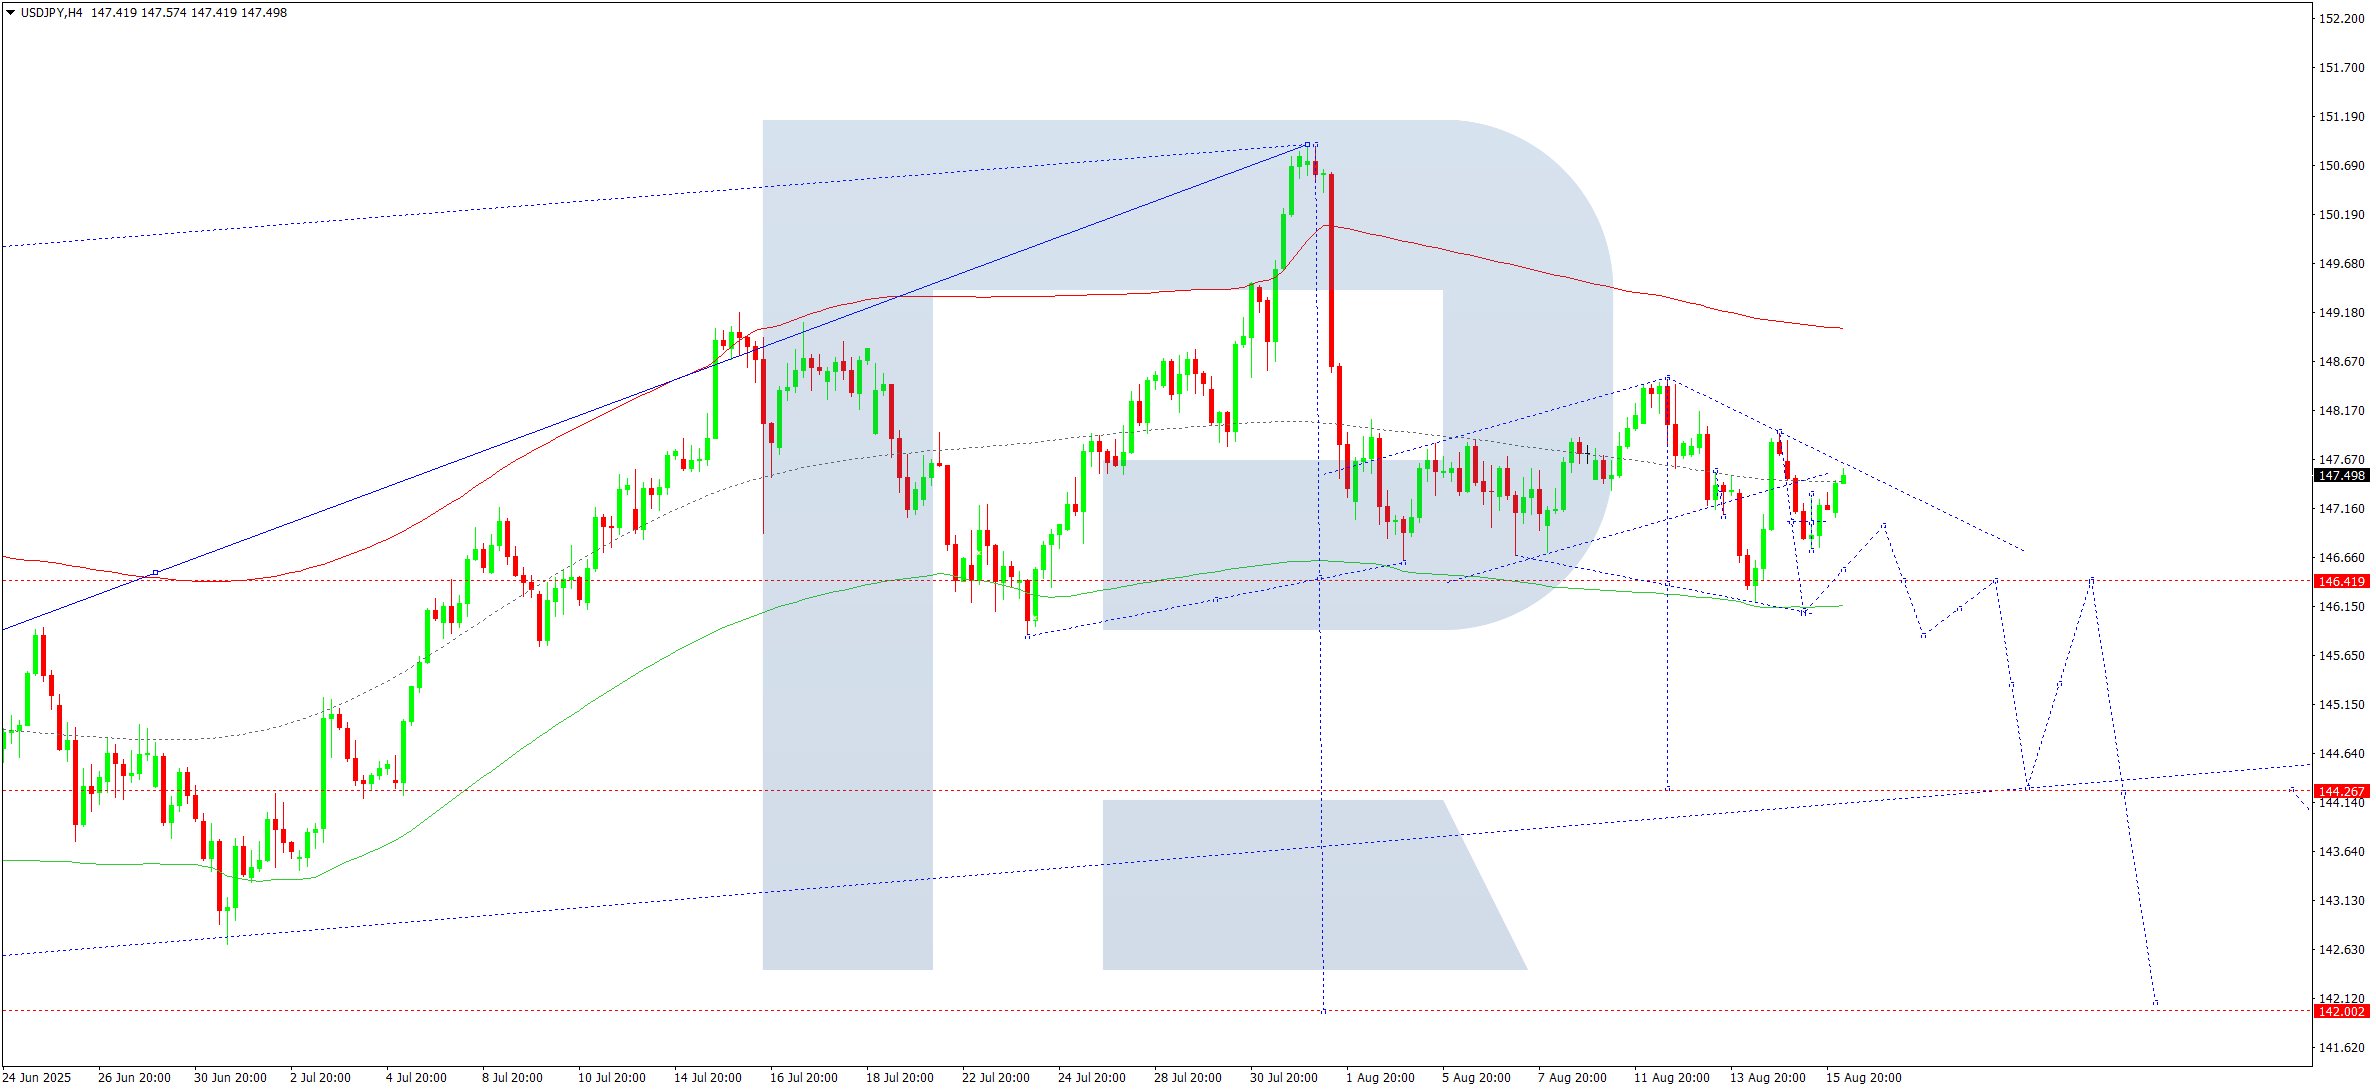
On the H4 chart of USDJPY, the market continues forming a narrow consolidation range around 147.35. Today, 18 August 2025, a decline to the lower boundary at 146.40 is expected. A breakout below could open potential for a wave towards 144.26 as a local target.
Technically, this scenario for USDJPY is supported by the Elliott wave structure and the decline wave matrix with a pivot at 147.35, viewed as key in this wave. At the moment, the market has completed consolidation around the central line of the Price Envelope at 147.35. A downward breakout is expected with a move towards the lower boundary at 146.00. Further on, the probability of breaking this level and extending the wave towards 144.26 will be considered.
Technical indicators for today’s USDJPY forecast suggest the probability of continued decline to 146.00.
GBPUSD forecast
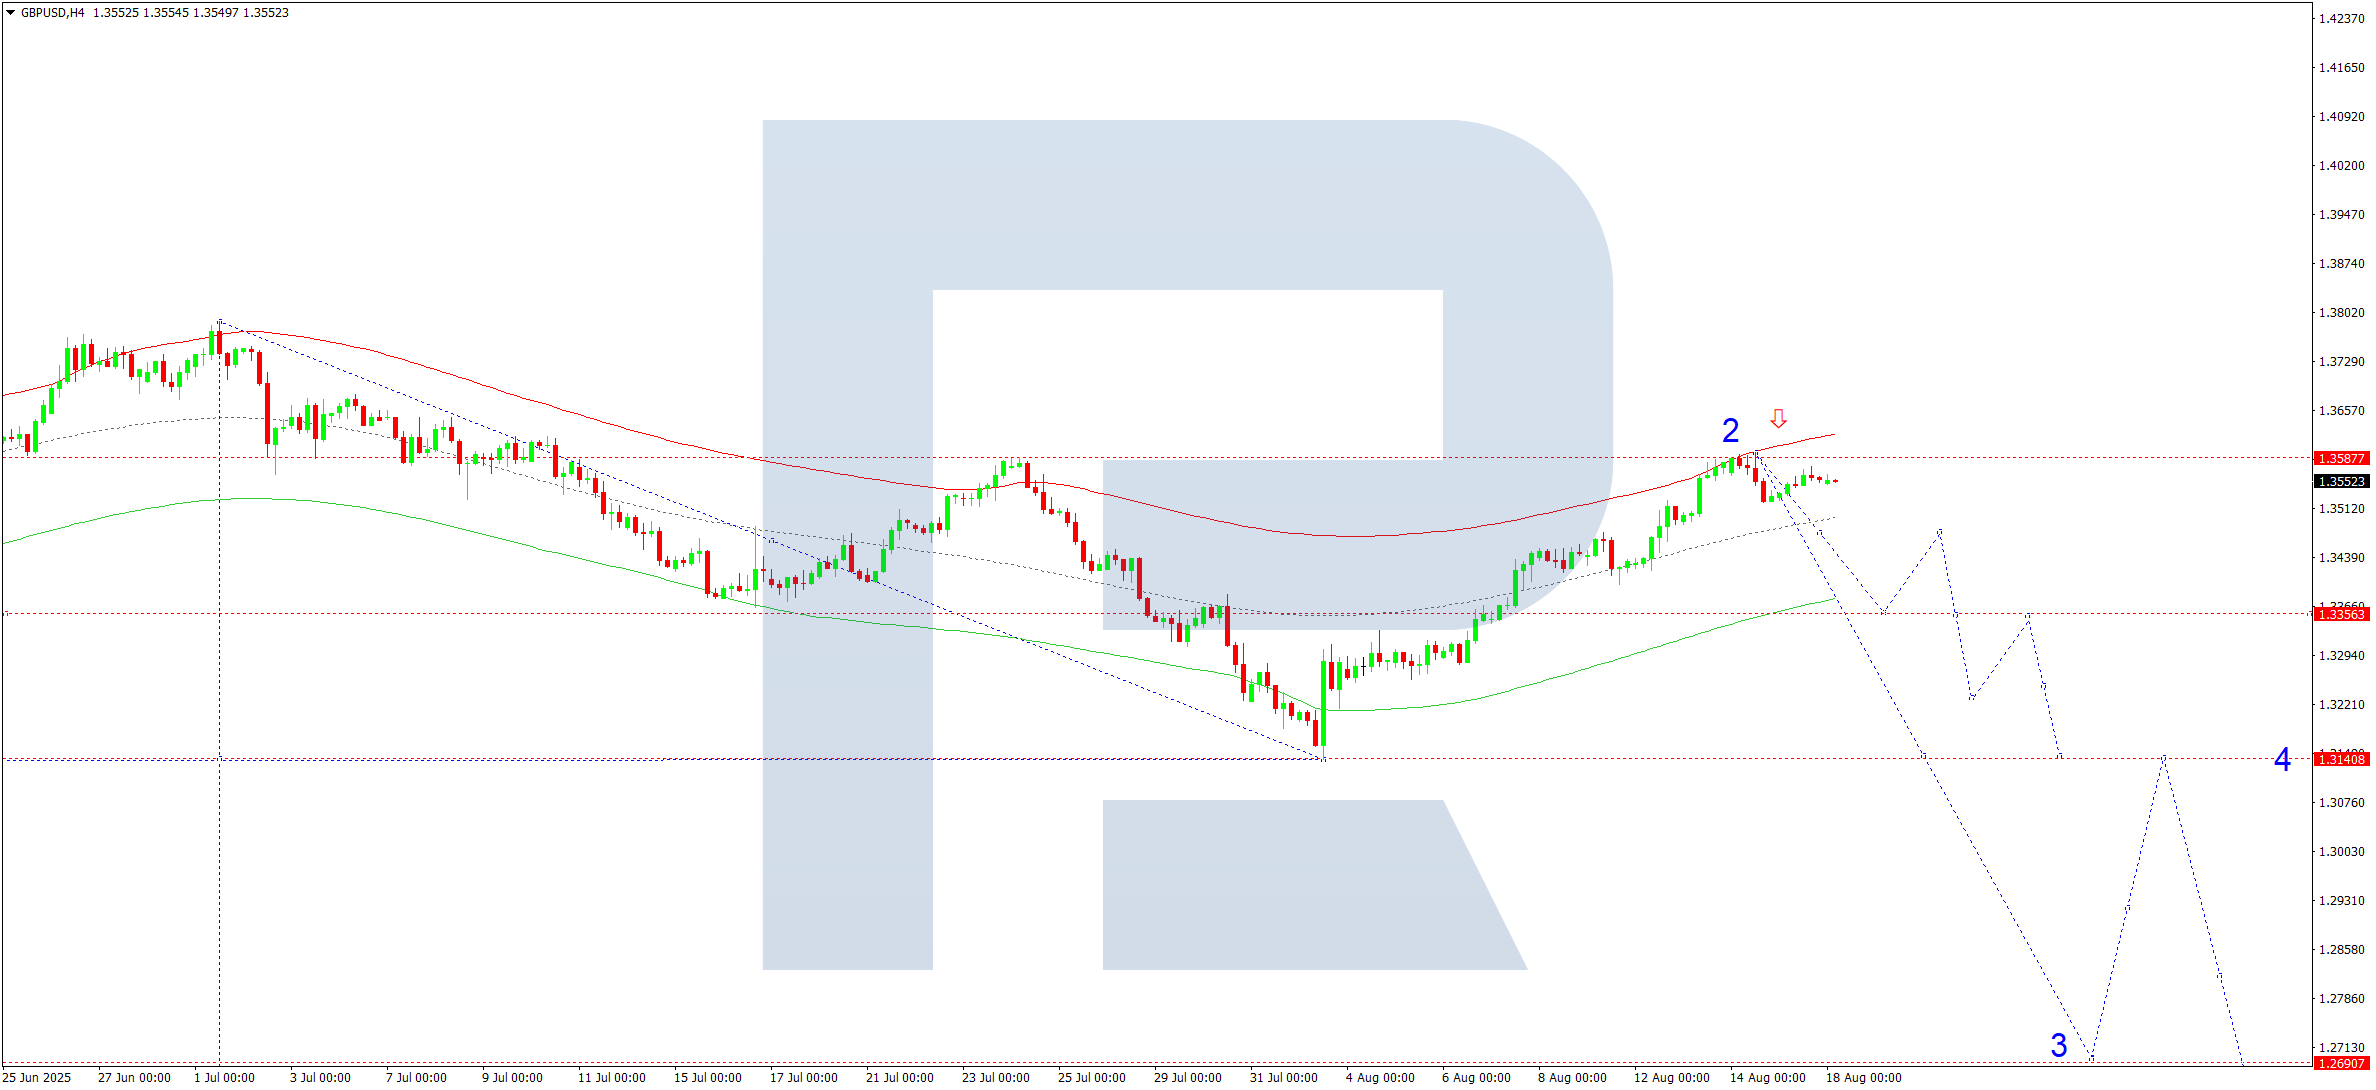
On the H4 chart of GBPUSD, the market completed a corrective structure to 1.3590. Today, 18 August 2025, a consolidation range is expected to form below this level. A downward breakout could signal the beginning of a wave towards 1.3355, with the first target in the structure at 1.3140.
Technically, this scenario for GBPUSD is supported by the Elliott wave structure and the decline wave matrix with a pivot at 1.3355, which is considered key in this wave. At the moment, the market has completed a correction wave towards the upper boundary of the Price Envelope at 1.3590. The relevant outlook is the development of a consolidation range below this level, followed by a downward wave towards the lower boundary at 1.3355.
Technical indicators for today’s GBPUSD forecast suggest a downward wave to 1.3355.
AUDUSD forecast
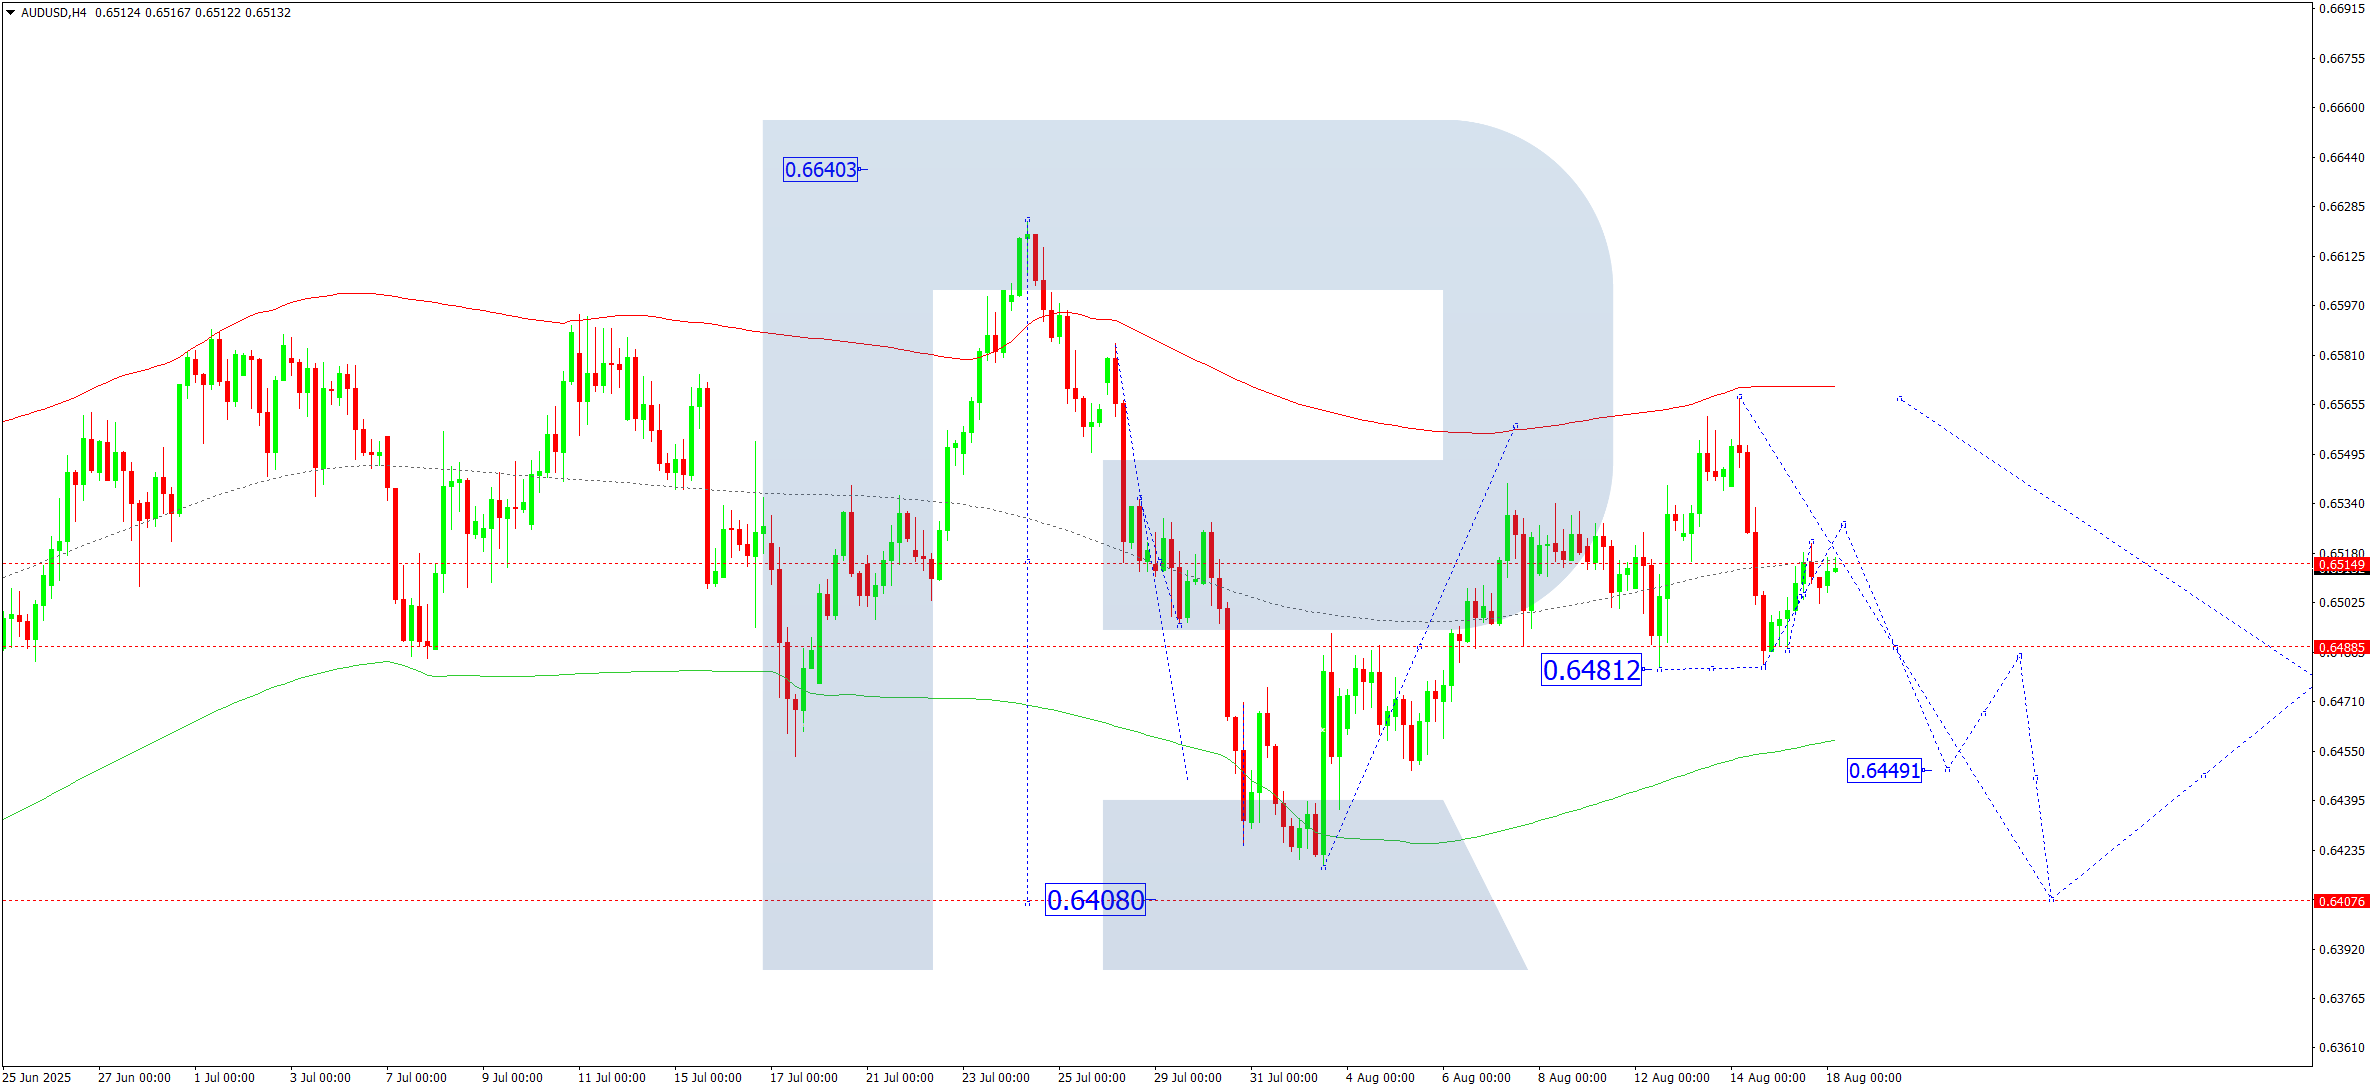
On the H4 chart of AUDUSD, the market continues its correction towards 0.6525. Today, 18 August 2025, this target level is expected to be reached. Afterwards, a downward wave towards 0.6480 may begin. A breakout below this level could open potential for a continuation towards 0.6408, the first target.
Technically, this scenario is confirmed by the Elliott wave structure and the AUDUSD decline wave matrix with a pivot at 0.6515, which is viewed as key for this wave. Currently, the market is moving in a correction wave towards the central line of the Price Envelope at 0.6525. Afterwards, a continuation to the lower boundary at 0.6408 is expected.
Technical indicators for today’s AUDUSD forecast suggest the possibility of a downward wave to 0.6408.
USDCAD forecast
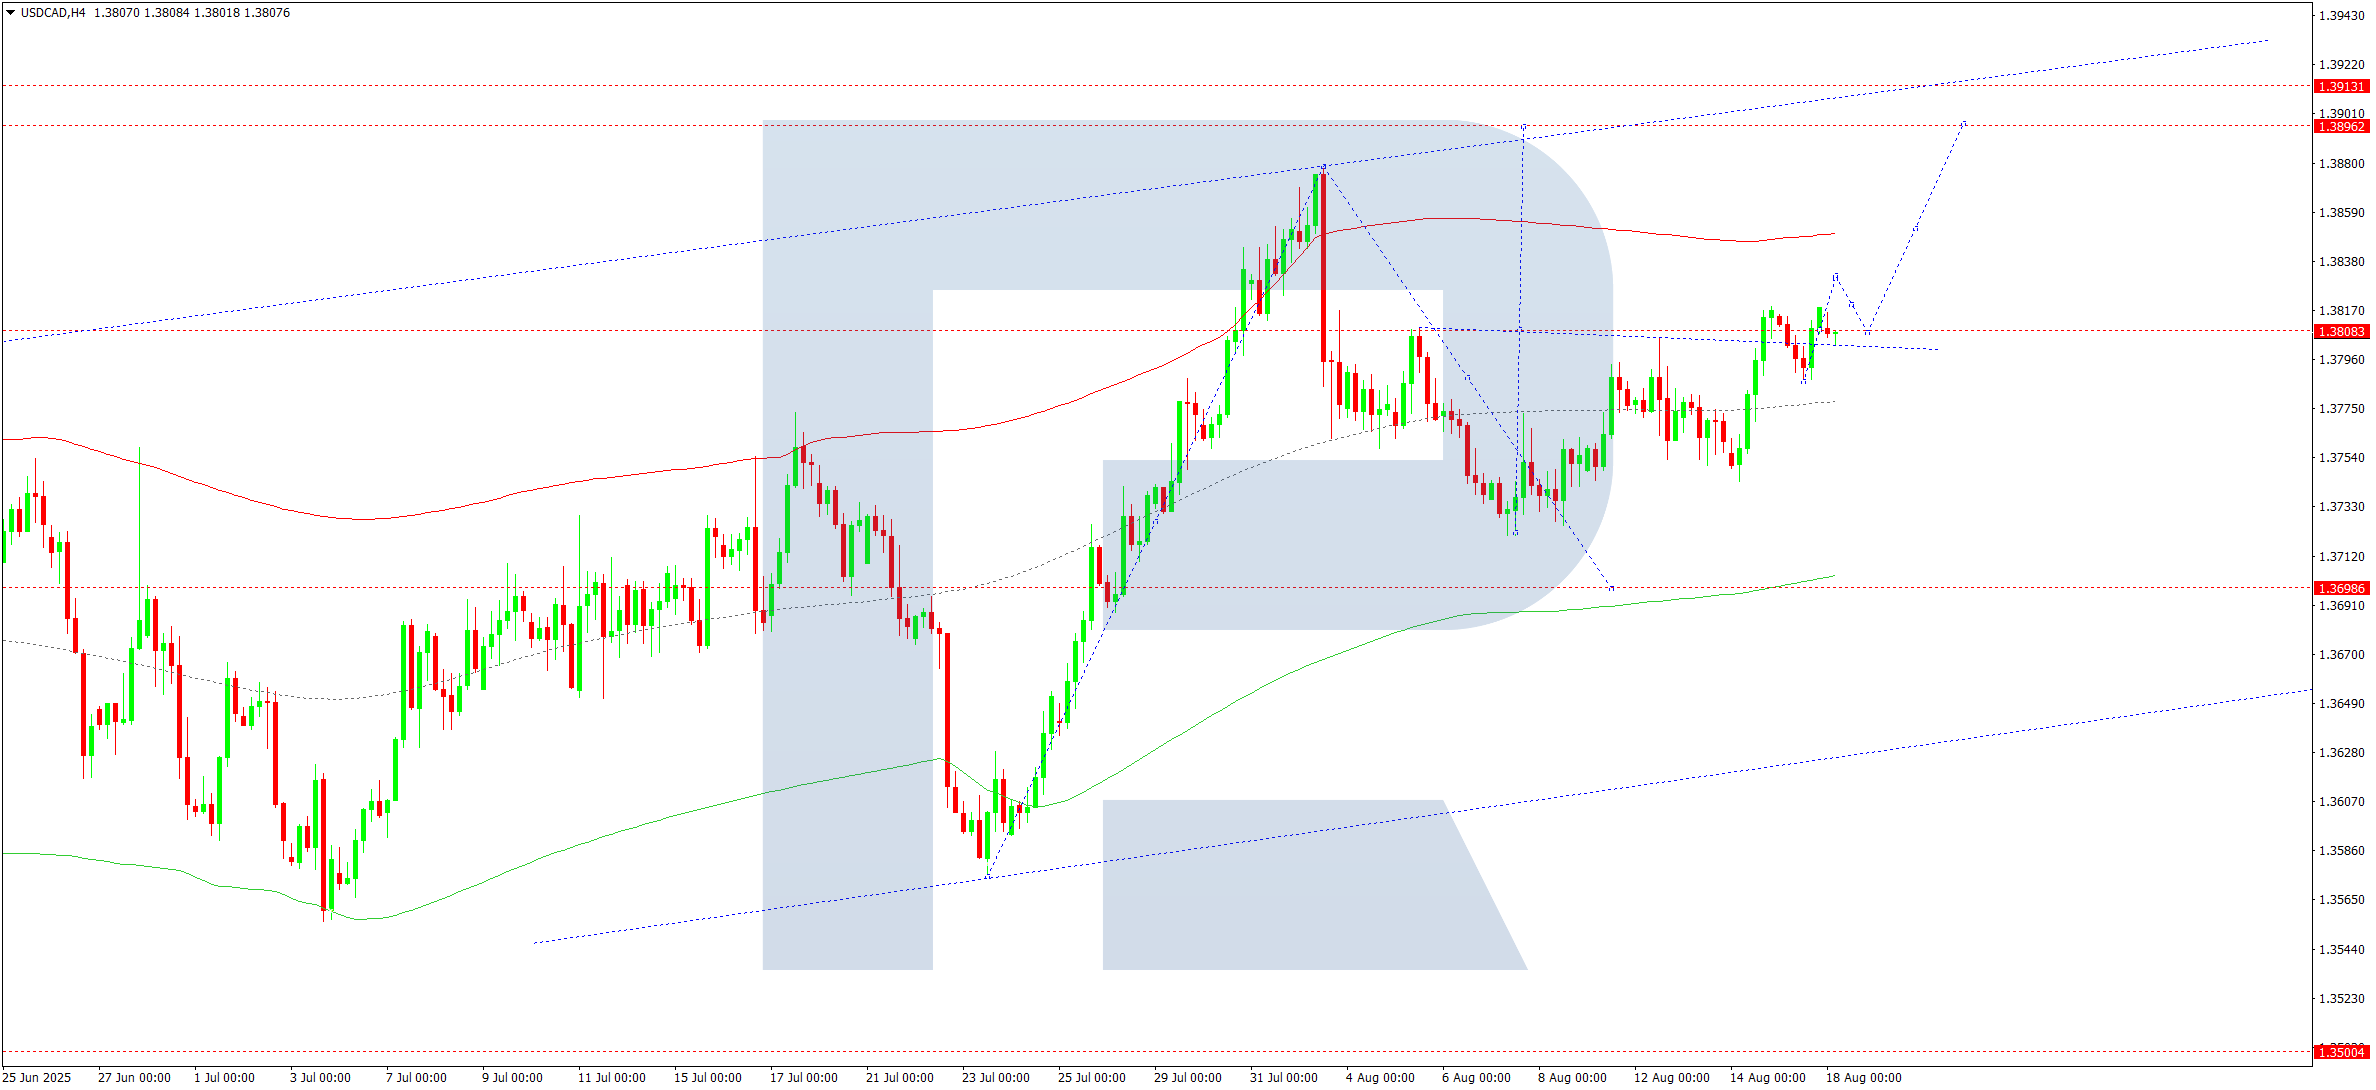
On the H4 chart of USDCAD, the market corrected to 1.3750. On 18 August 2025, an impulse growth to 1.3800 was executed. Currently, a consolidation range is forming around this level. An upward breakout may lead to a continuation towards 1.3890. If the breakout is downwards, another structure towards 1.3700 is possible, followed by growth to 1.3890 as a local target.
Technically, this scenario is supported by the Elliott wave structure and the growth wave matrix with a pivot at 1.3715, viewed as key in the USDCAD wave structure. At the moment, the market has formed consolidation around the central line of the Price Envelope at 1.3787 and is breaking upwards. Today, growth towards the upper boundary at 1.3890 remains relevant.
Technical indicators for today’s USDCAD forecast suggest continuation of the growth wave towards 1.3890.
XAUUSD forecast
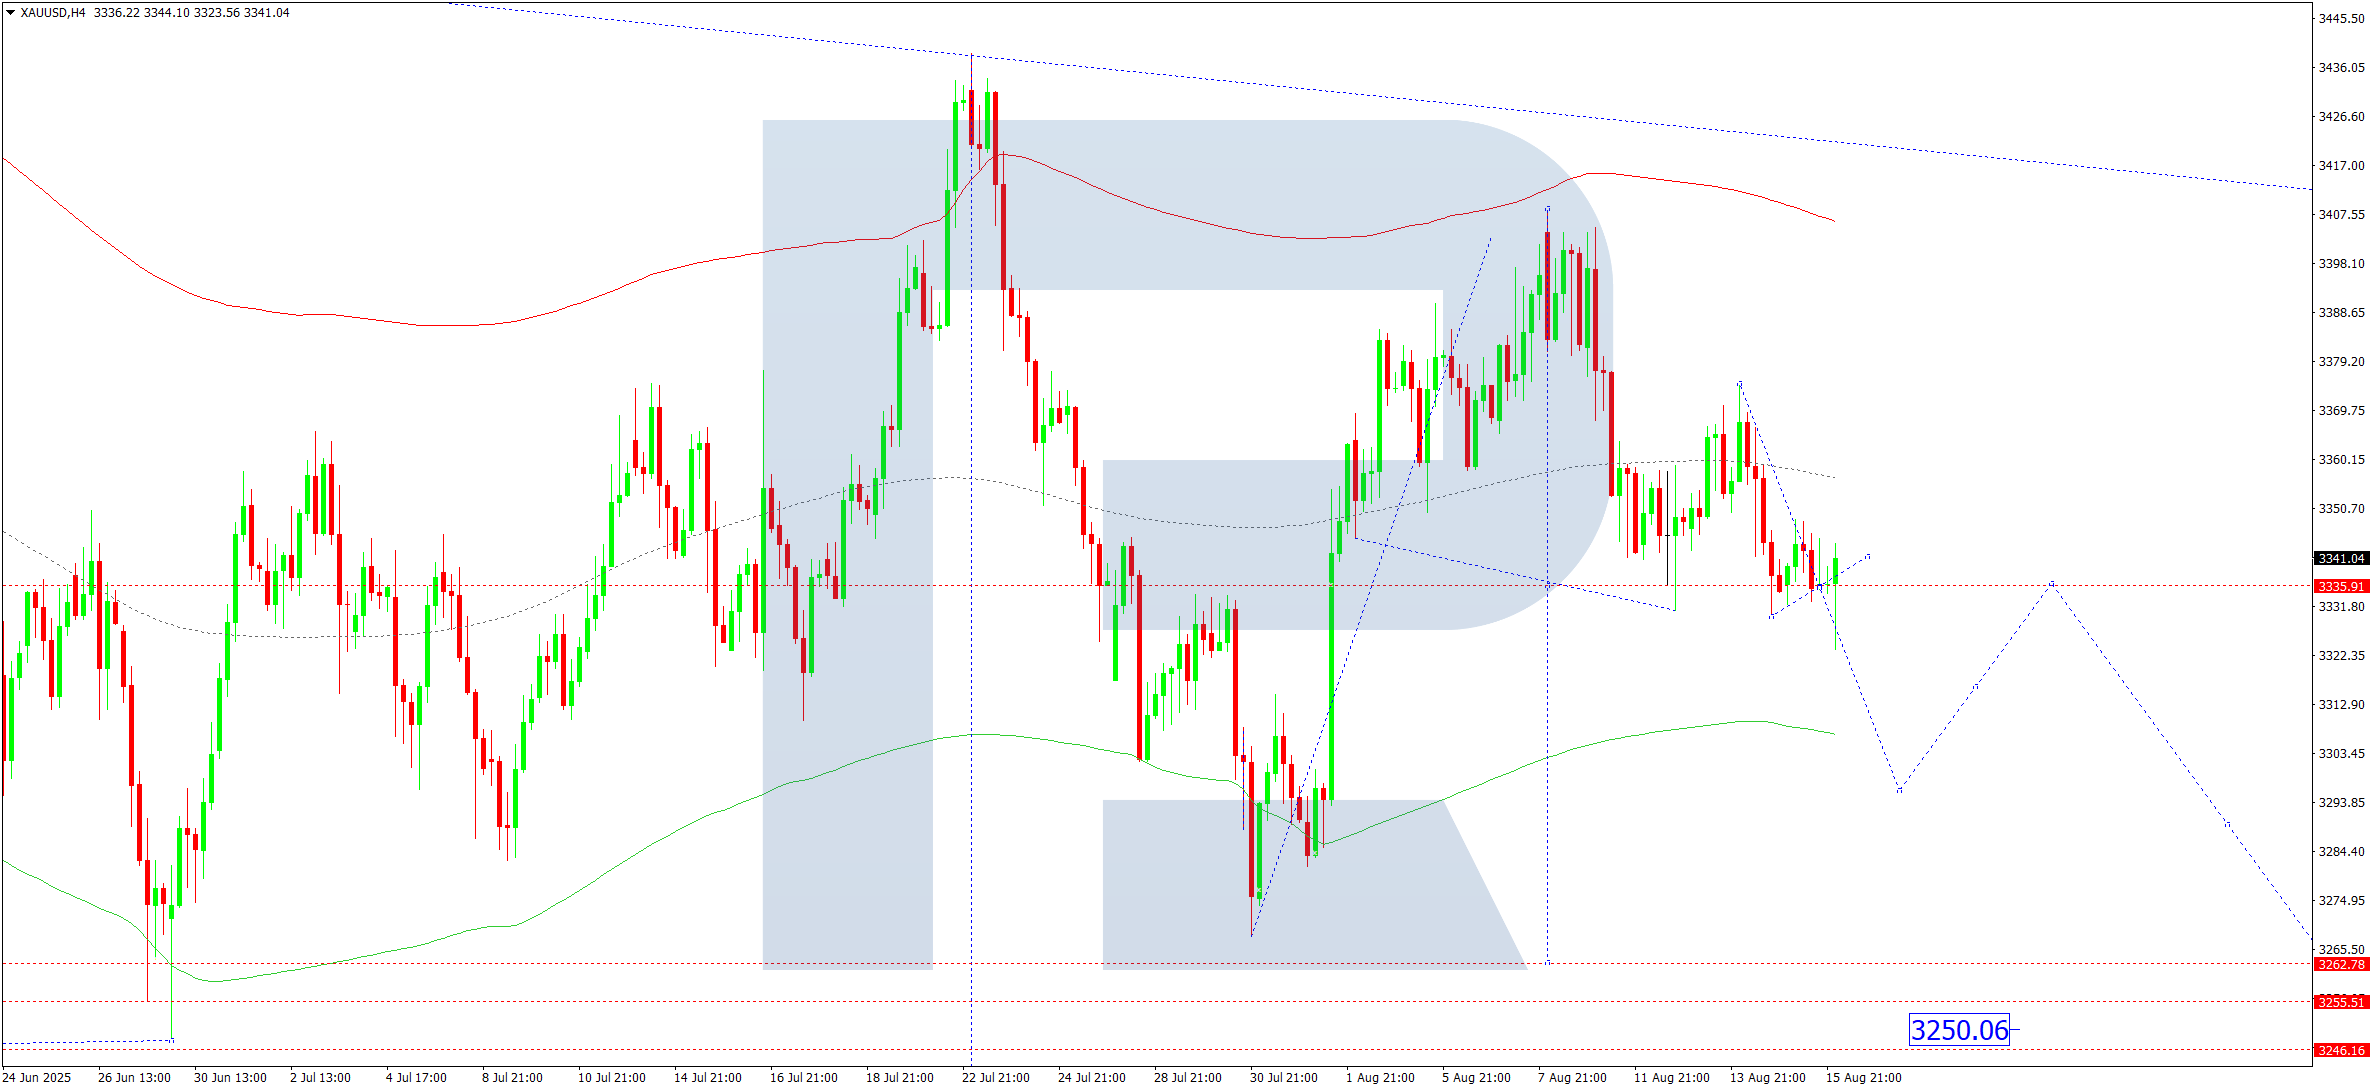
On the H4 chart of XAUUSD, the market is forming a consolidation range around 3,335. Today, 18 August 2025, a downward breakout towards 3,295 is expected, with prospects of extending the wave to 3,255.
Technically, this scenario is supported by the Elliott wave structure and the decline wave matrix with a pivot at 3,335, which is considered key for XAUUSD in this wave. At the moment, the market is correcting towards the lower boundary of the Price Envelope at 3,295. Later, a potential rise towards its central line at 3,335 may be considered.
Technical indicators for today’s XAUUSD forecast point to a continuation of the correction towards 3,295.
Brent forecast
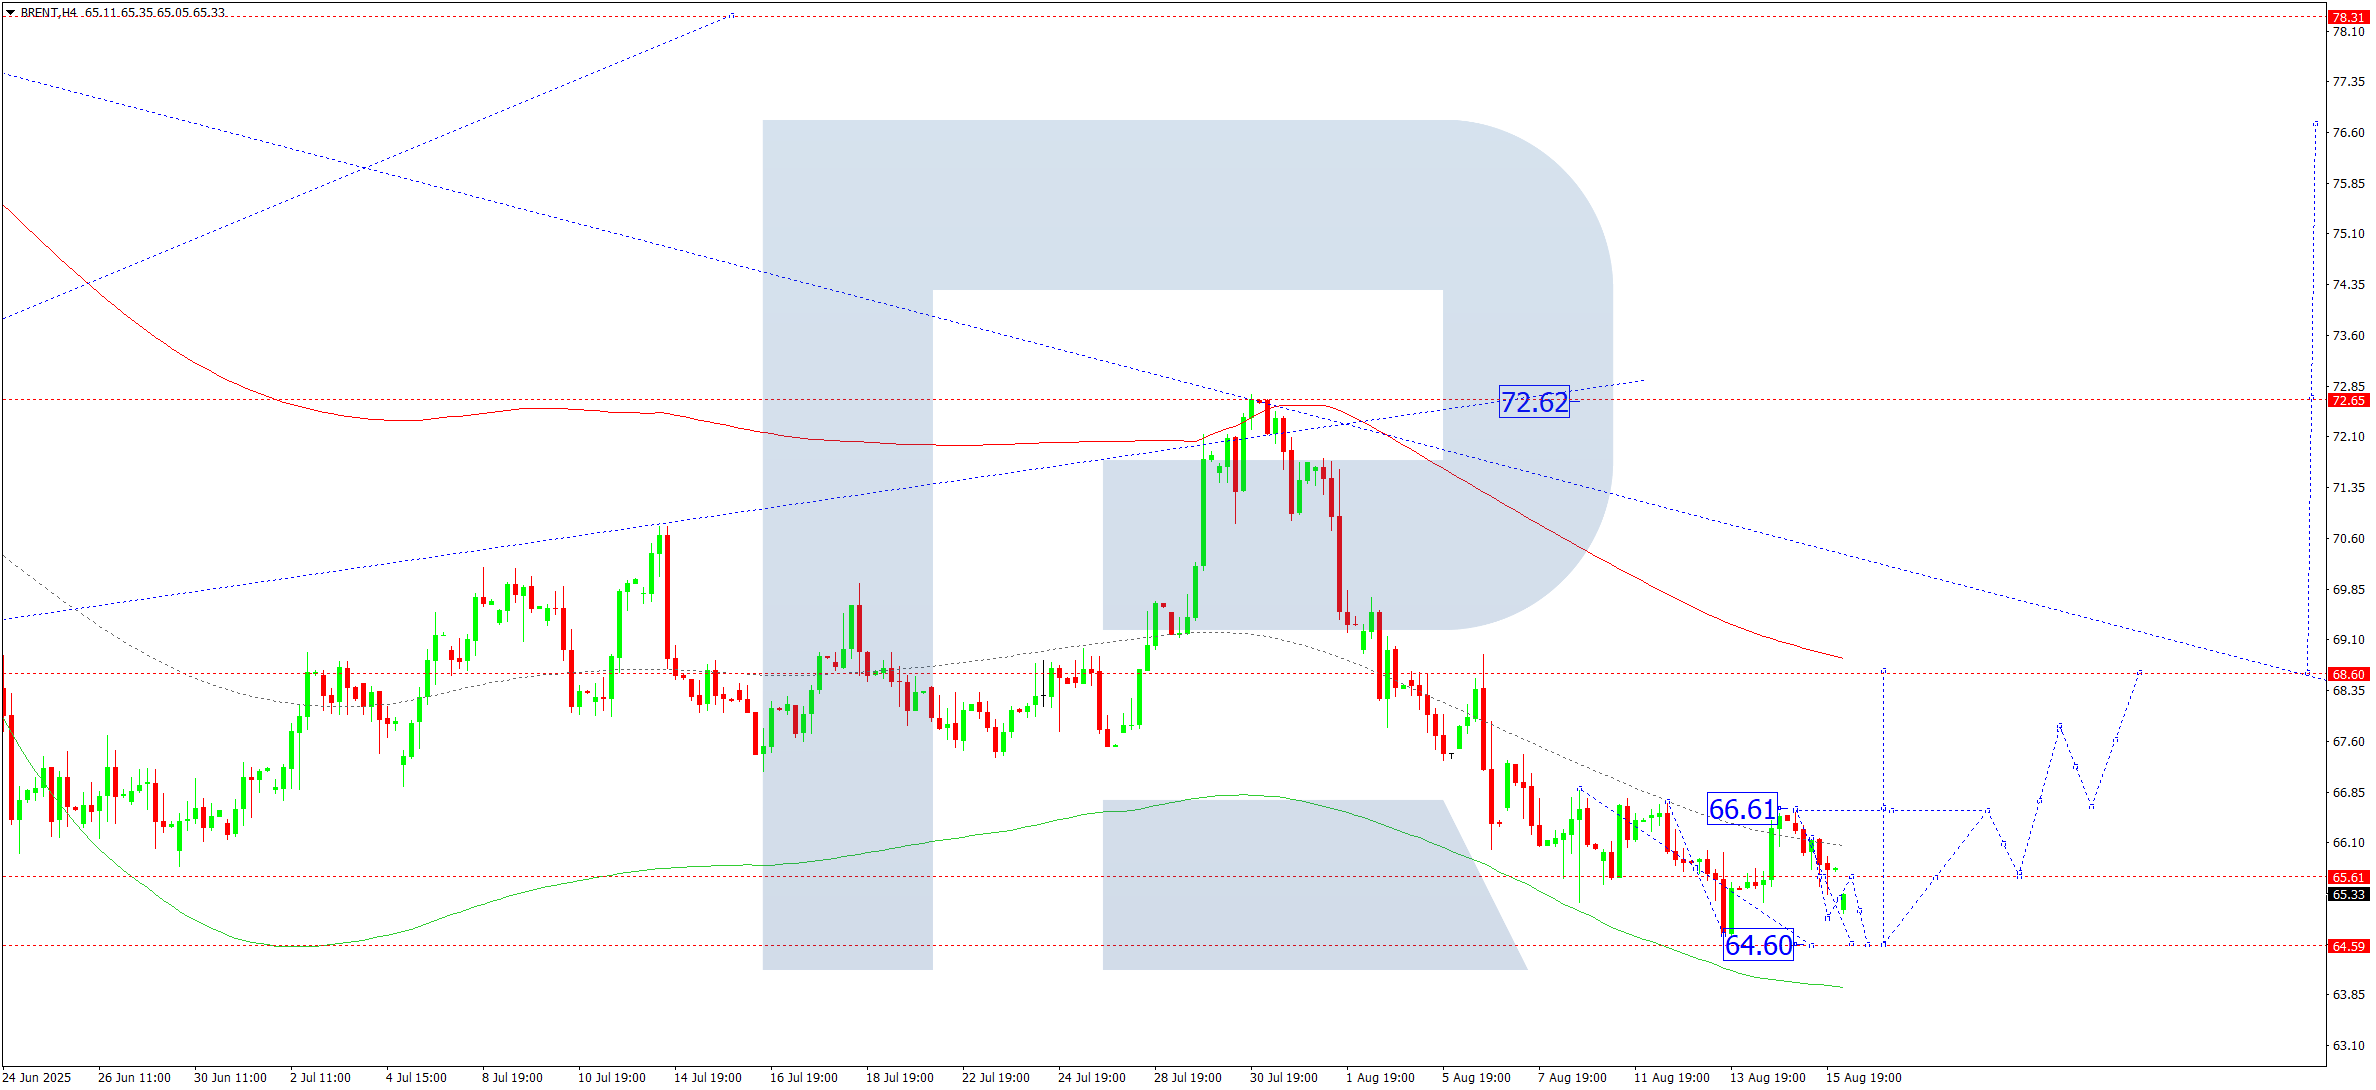
On the H4 chart of Brent crude, the market continues to develop a consolidation range around 65.60. Today, 18 August 2025, an extension of the range downwards to 64.60 is not ruled out. Afterwards, a rise towards 66.60 is expected. A breakout above this level may mark the start of a growth wave to 68.60, with the trend potentially continuing to 72.60.
Technically, this scenario is supported by the Elliott wave structure and the decline wave matrix with a pivot at 68.60, considered key for Brent in this wave. At the moment, the market is completing a wave towards the lower boundary of the Price Envelope at 64.60. Later, a rise towards the upper boundary at 68.60 is possible, with prospects of extending the trend to 72.60.
Technical indicators for today’s Brent forecast suggest a growth wave towards 68.88.
Forecasts presented in this section only reflect the author’s private opinion and should not be considered as guidance for trading. RoboForex bears no responsibility for trading results based on trading recommendations described in these analytical reviews.