Daily technical analysis and forecast for 16 July 2025
Here is a detailed daily technical analysis and forecast for EURUSD, USDJPY, GBPUSD, AUDUSD, USDCAD, XAUUSD and Brent for 16 July 2025.
EURUSD forecast
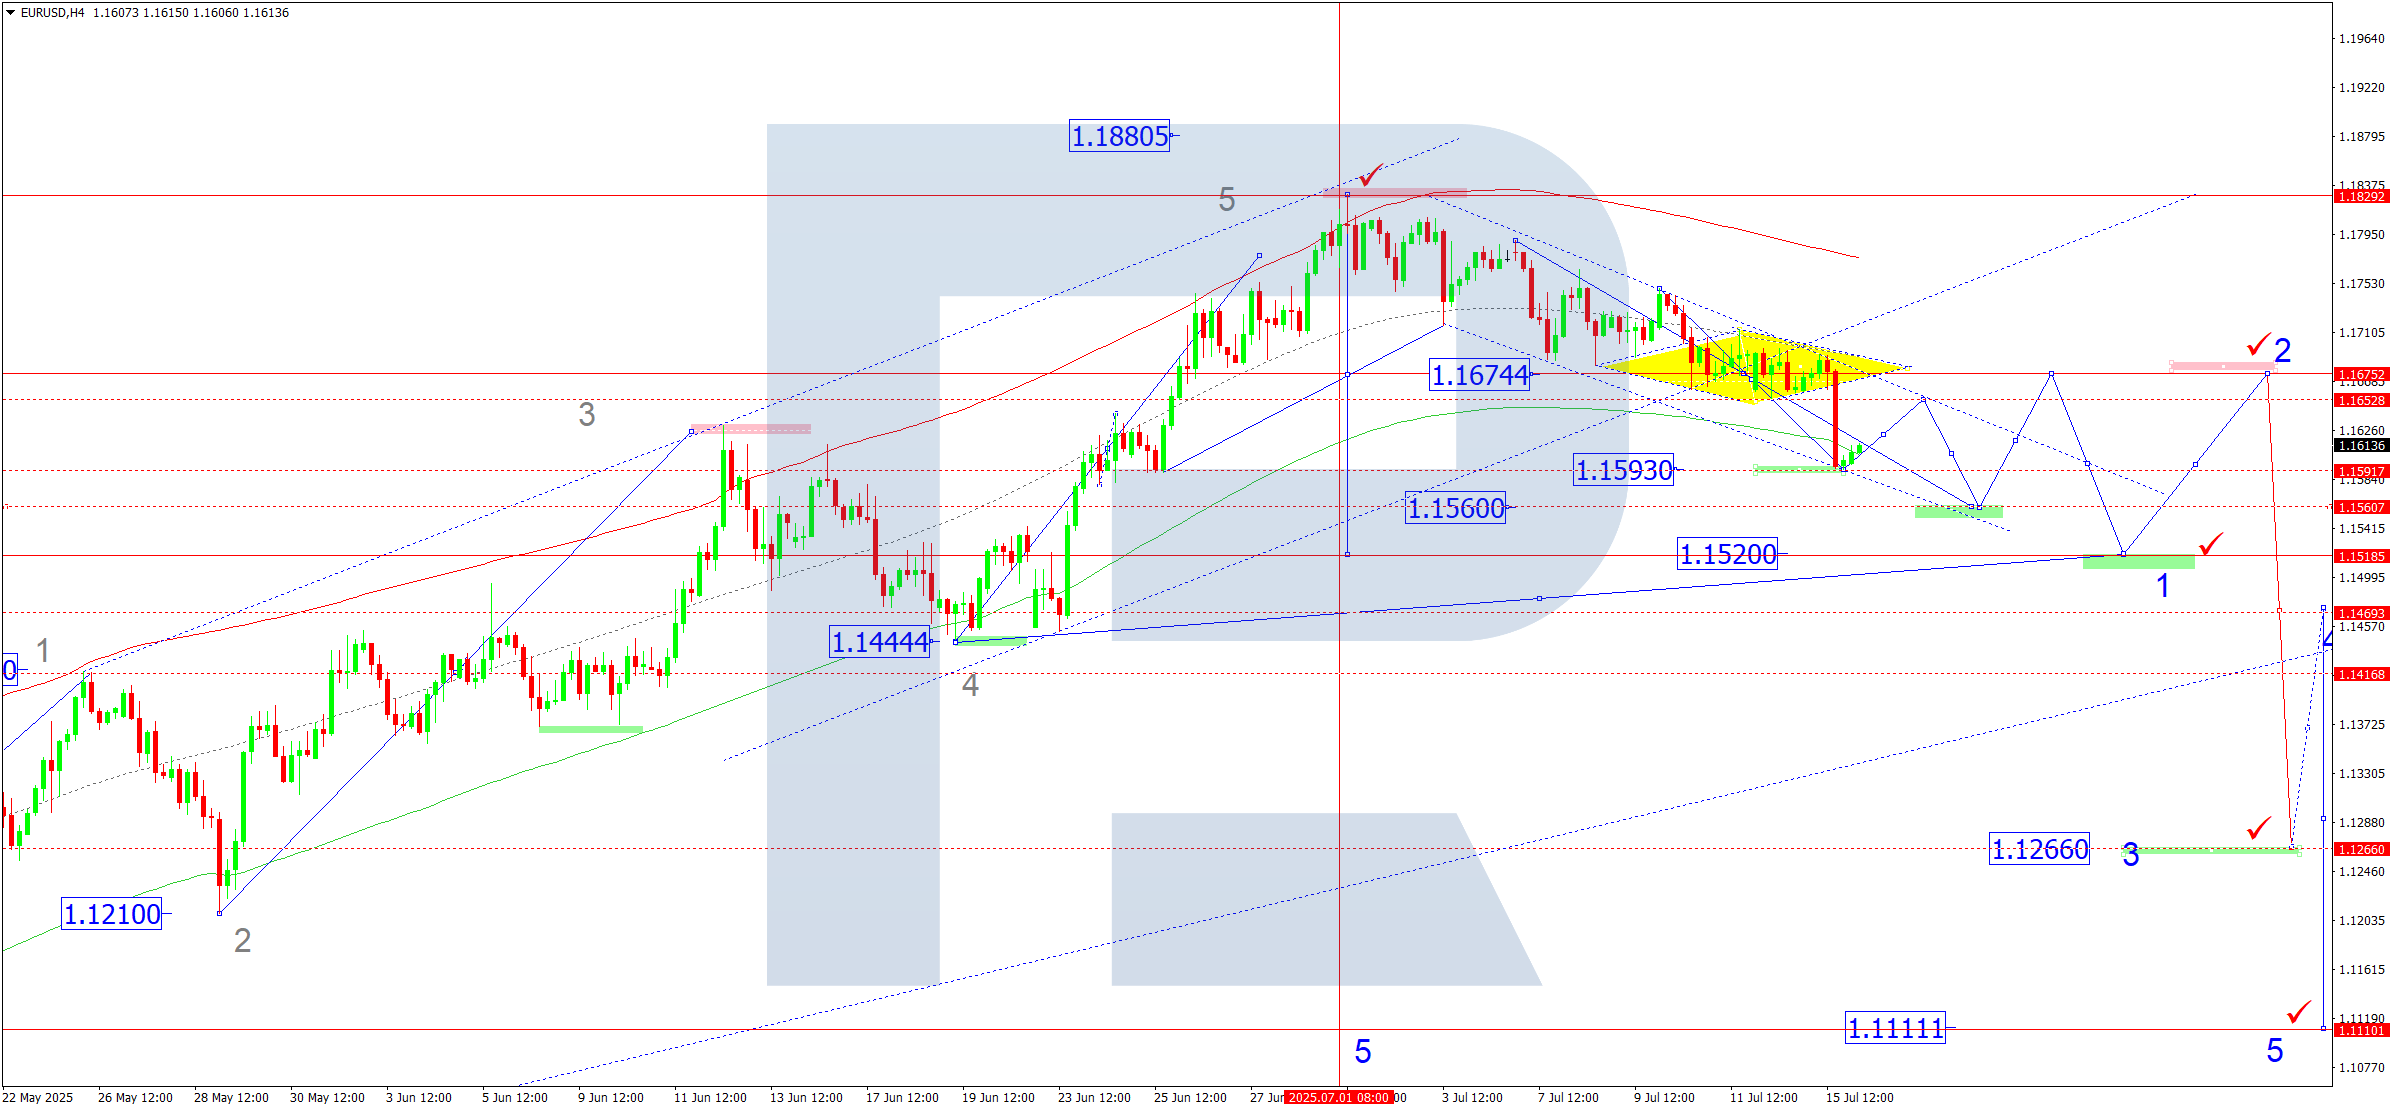
On the H4 chart of EURUSD, the market broke out of the consolidation range downwards. With the breakout below 1.1650, a potential opened for the downward wave to extend to 1.1520. Today, 16 July 2025, a continuation of the decline to 1.1560 is possible. After reaching this level, a growth leg towards 1.1650 may follow.
Technically, this scenario is supported by the Elliott wave structure and the downward wave matrix with a pivot point at 1.1675. This remains the key point in the EURUSD wave structure. Today, the market continues its decline towards the lower boundary of the price Envelope at 1.1560. Afterwards, a growth wave towards its central line at 1.1675 is expected.
Technical indicators for today’s EURUSD forecast suggest a further decline towards 1.1560.
USDJPY forecast
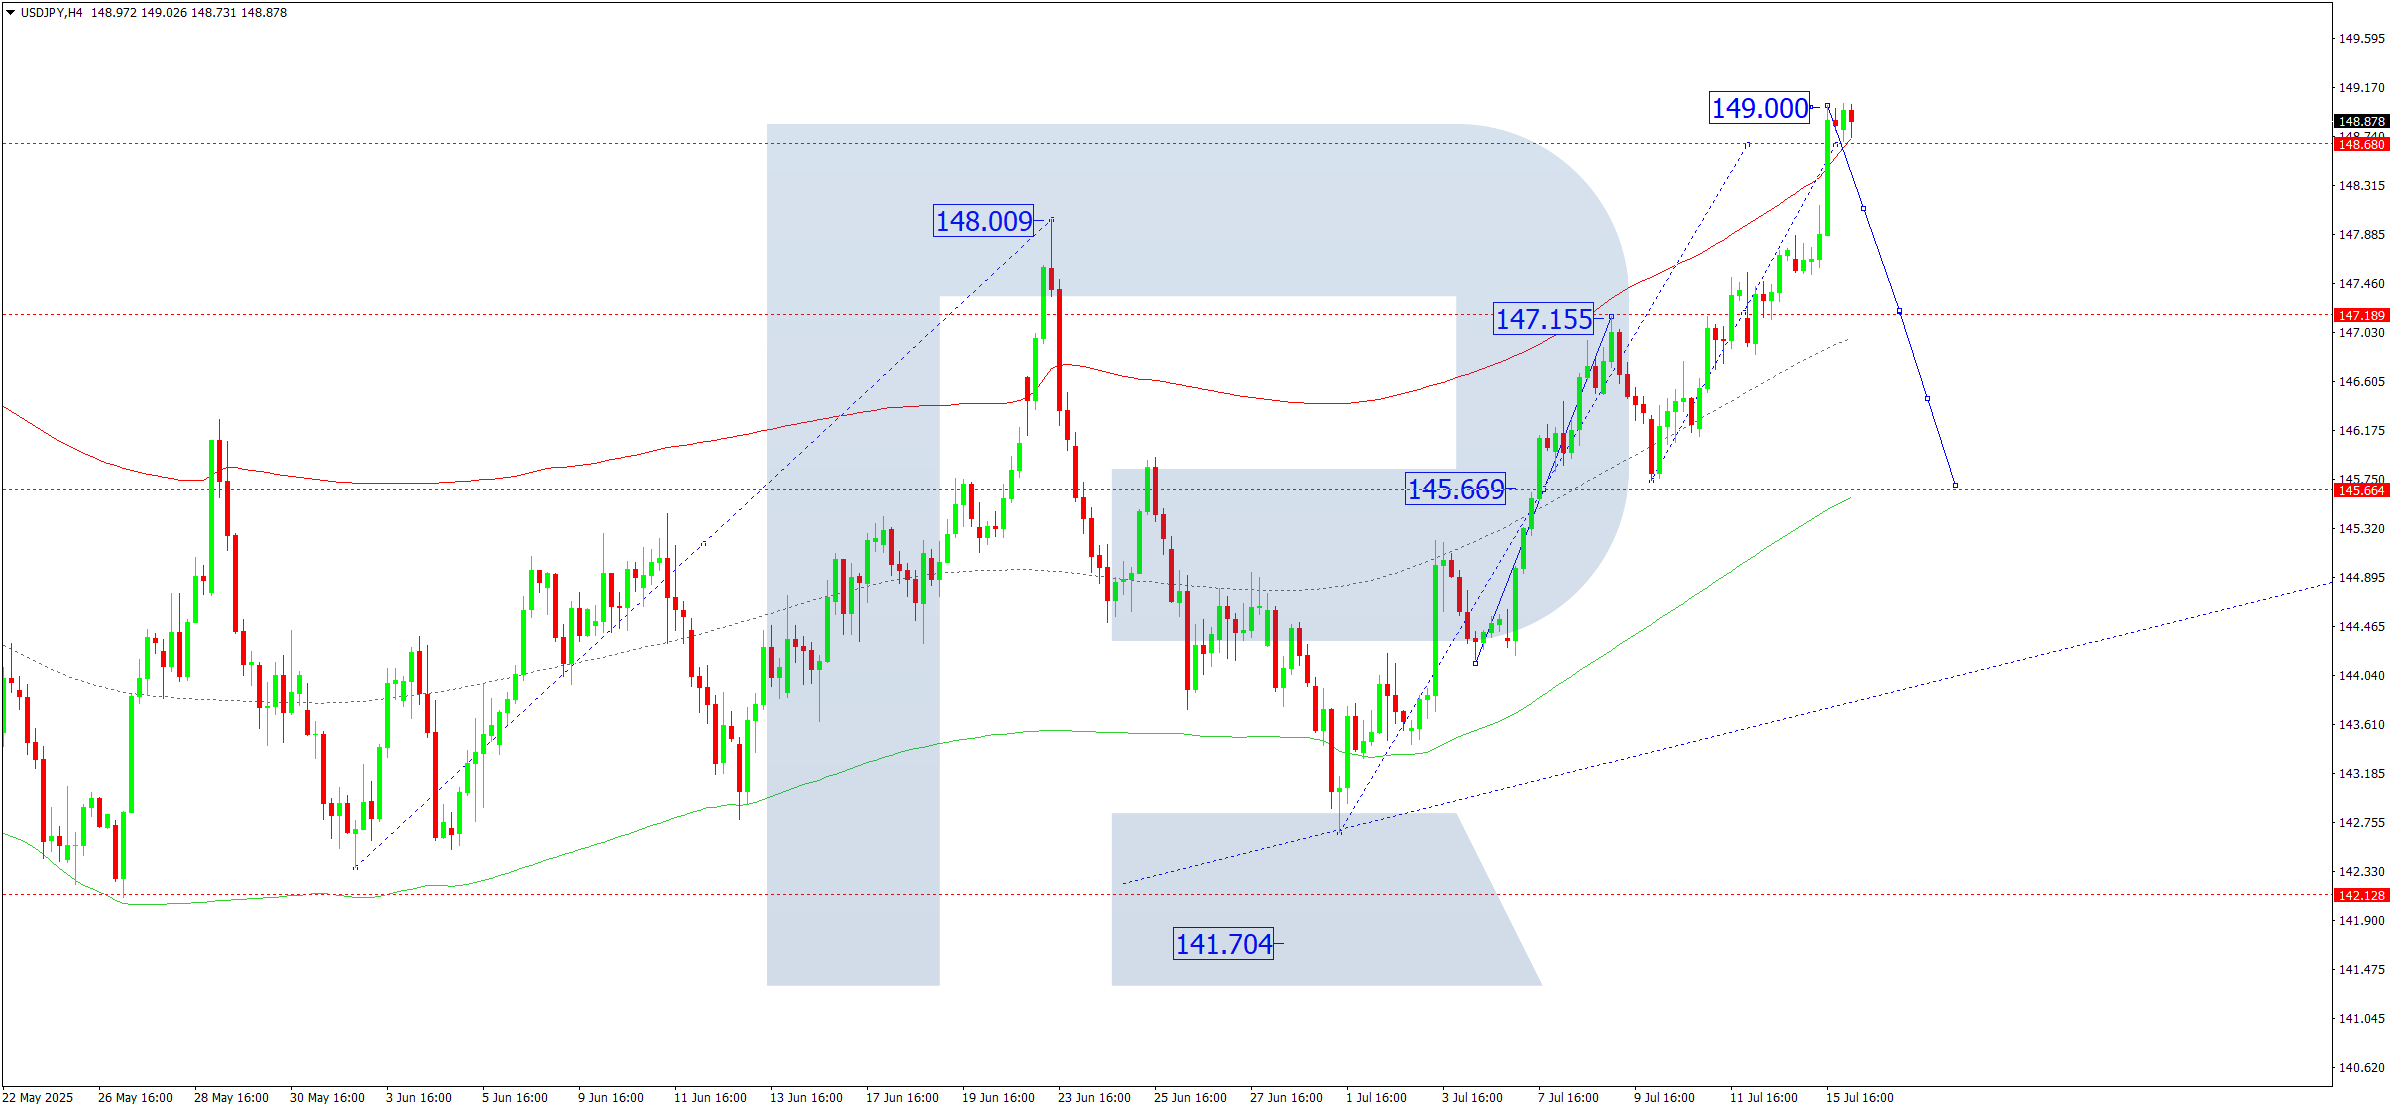
On the H4 chart of USDJPY, the market completed a growth wave towards 149.00. Today, 16 July 2025, a consolidation range is expected to form around this level. If the price breaks upwards, the growth wave may stretch towards 149.80. If it breaks downwards, a correction towards 147.17 is possible.
Technically, this scenario for USDJPY is confirmed by the Elliott wave structure and the growth wave matrix with a pivot point at 145.66. This remains key in the current wave structure. At present, the market completed a wave towards the upper boundary of the price Envelope at 149.00. A downward leg towards its central line at 147.17 may follow.
Technical indicators for today’s USDJPY forecast suggest a continuation of the growth wave towards 149.80.
GBPUSD forecast
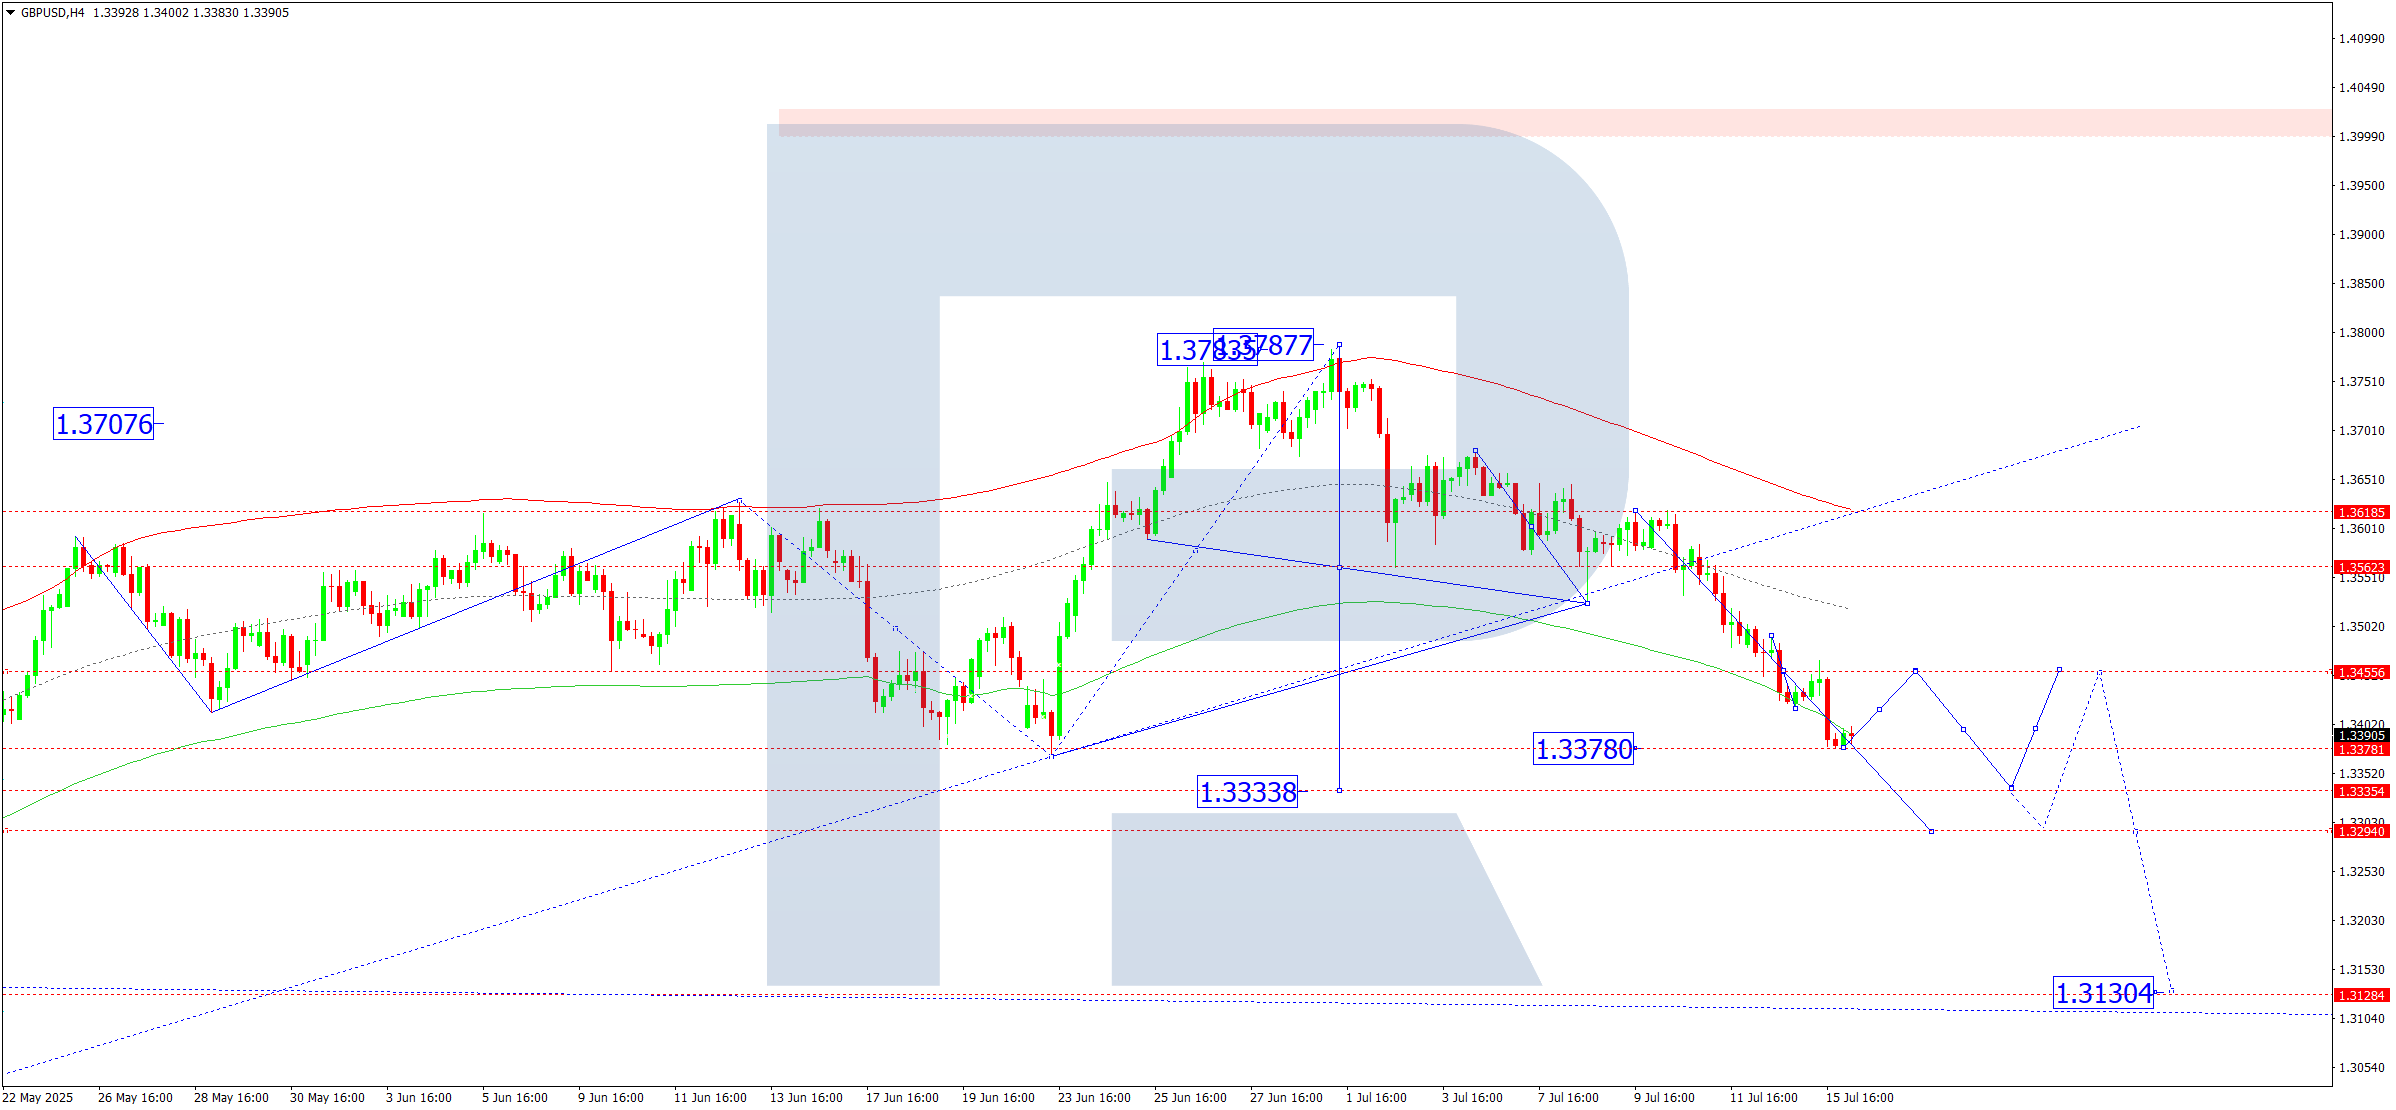
On the H4 chart of GBPUSD, the market completed a downward wave towards 1.3378. Today, 16 July 2025, a consolidation range is expected to form around this level. If the price breaks upwards, a correction towards 1.3455 is possible. If it breaks downwards, the trend may continue towards 1.3333.
Technically, this scenario for GBPUSD is confirmed by the Elliott wave structure and the downward wave matrix with a pivot point at 1.3560. This remains key in the current wave structure. At present, the market completed a wave to the price Envelope’s lower boundary at 1.3378. A correction towards the central line at 1.3560 may follow, then a continuation of the wave towards the lower boundary at 1.3333 is possible.
Technical indicators for today’s GBPUSD forecast suggest a decline towards 1.3333.
AUDUSD forecast
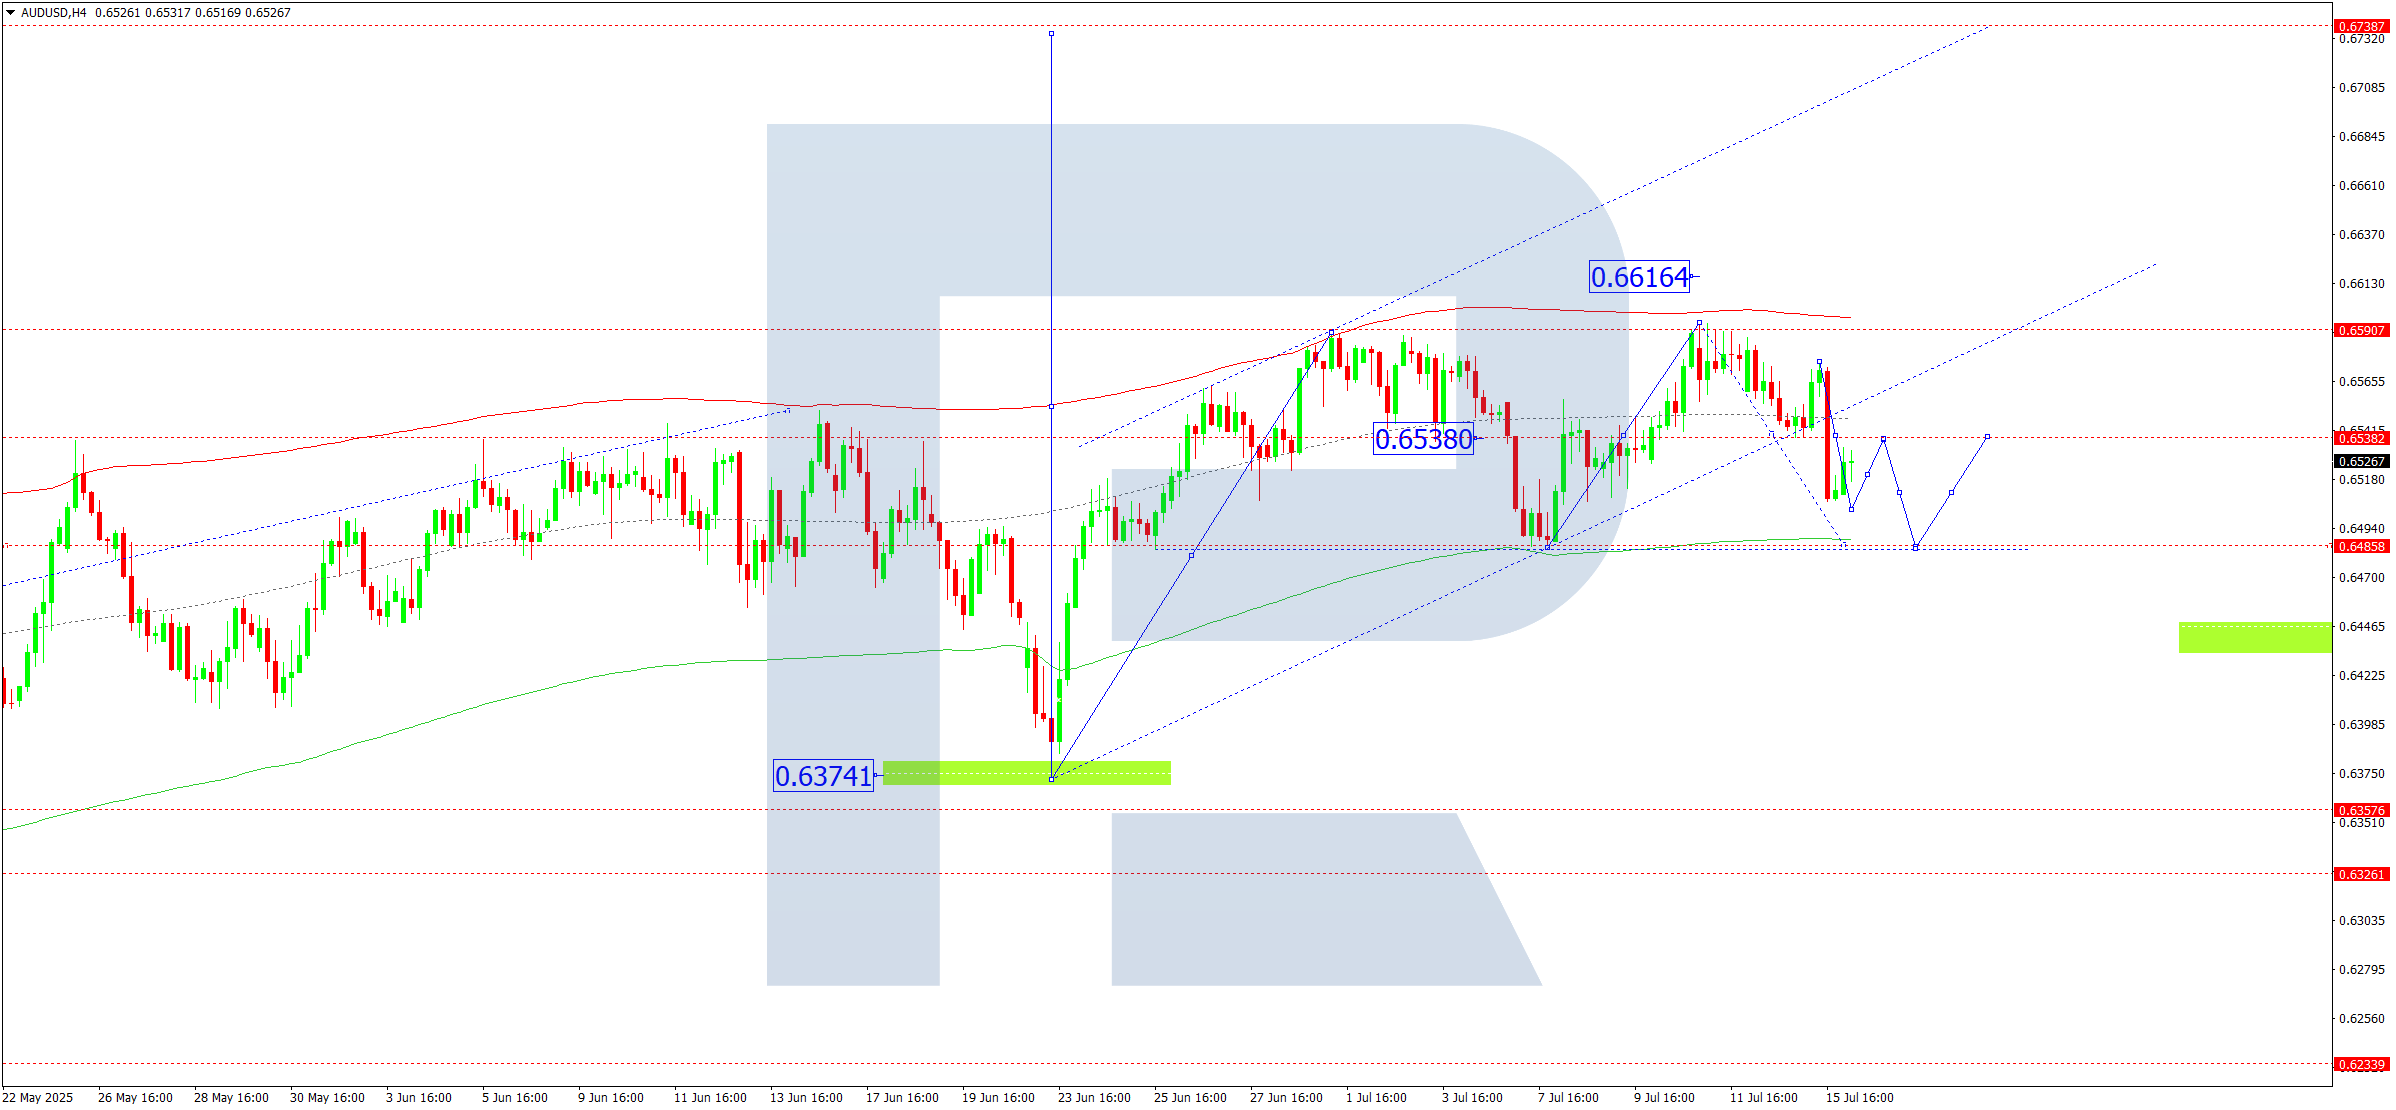
On the H4 chart of AUDUSD, the market broke below 0.6538. The potential is now open for a further decline towards 0.6488. Today, 16 July 2025, the market is expected to reach this target level. Afterwards, a correction towards 0.6538 may follow.
Technically, this scenario is supported by the Elliott wave structure and the growth wave matrix for AUDUSD with a pivot point at 0.6538. This remains key in this wave’s structure. At present, the market is moving towards the price Envelope’s lower boundary at 0.6488. Afterwards, a correction towards its central line at 0.6538 is possible.
Technical indicators for today’s AUDUSD forecast suggest a continuation of the downward wave towards 0.6488.
USDCAD forecast
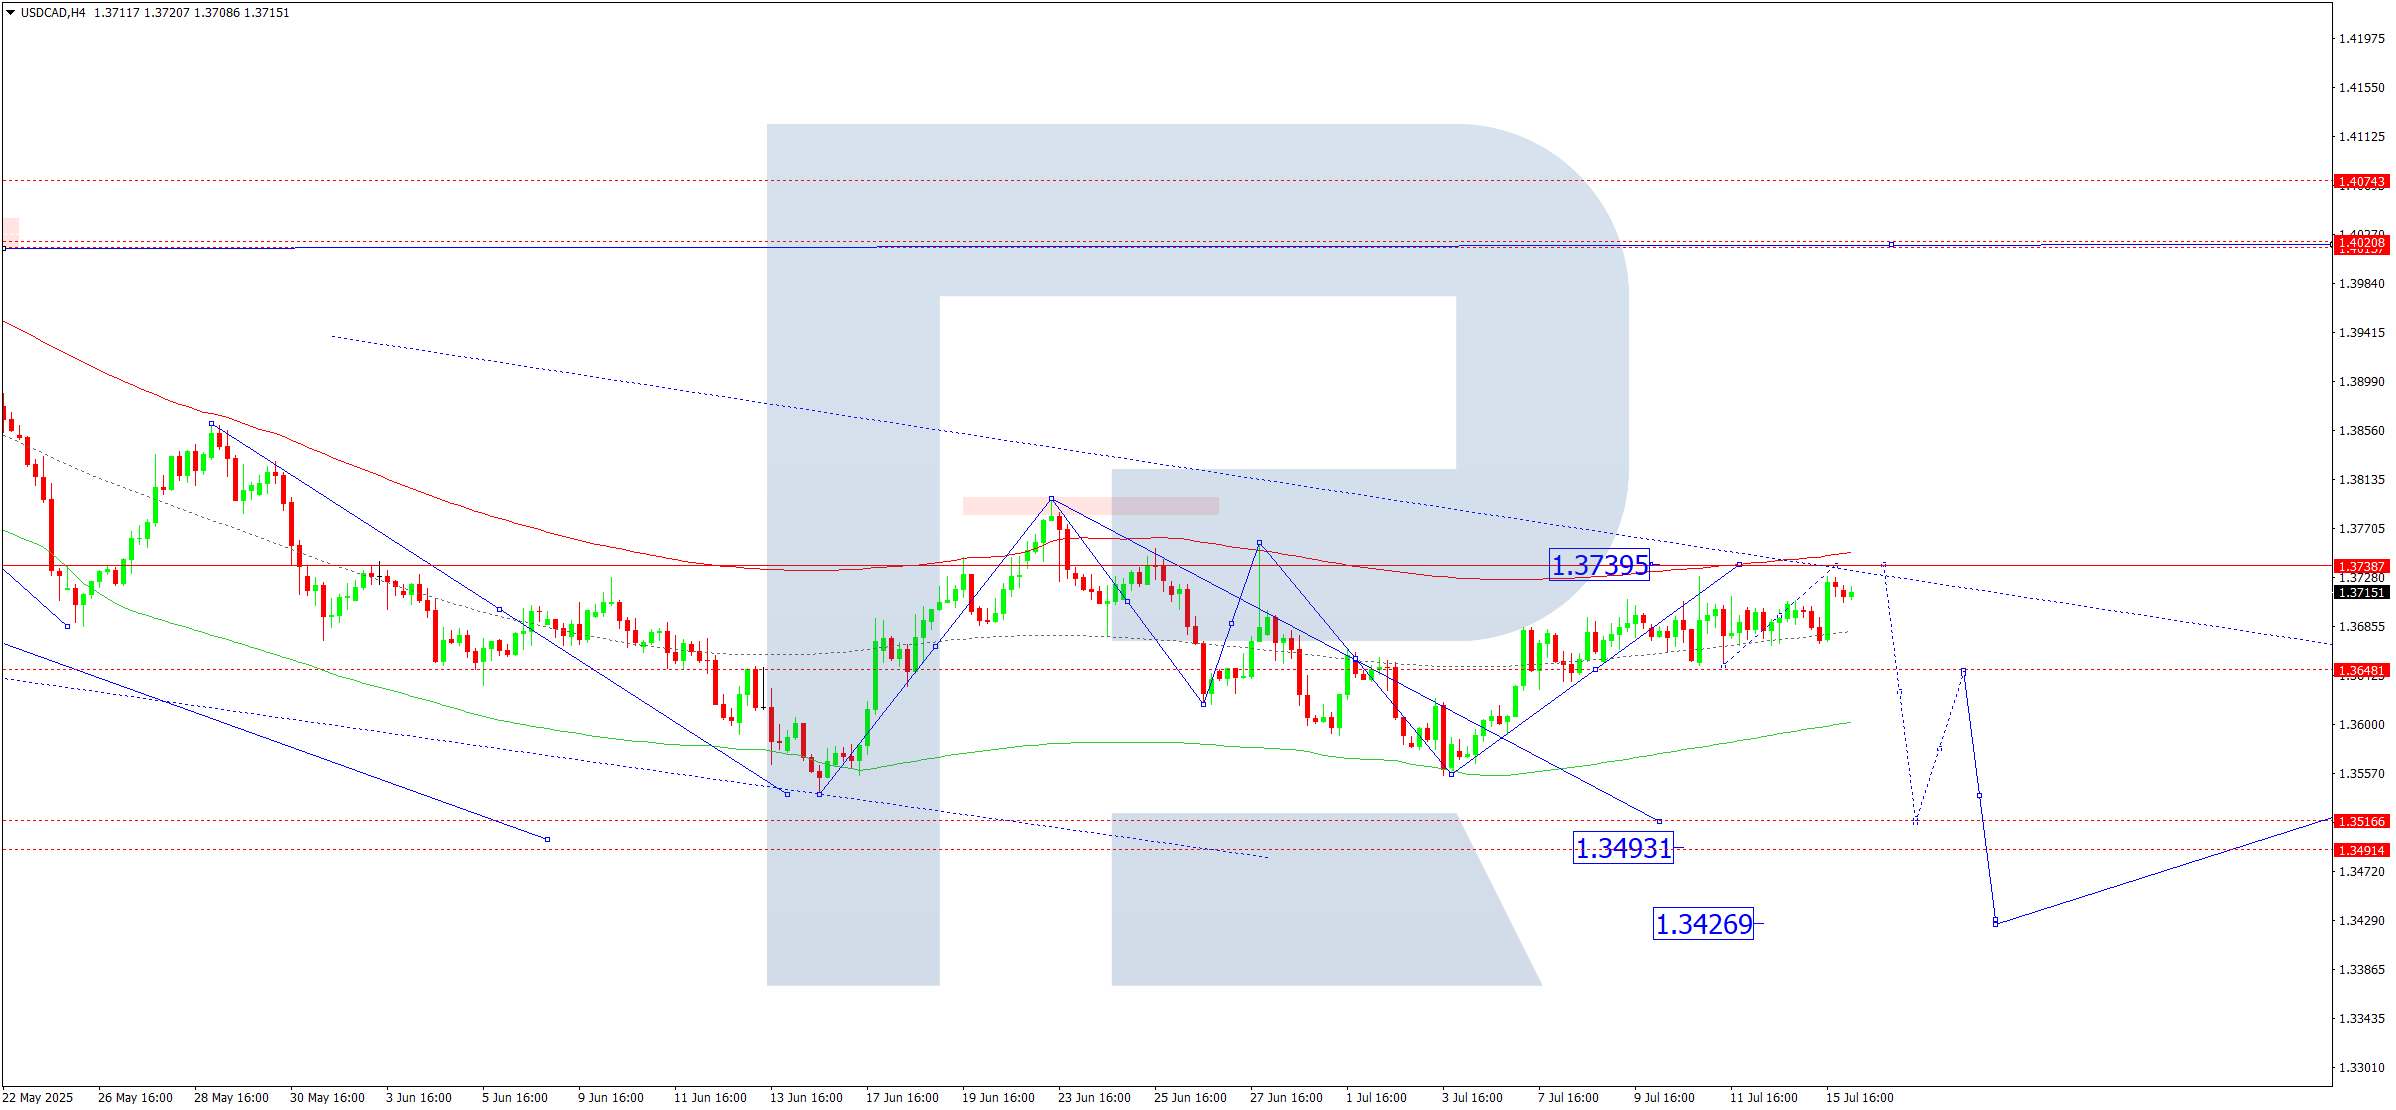
On the H4 chart of USDCAD, the market continues its growth wave towards 1.3737. Today, 16 July 2025, the price is expected to reach this target and then start a downward wave towards 1.3640. If the price breaks below this level, the trend may continue towards 1.3494.
Technically, this scenario is supported by the Elliott wave structure and the downward wave matrix with a pivot point at 1.3646. This remains key in the current wave structure for USDCAD. At present, the market is developing a consolidation range around the price Envelope’s central line at 1.3646. Today, a rise towards its upper boundary at 1.3737 and a decline towards its lower boundary at 1.3494 are possible.
Technical indicators for today’s USDCAD forecast suggest a decline towards 1.3494.
XAUUSD forecast
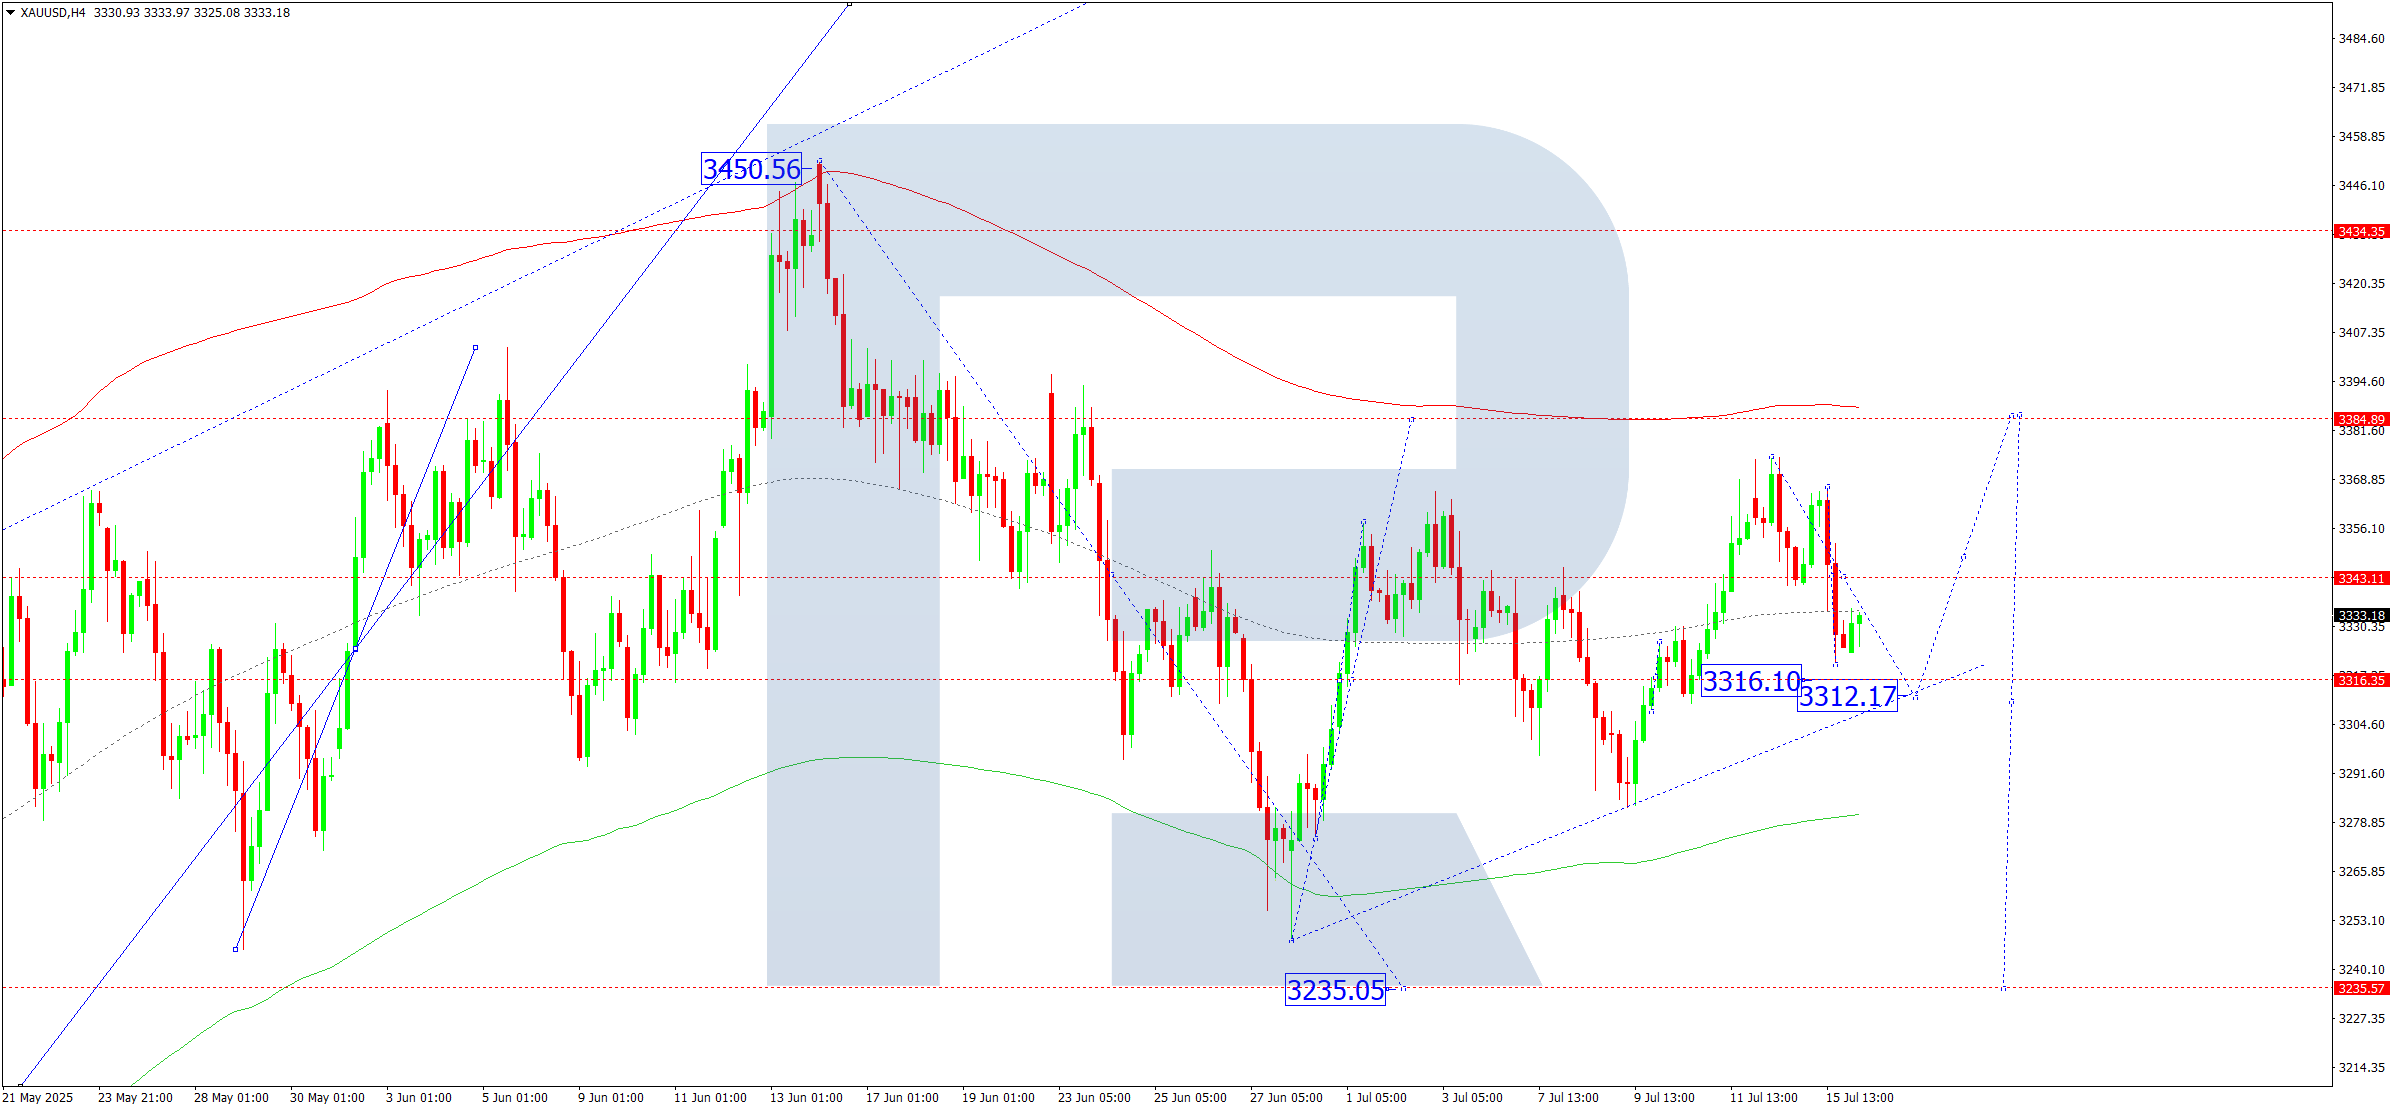
On the H4 chart of XAUUSD, the market broke below 3,340 and completed a downward wave to 3,320. Today, 16 July 2025, the price is expected to rise towards 3,344 (testing from below). Afterwards, a decline towards 3,312 is possible. The market continues to form a broad consolidation range around 3,344.
Technically, this scenario is supported by the Elliott wave structure and the growth wave matrix with a pivot point at 3,344. This remains key in the current XAUUSD wave structure. At present, the market is forming a wave structure towards the price Envelope’s lower boundary at 3,312. Afterwards, a growth wave towards its central line at 3,344 is expected.
Technical indicators for today’s XAUUSD forecast point to a possible continuation of the downward wave towards 3,312.
Brent forecast
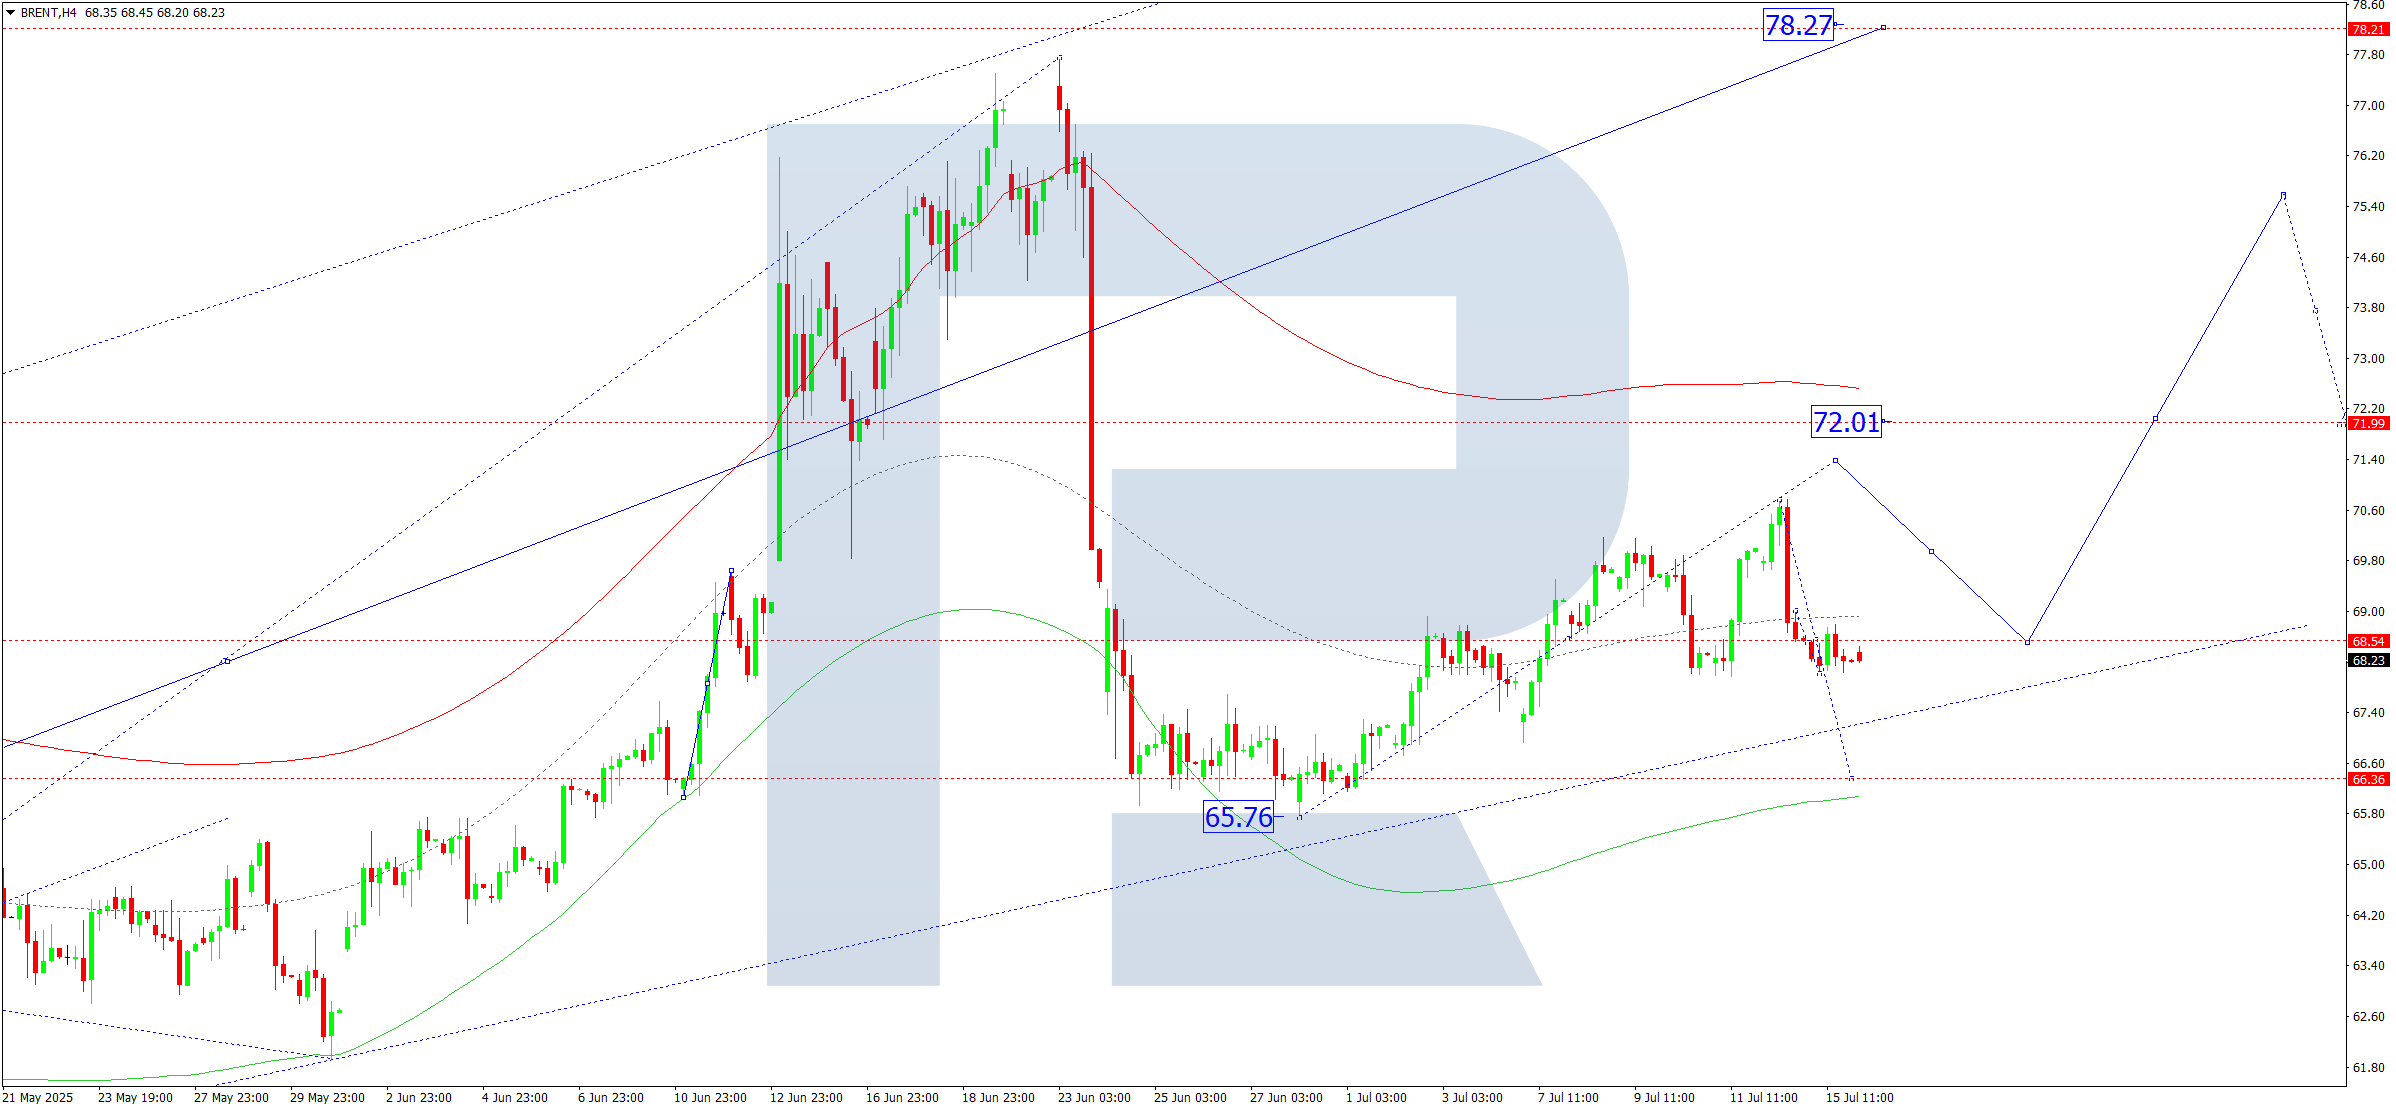
On the H4 chart of Brent crude, the market completed a correction wave towards 68.55. Today, 16 July 2025, a compact consolidation range is expected to form around this level. If the price breaks upwards, the trend may continue towards 72.00. If it breaks downwards, the correction may extend to 66.36. Afterwards, a new growth wave towards 73.00 is possible.
Technically, this scenario is supported by the Elliott wave structure and the growth wave matrix with a pivot point at 70.00. This remains key in the current wave structure for Brent. At present, the market is forming a consolidation range around the price Envelope’s central line at 69.50. A rise towards the upper boundary at 73.00 is relevant, while a decline to the lower boundary at 66.36 is also possible.
Technical indicators for today’s Brent forecast suggest a continuation of the growth wave towards 72.00.
Forecasts presented in this section only reflect the author’s private opinion and should not be considered as guidance for trading. RoboForex bears no responsibility for trading results based on trading recommendations described in these analytical reviews.