Daily technical analysis and forecast for 14 July 2025
Here is a detailed daily technical analysis and forecast for EURUSD, USDJPY, GBPUSD, AUDUSD, USDCAD, XAUUSD and Brent for 14 July 2025.
EURUSD forecast
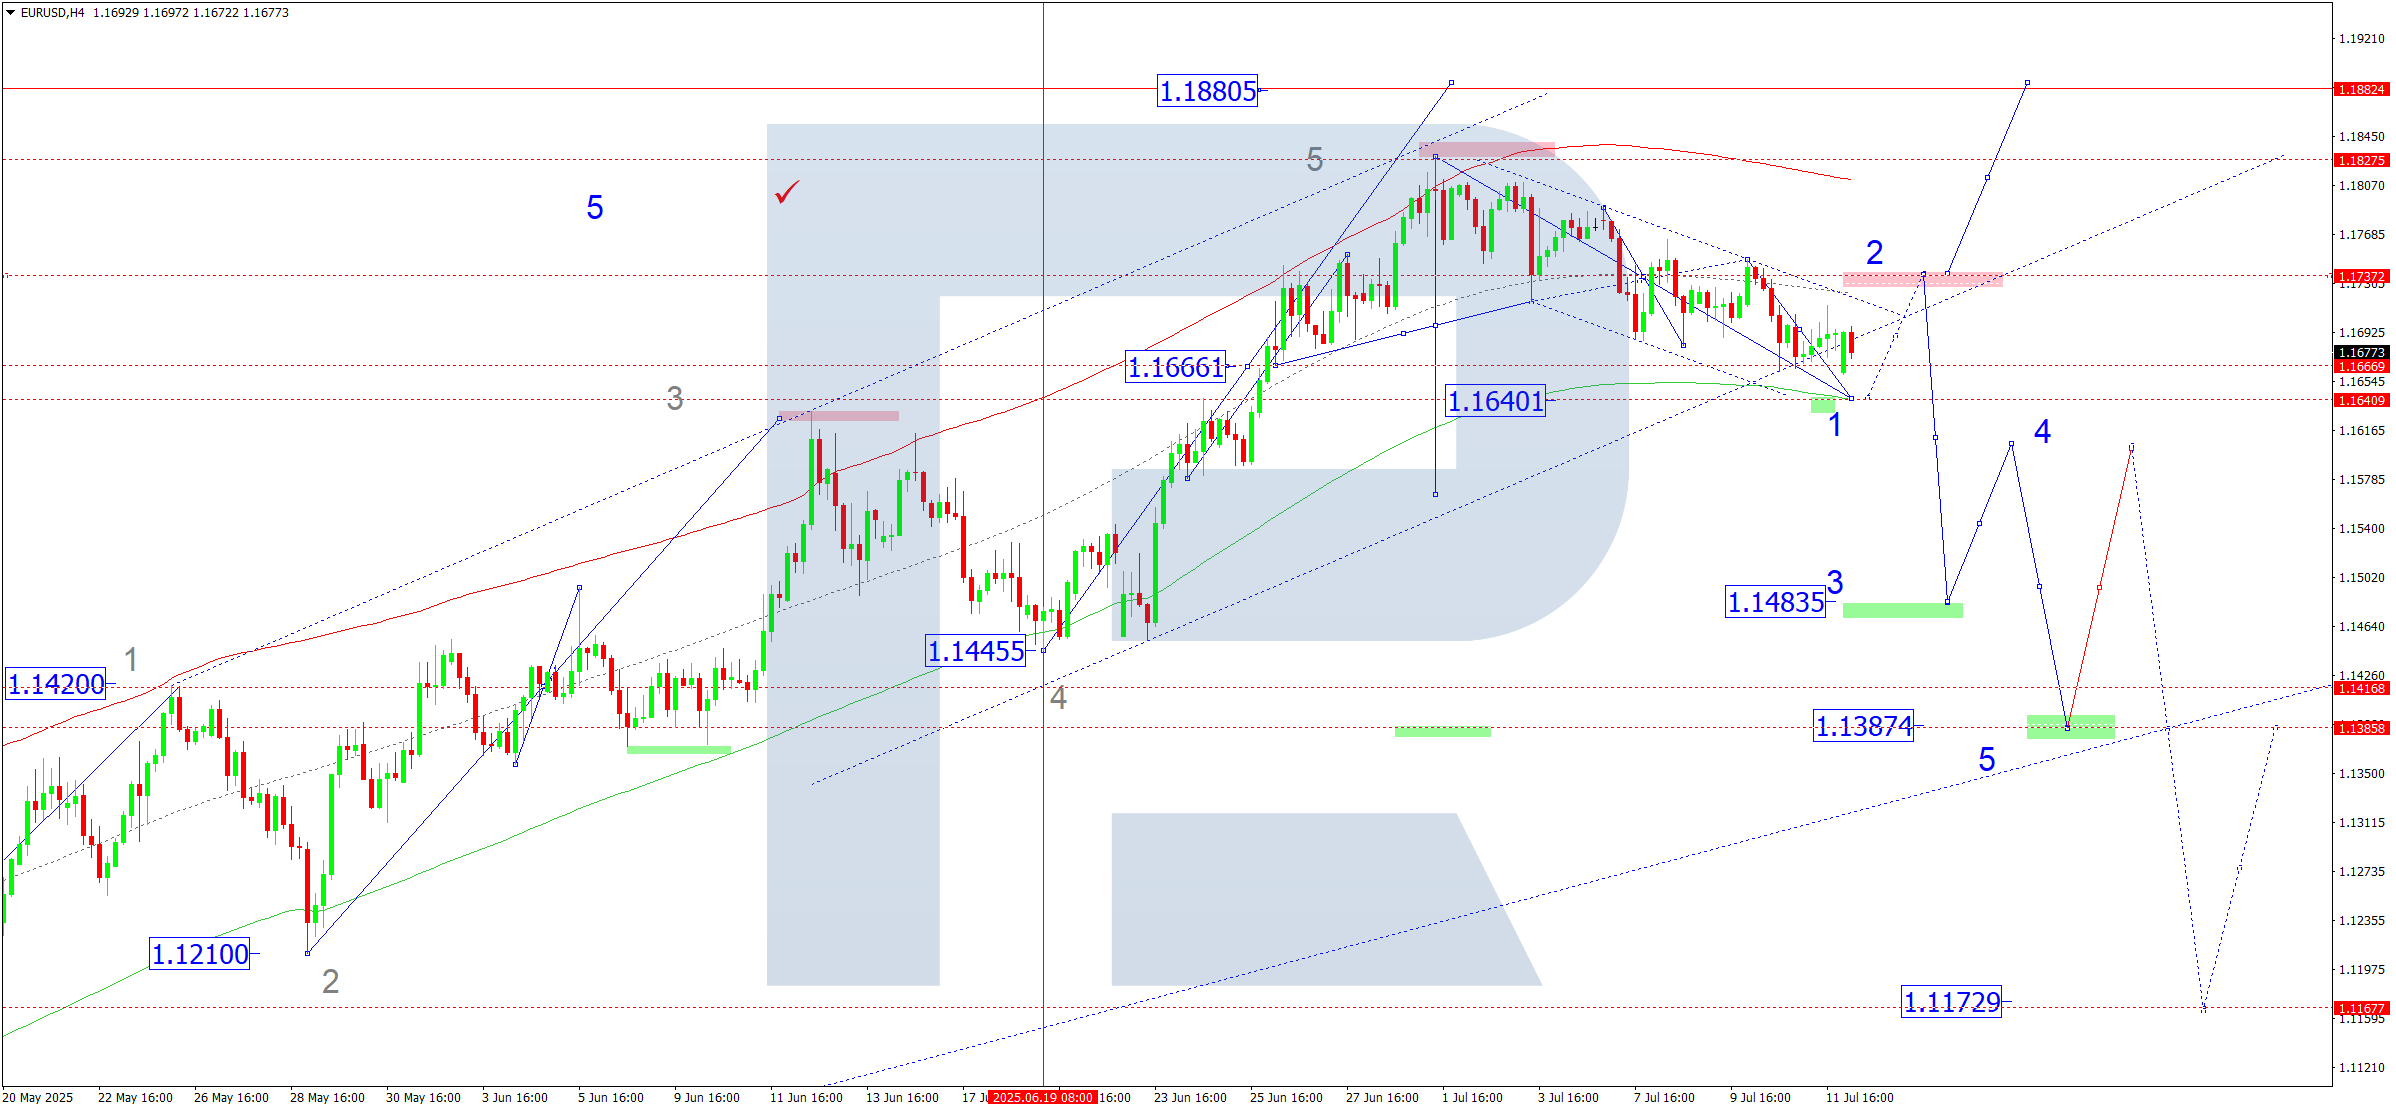
On the H4 chart of EURUSD, the market completed a downward wave to 1.1660 and a correction to 1.1694. Today, 14 July 2025, a continuation of the downward wave towards 1.1640 is possible. After reaching this level, the price could start rising towards 1.1737.
Technically, this scenario is confirmed by the Elliott wave structure and the downward wave matrix with a pivot point at 1.1735. This remains the key point within the EURUSD wave structure. Today, the market continues developing the downward structure towards the price Envelope’s lower boundary at 1.1640. A growth wave towards its central line at 1.1737 is then expected.
Technical indicators for today’s EURUSD forecast suggest a continued downward movement towards 1.1640.
USDJPY forecast
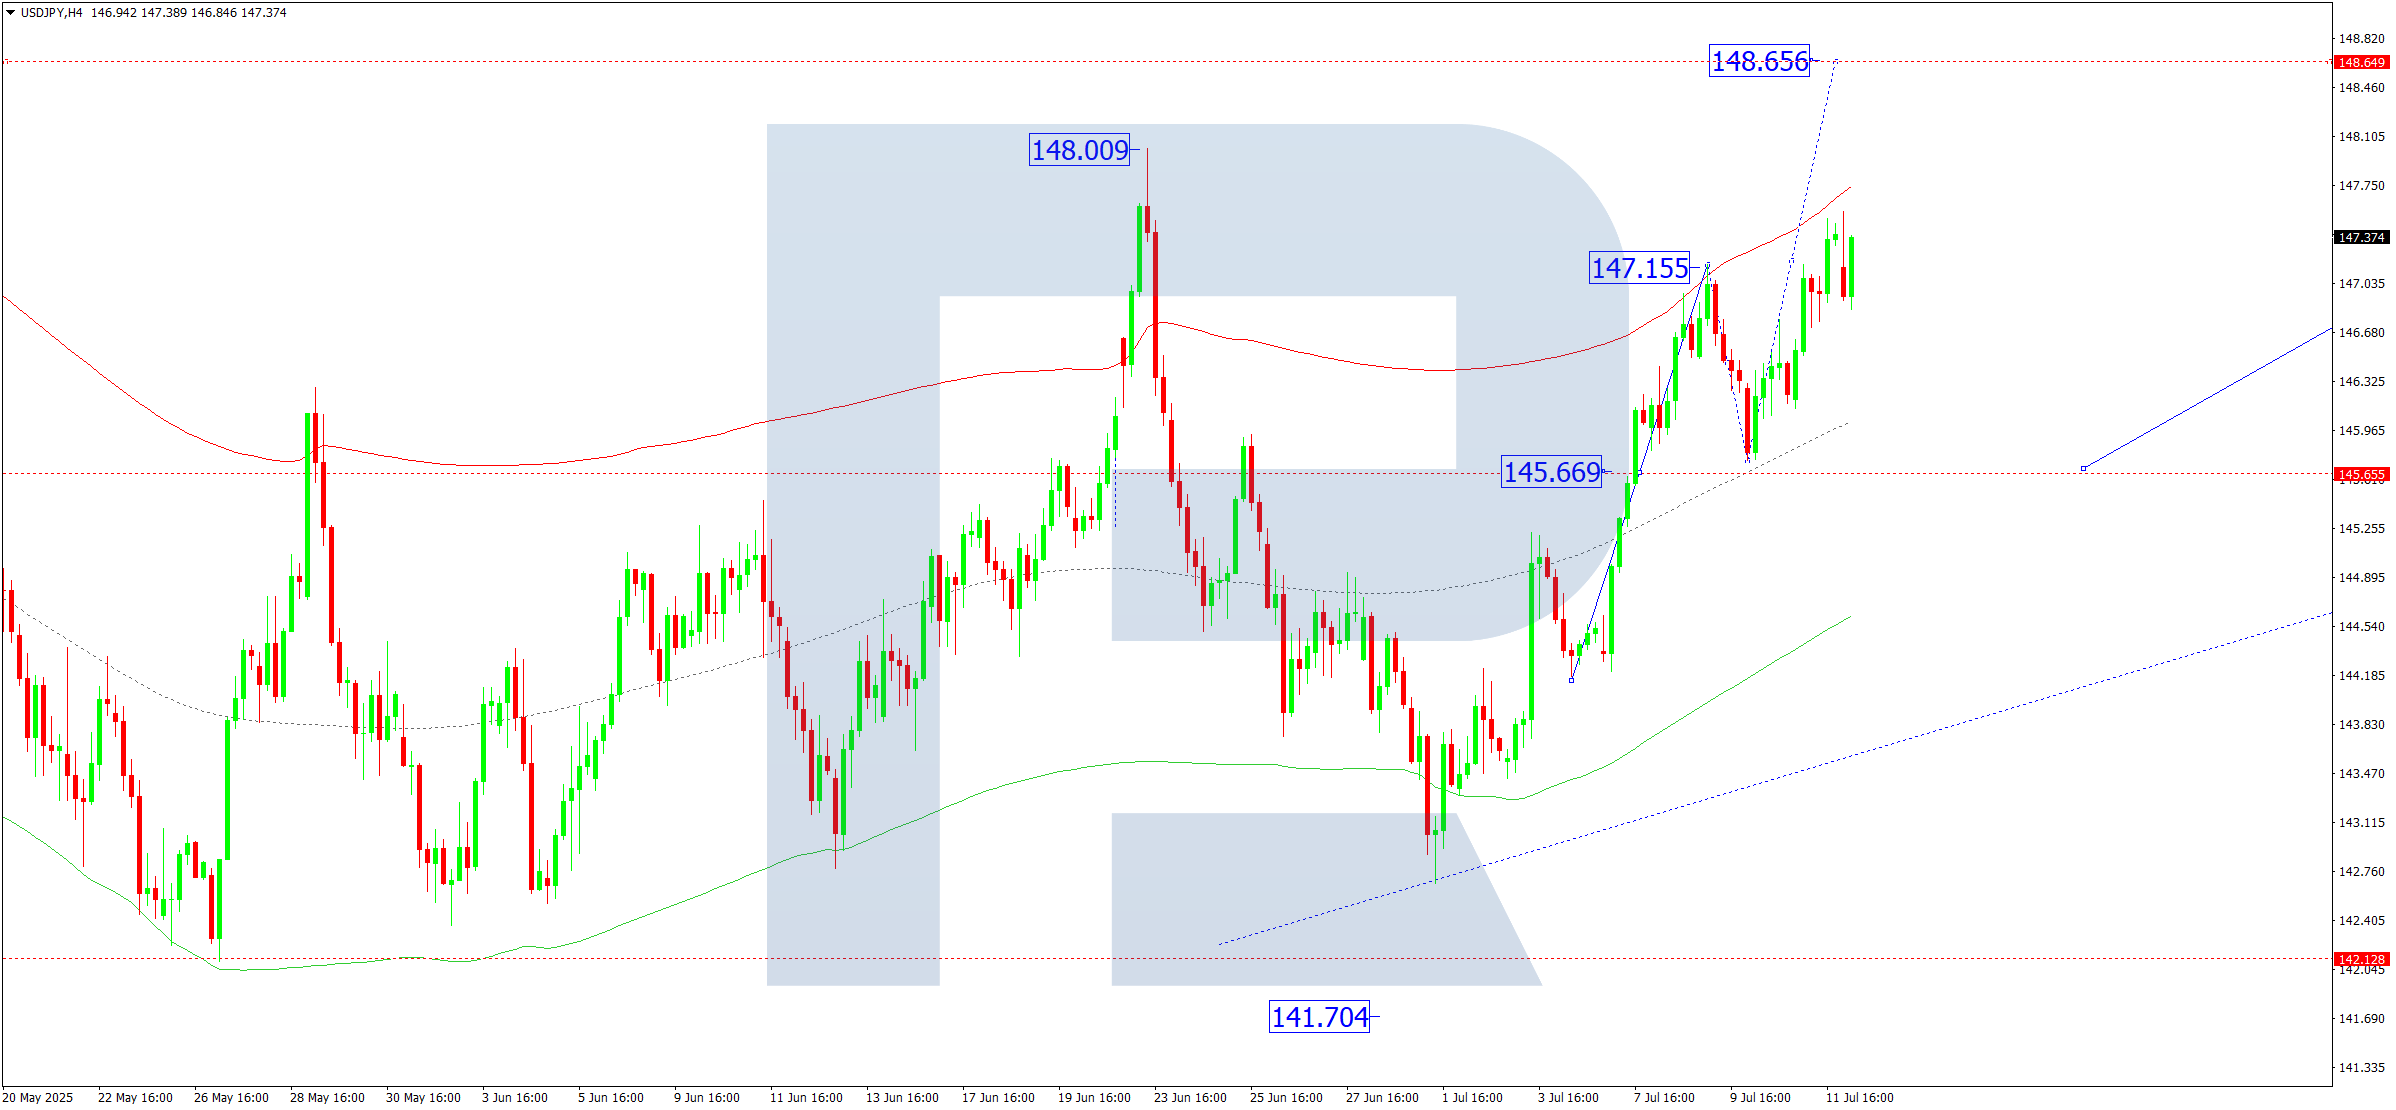
On the H4 chart of USDJPY, the market is forming a consolidation range around 147.17 without a clear trend. Today, 14 July 2025, an upward expansion of the range towards 148.65 is possible. Afterwards, we expect the start of a downward wave towards 145.66.
Technically, this scenario for USDJPY is confirmed by the Elliott wave structure and the growth wave matrix with a rotation centre at 145.66. This remains key in the structure of this wave. Currently, the market is forming a correction structure to the price Envelope’s upper boundary at 148.65. A decline towards its central line at 145.66 is possible, followed by growth to 147.16.
Technical indicators for today’s USDJPY forecast suggest further growth towards 148.65.
GBPUSD forecast
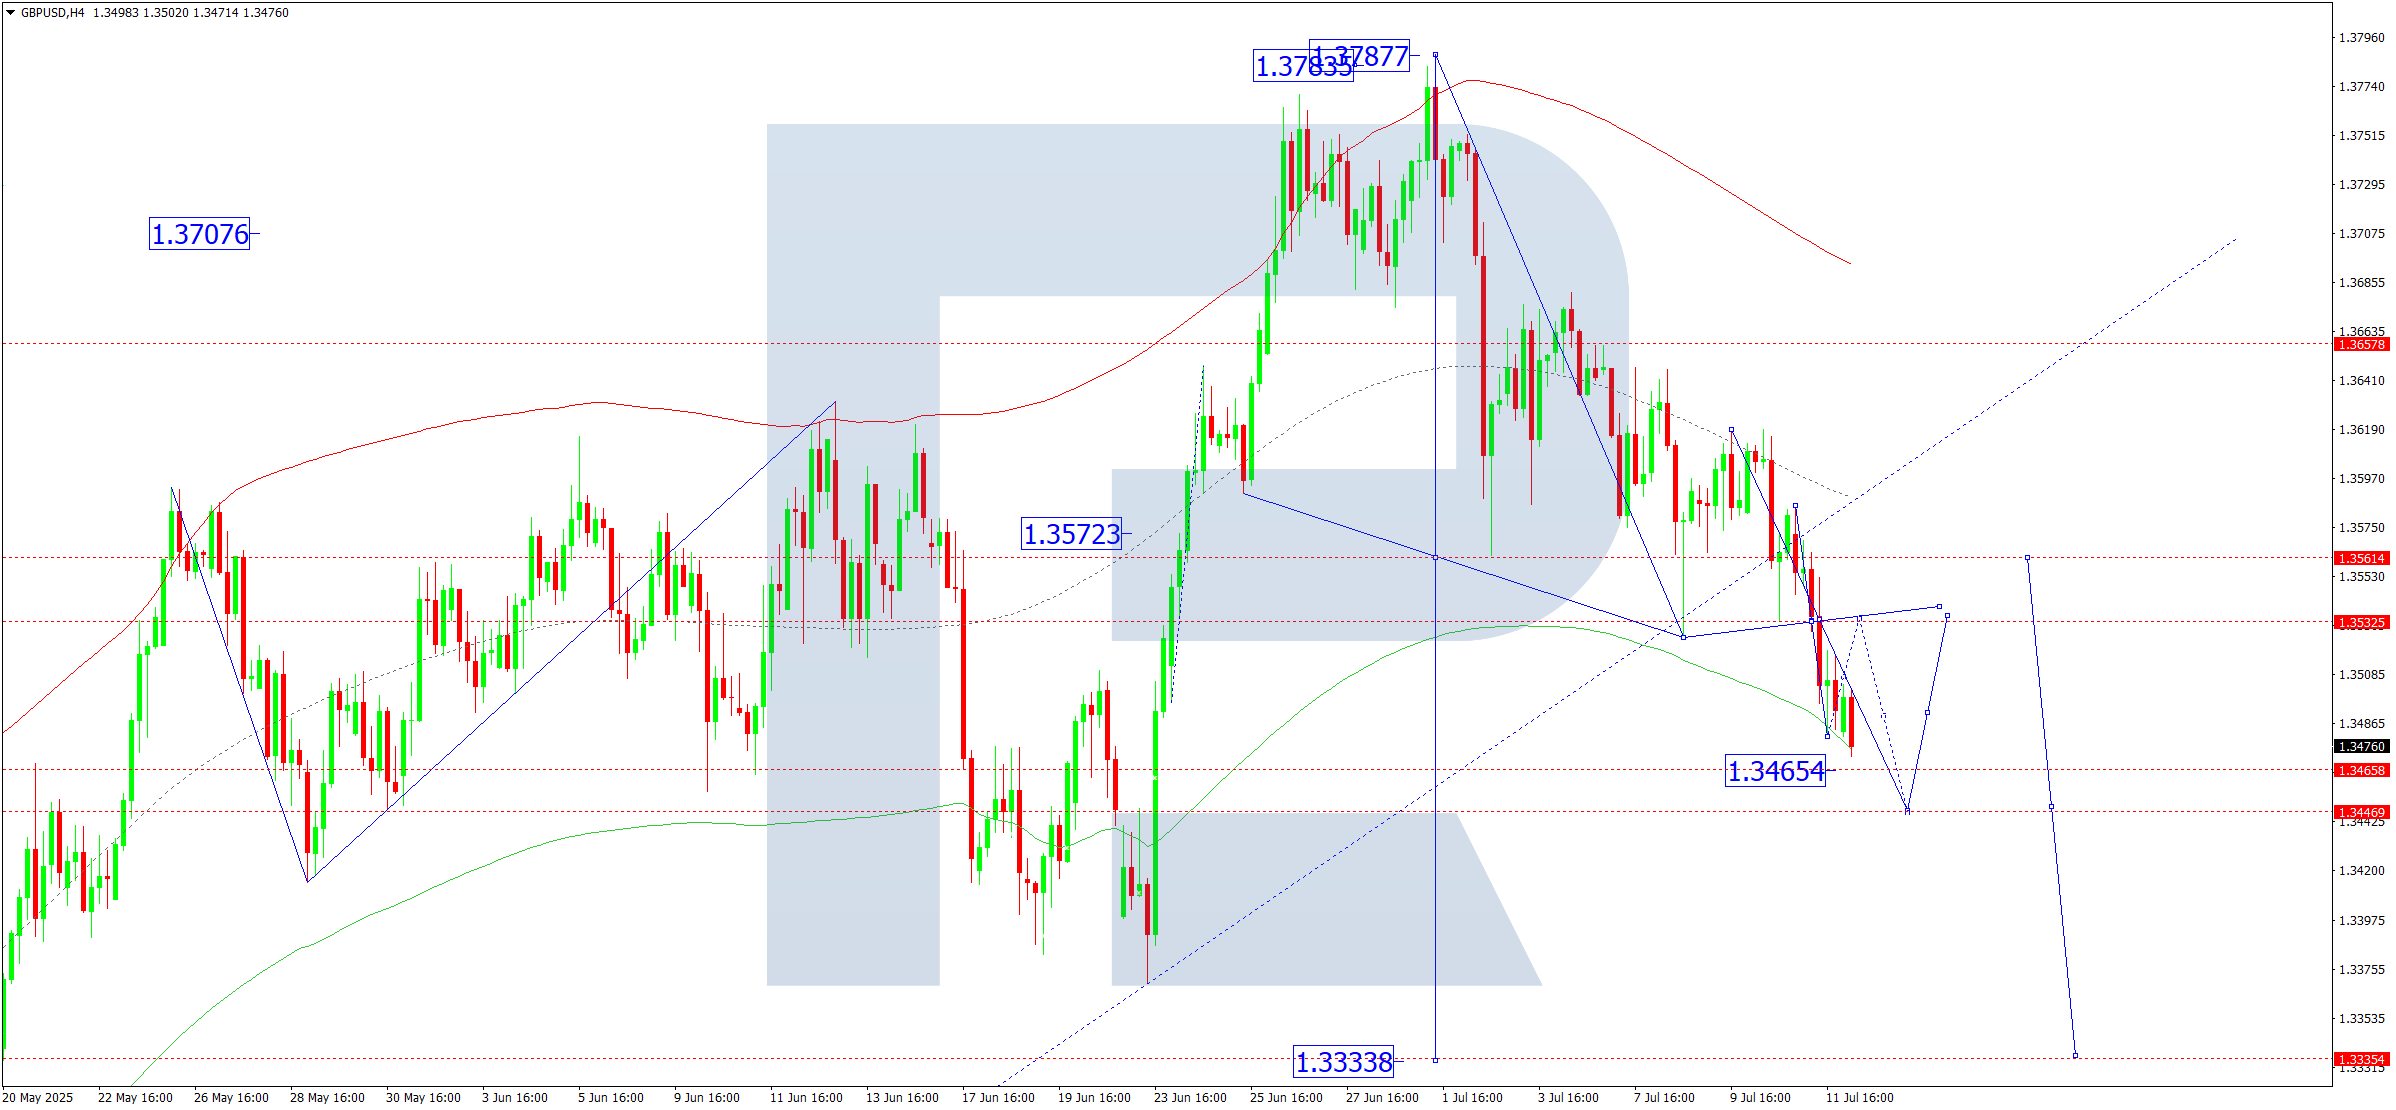
On the H4 chart of GBPUSD, the market updated last week's low. Today, 14 July 2025, the price is expected to decline towards 1.3444, with potential trend continuation to 1.3400 as a local target.
Technically, this scenario for GBPUSD is confirmed by the Elliott wave structure and the downward wave matrix with a rotation centre at 1.3535. This remains key in the structure of this wave. Currently, the market is under pressure towards the price Envelope’s lower boundary at 1.3444. A correction towards 1.3535 may follow. Then, a continuation of the wave towards 1.3333 is possible.
Technical indicators for today’s GBPUSD forecast suggest considering a decline towards 1.3444.
AUDUSD forecast
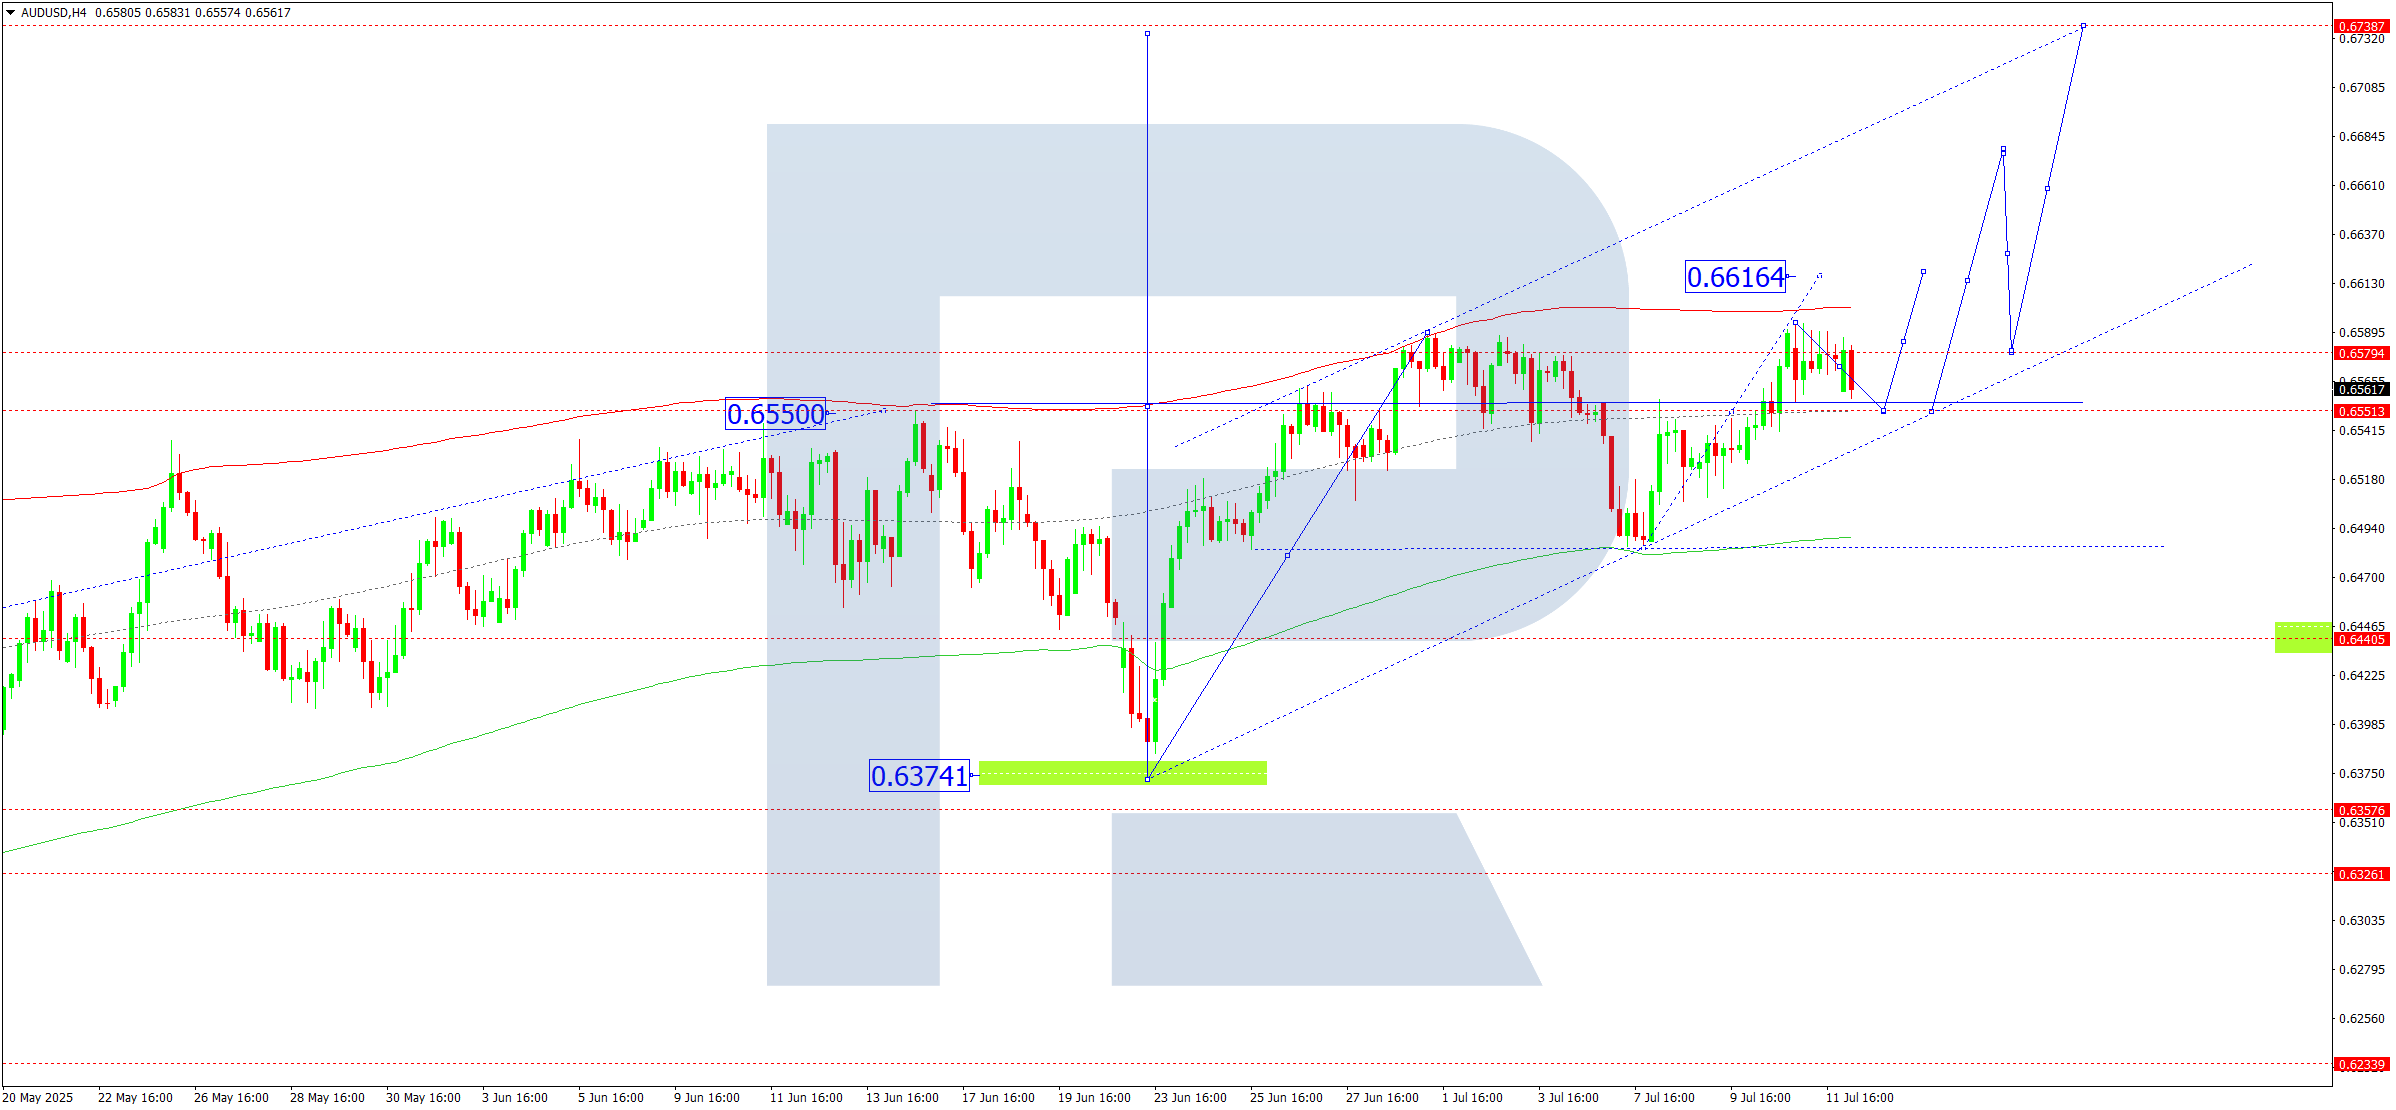
On the H4 chart of AUDUSD, the market formed a consolidation range around 0.6550 and broke upwards. Today, 14 July 2025, we expect a growth wave towards 0.6616 as a local target. After reaching this level, a correction towards 0.6550 is possible.
Technically, this scenario is confirmed by the Elliott wave structure and the growth wave matrix with a rotation centre at 0.6550. This remains key in the structure of this wave. Currently, the market is executing a growth wave towards the price Envelope’s upper boundary at 0.6616. Afterwards, a correction towards its central line at 0.6550 is possible.
Technical indicators for today’s AUDUSD forecast suggest a potential growth wave towards 0.6616.
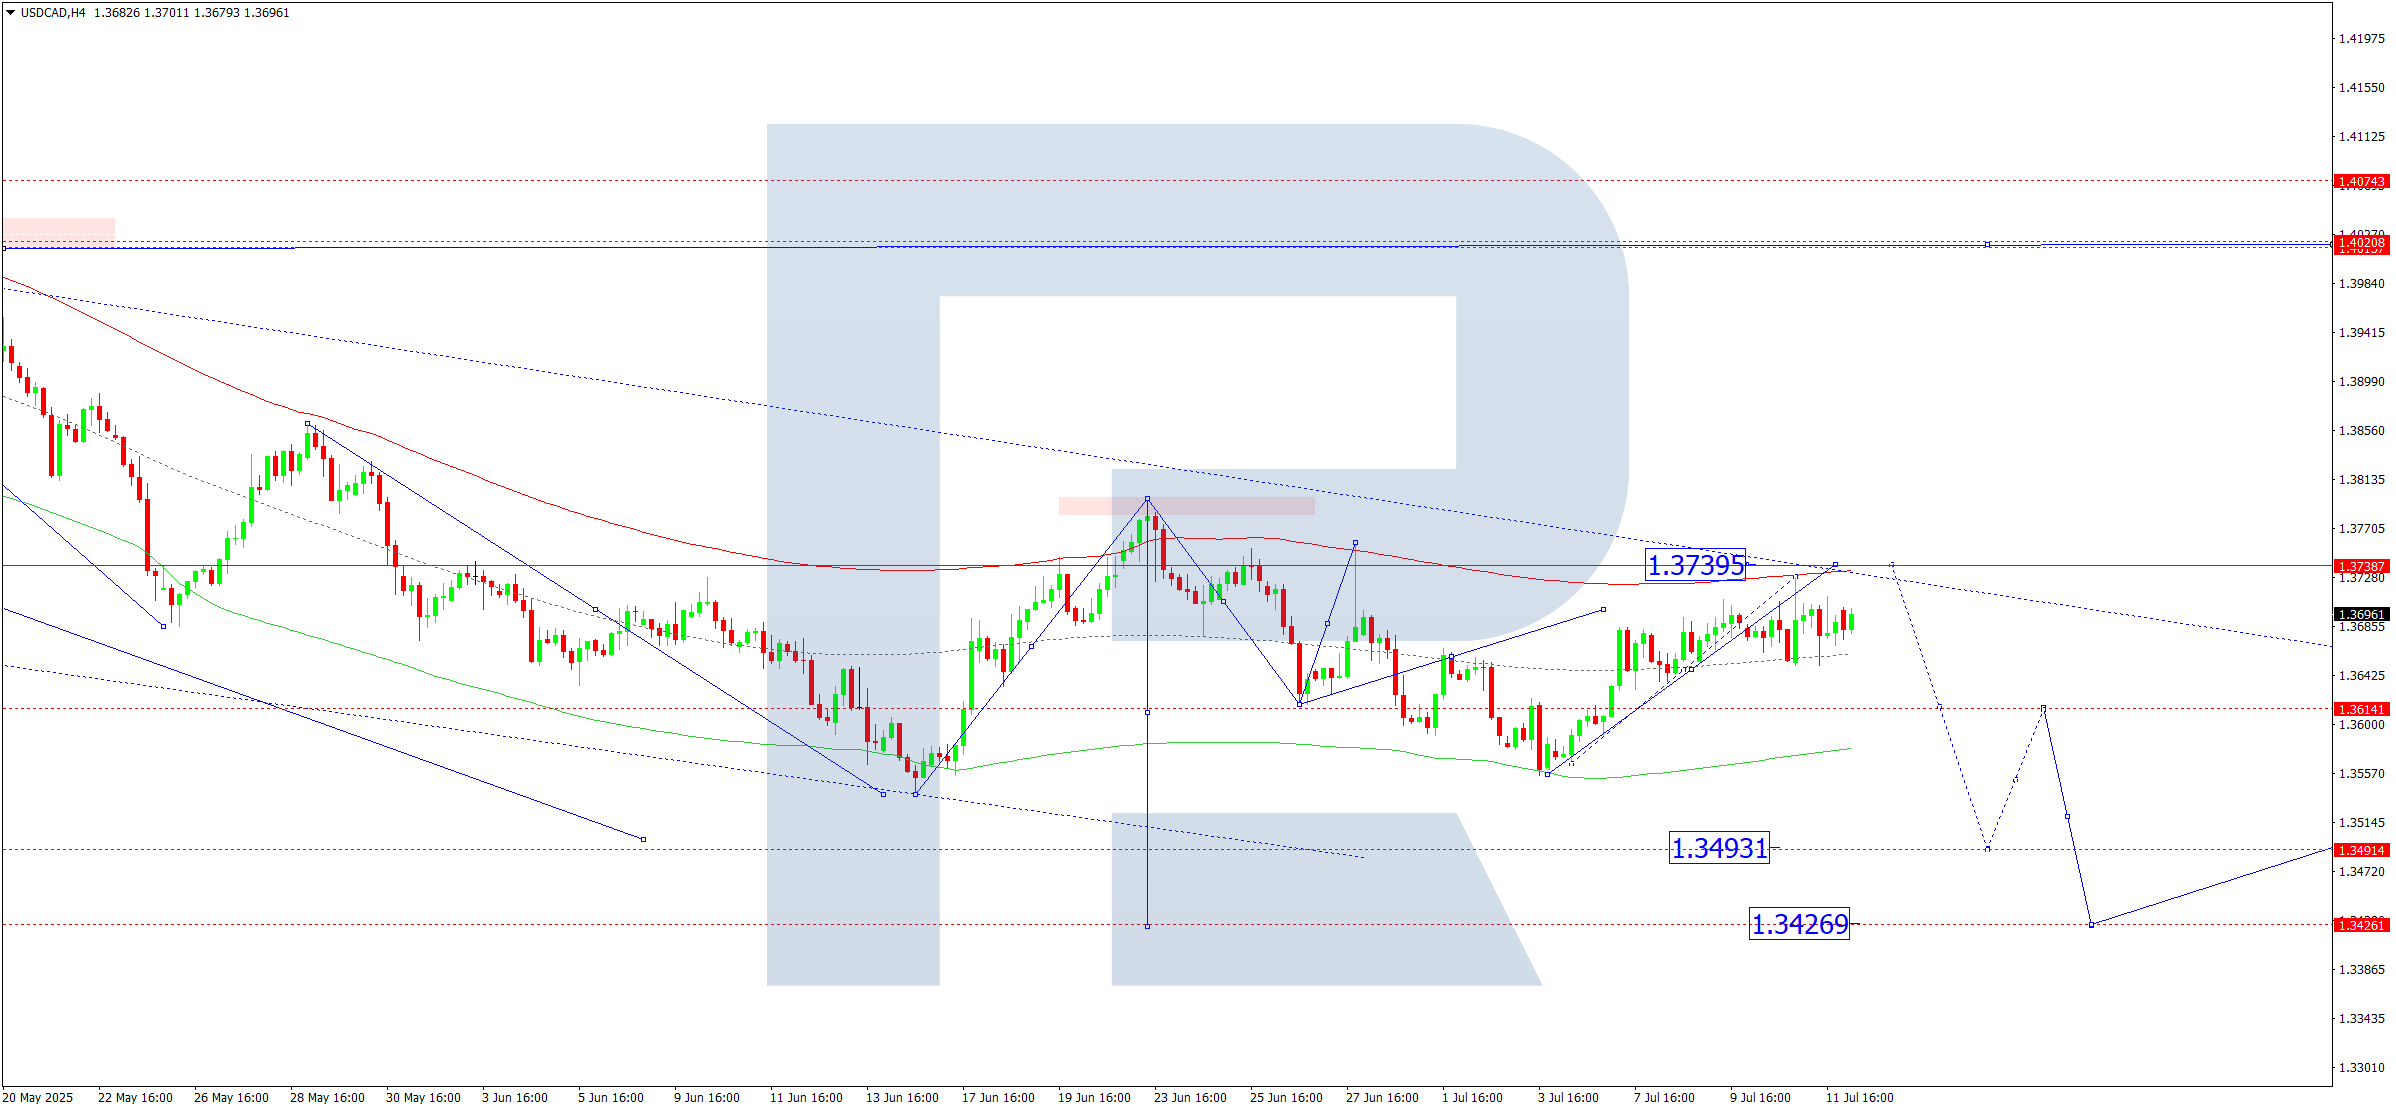
USDCAD forecast
On the H4 chart of USDCAD, the market continues its growth wave towards 1.3737. Today, 14 July 2025, the market is expected to reach this target level and start a downward wave towards 1.3640. If this level breaks downwards, the trend may extend towards 1.3494.
Technically, this scenario is confirmed by the Elliott wave structure and the downward wave matrix with a pivot point at 1.3626. This remains key within the USDCAD wave structure. Currently, the market continues developing a consolidation range around the price Envelope’s central line at 1.3626. Today, we consider a rise to its upper boundary at 1.3737, followed by a decline towards the lower boundary at 1.3494.
Technical indicators for today’s USDCAD forecast suggest a decline towards 1.3494.
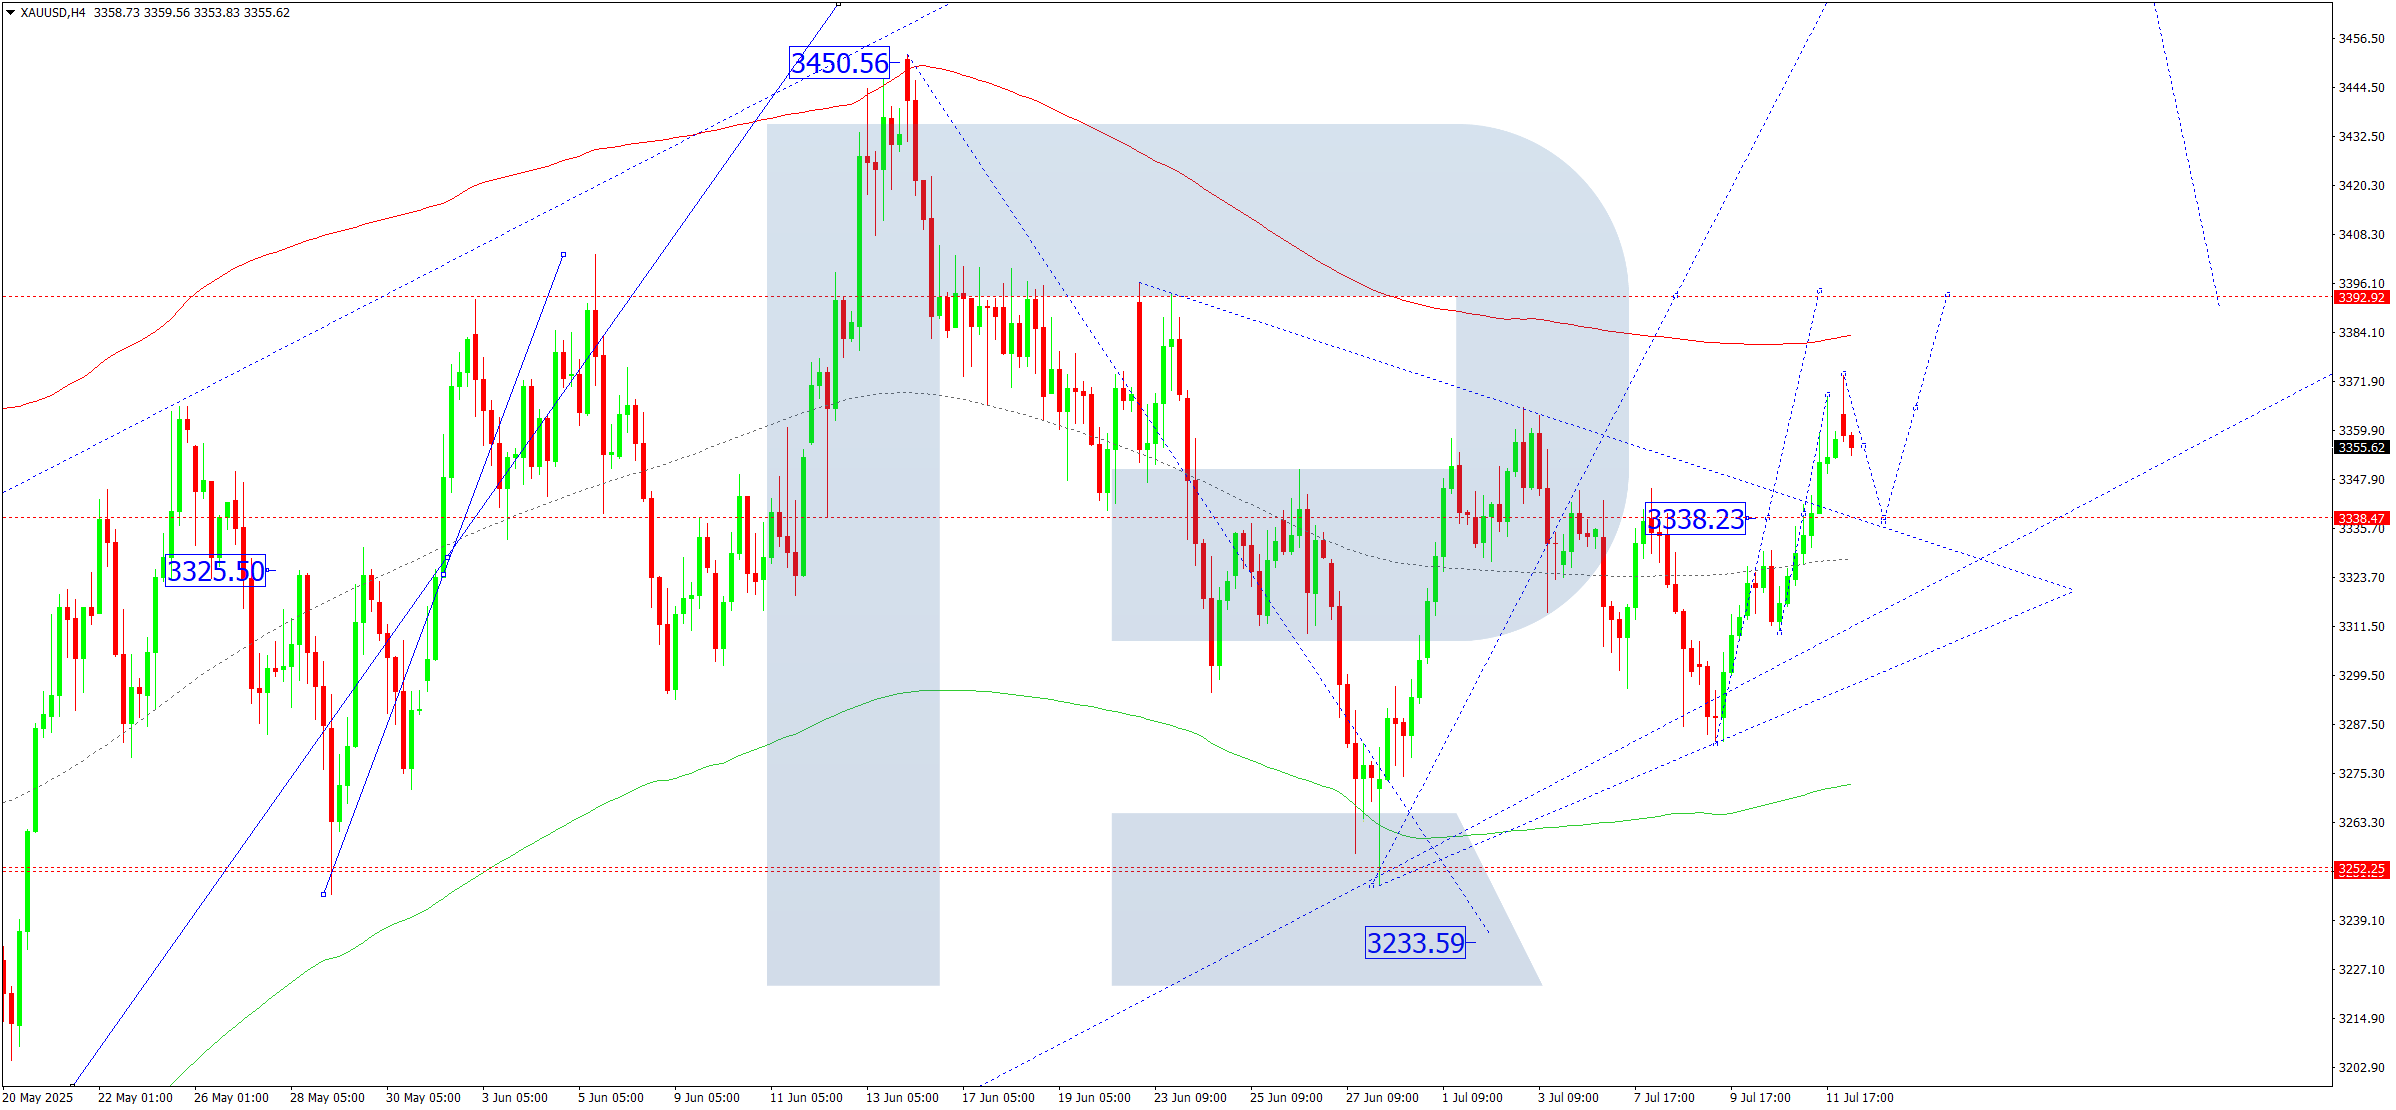
XAUUSD forecast
On the H4 chart of XAUUSD, the market continues developing a consolidation range around 3,333. Today, 14 July 2025, the range could expand upwards towards 3,393 before returning to 3,333. It is relevant to consider an upward breakout towards 3,430.
Technically, this scenario is confirmed by the Elliott wave structure and the growth wave matrix with a pivot point at 3,333. This remains key within the XAUUSD wave structure. Currently, the market is forming a wave structure towards the price Envelope’s upper boundary at 3,393. Afterwards, we expect a downward wave towards its central line at 3,333.
Technical indicators for today’s XAUUSD forecast suggest a possible continuation of the growth wave towards 3,393.
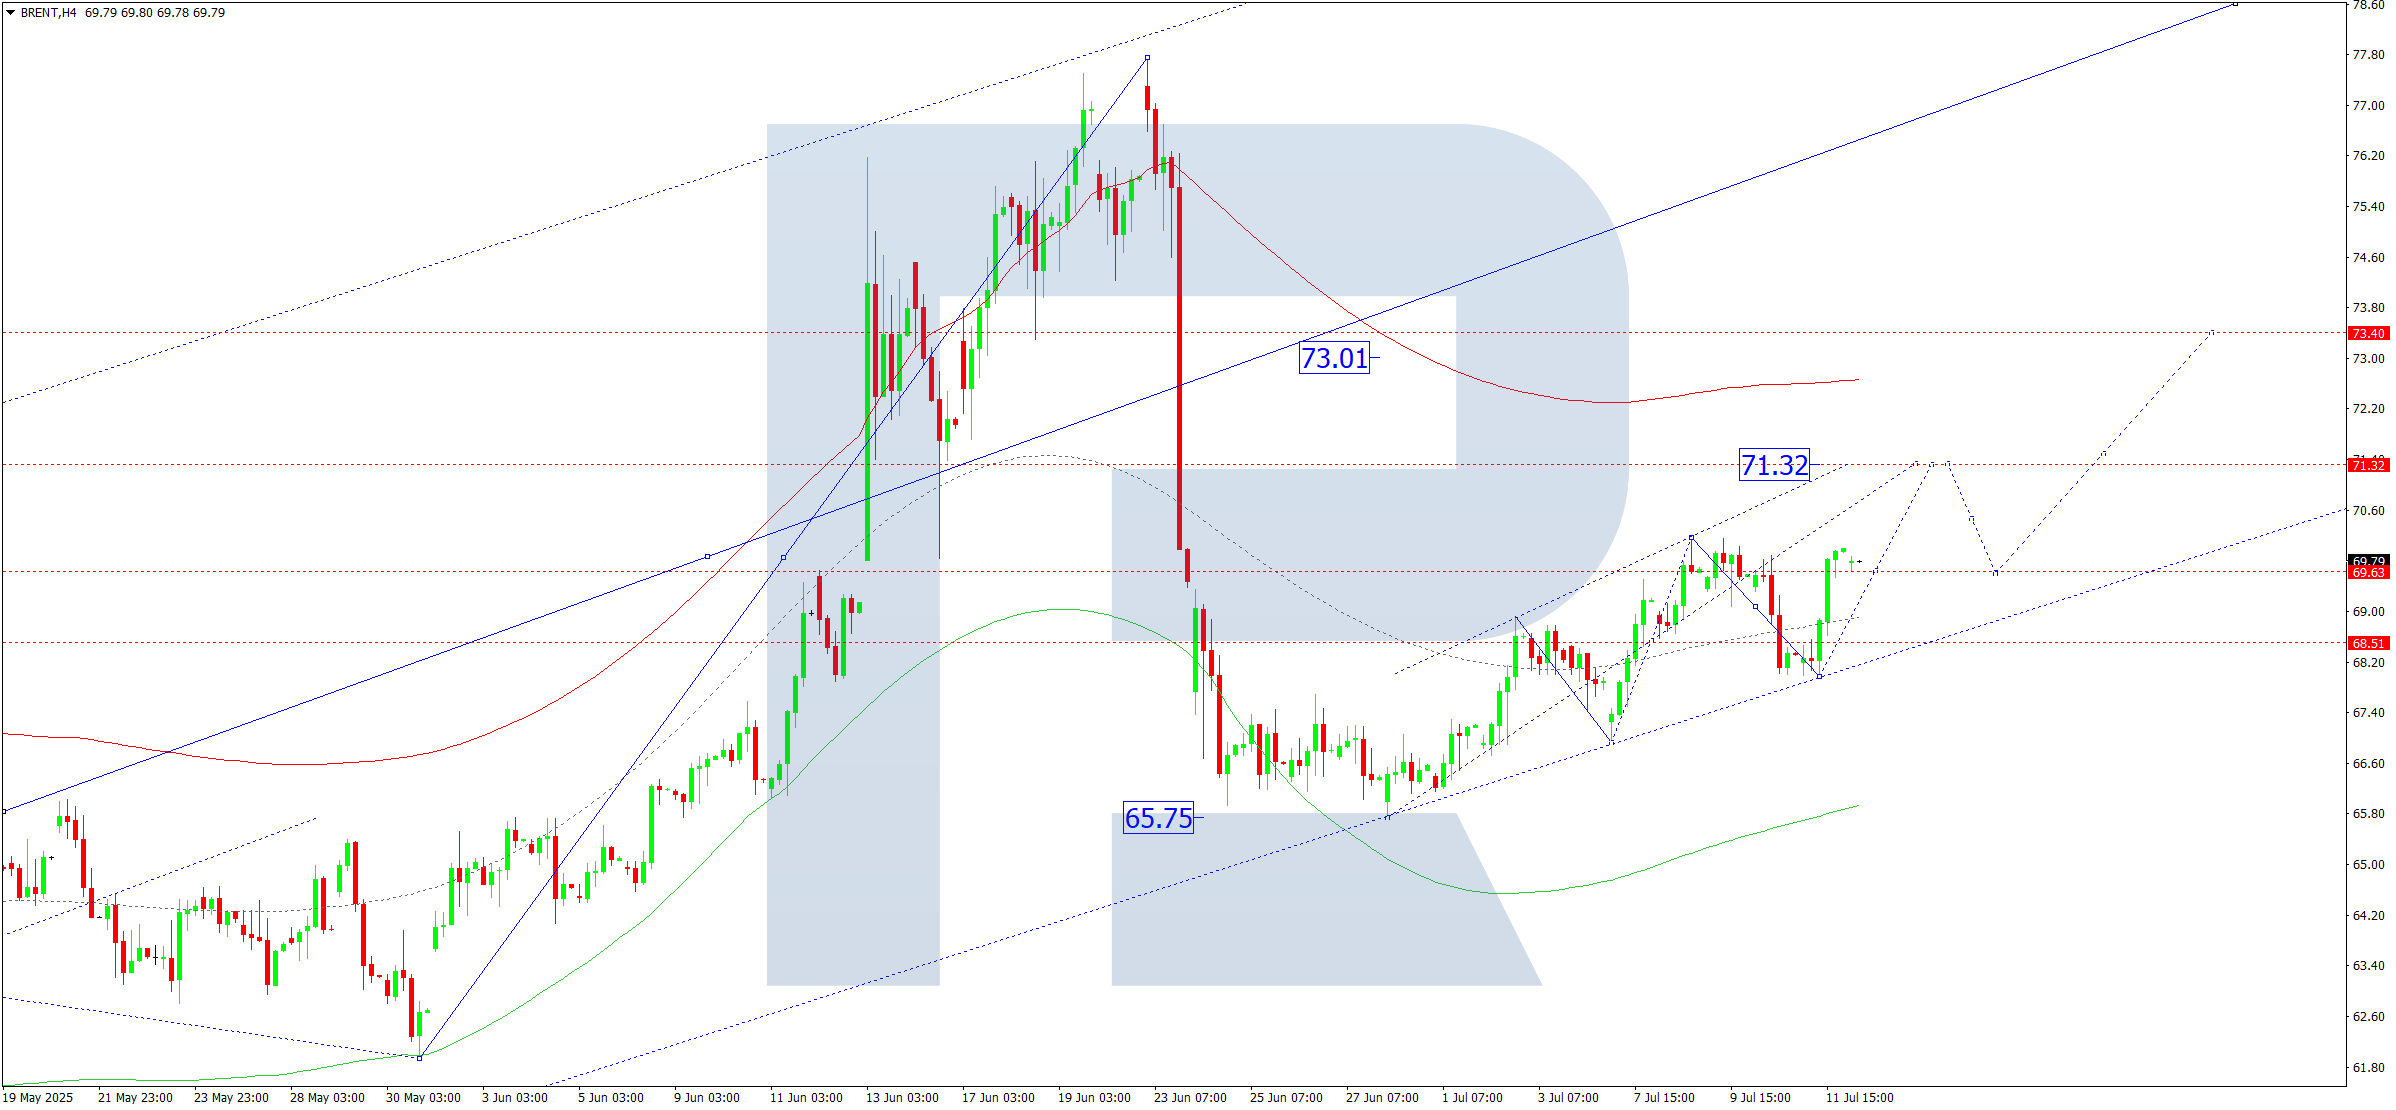
Brent forecast
On the H4 chart of Brent crude, the market completed a growth wave towards 70.00. Today, 14 July 2025, a compact consolidation range could develop around this level. It is relevant to consider a breakout upwards from this range, with 71.30 as the first target. Afterwards, a correction towards 69.50 is possible, followed by growth to 73.00.
Technically, this scenario is confirmed by the Elliott wave structure and the growth wave matrix with a pivot point at 69.50. This remains crucial for the Brent wave structure. Currently, the market is forming a consolidation range around the price Envelope’s central line at 69.50. A rise towards its upper boundary at 73.00 is possible.
Technical indicators for today’s Brent forecast suggest a continued growth wave towards 73.00.
Forecasts presented in this section only reflect the author’s private opinion and should not be considered as guidance for trading. RoboForex bears no responsibility for trading results based on trading recommendations described in these analytical reviews.