Daily technical analysis and forecast for 10 July 2025
Here is a detailed daily technical analysis and forecast for EURUSD, USDJPY, GBPUSD, AUDUSD, USDCAD, XAUUSD and Brent for 10 July 2025.
EURUSD forecast
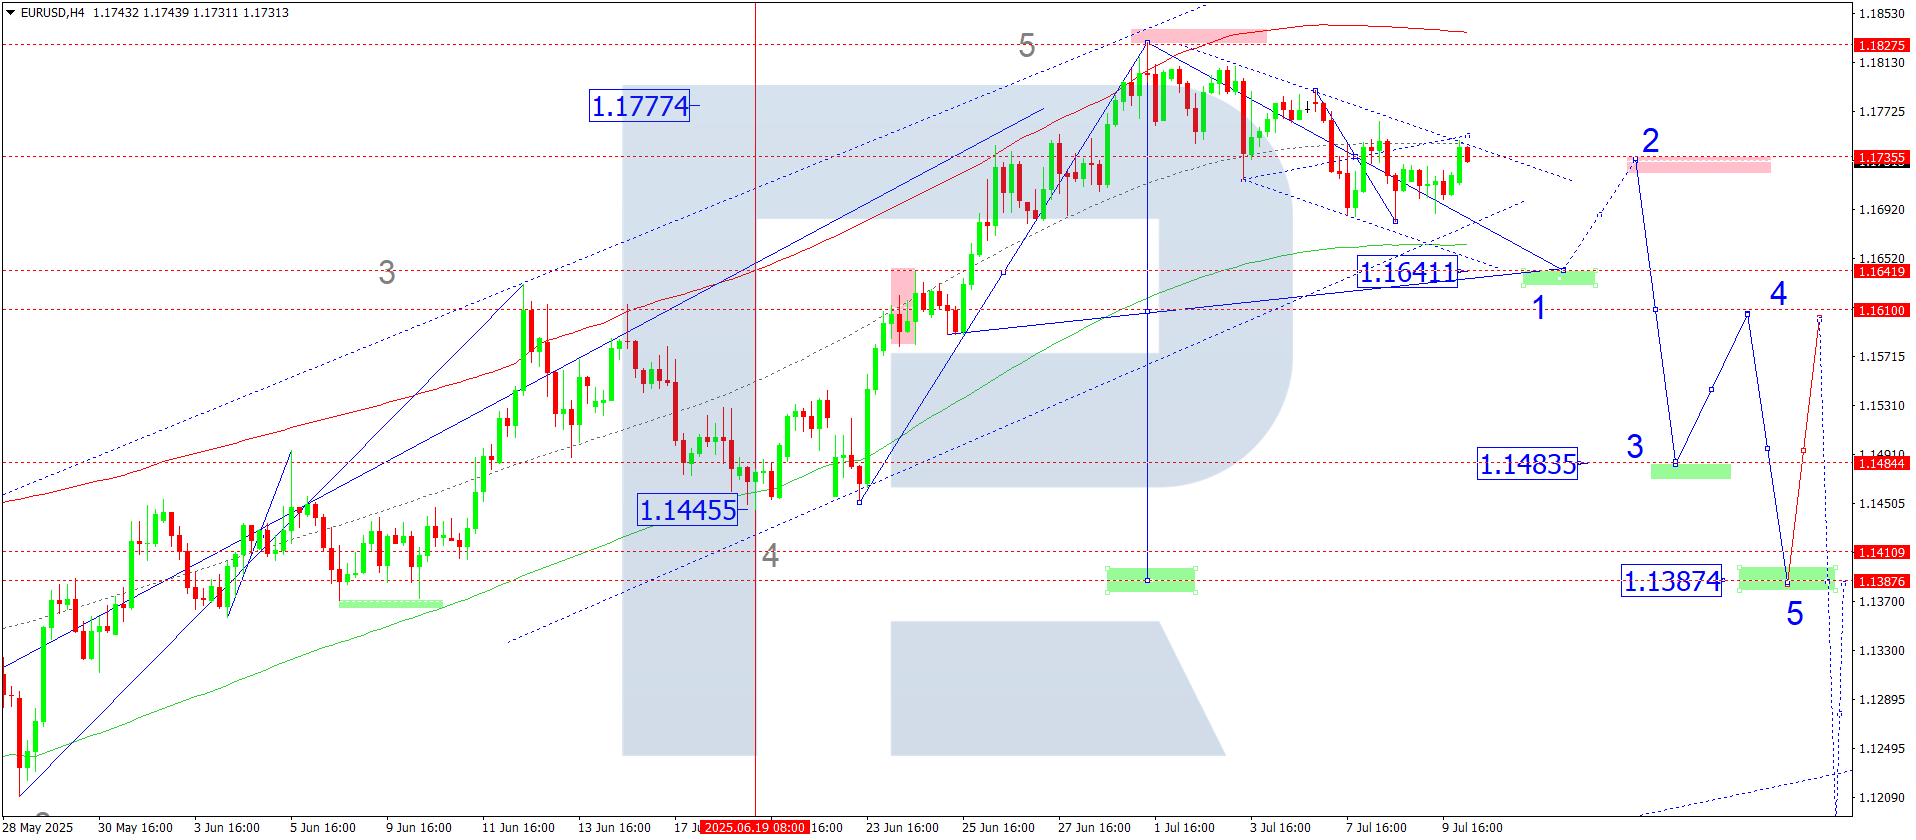
On the H4 chart of EURUSD, the market completed a correction wave to 1.1749. Today, 10 July 2025, we consider the possibility of a consolidation range developing at current highs. It is relevant to consider the end of this correction and the start of a new downward wave towards 1.1640 as the first target.
Technically, this scenario is confirmed by the Elliott wave structure and the downward wave matrix with a rotation centre at 1.1735. This remains key within the EURUSD wave structure. Currently, the market completed a correction to the Price Envelope’s central line at 1.1735. We then expect a downward wave towards its lower boundary at 1.1640.
Technical indicators for today’s EURUSD forecast suggest considering the start of a downward wave towards 1.1640.
USDJPY forecast
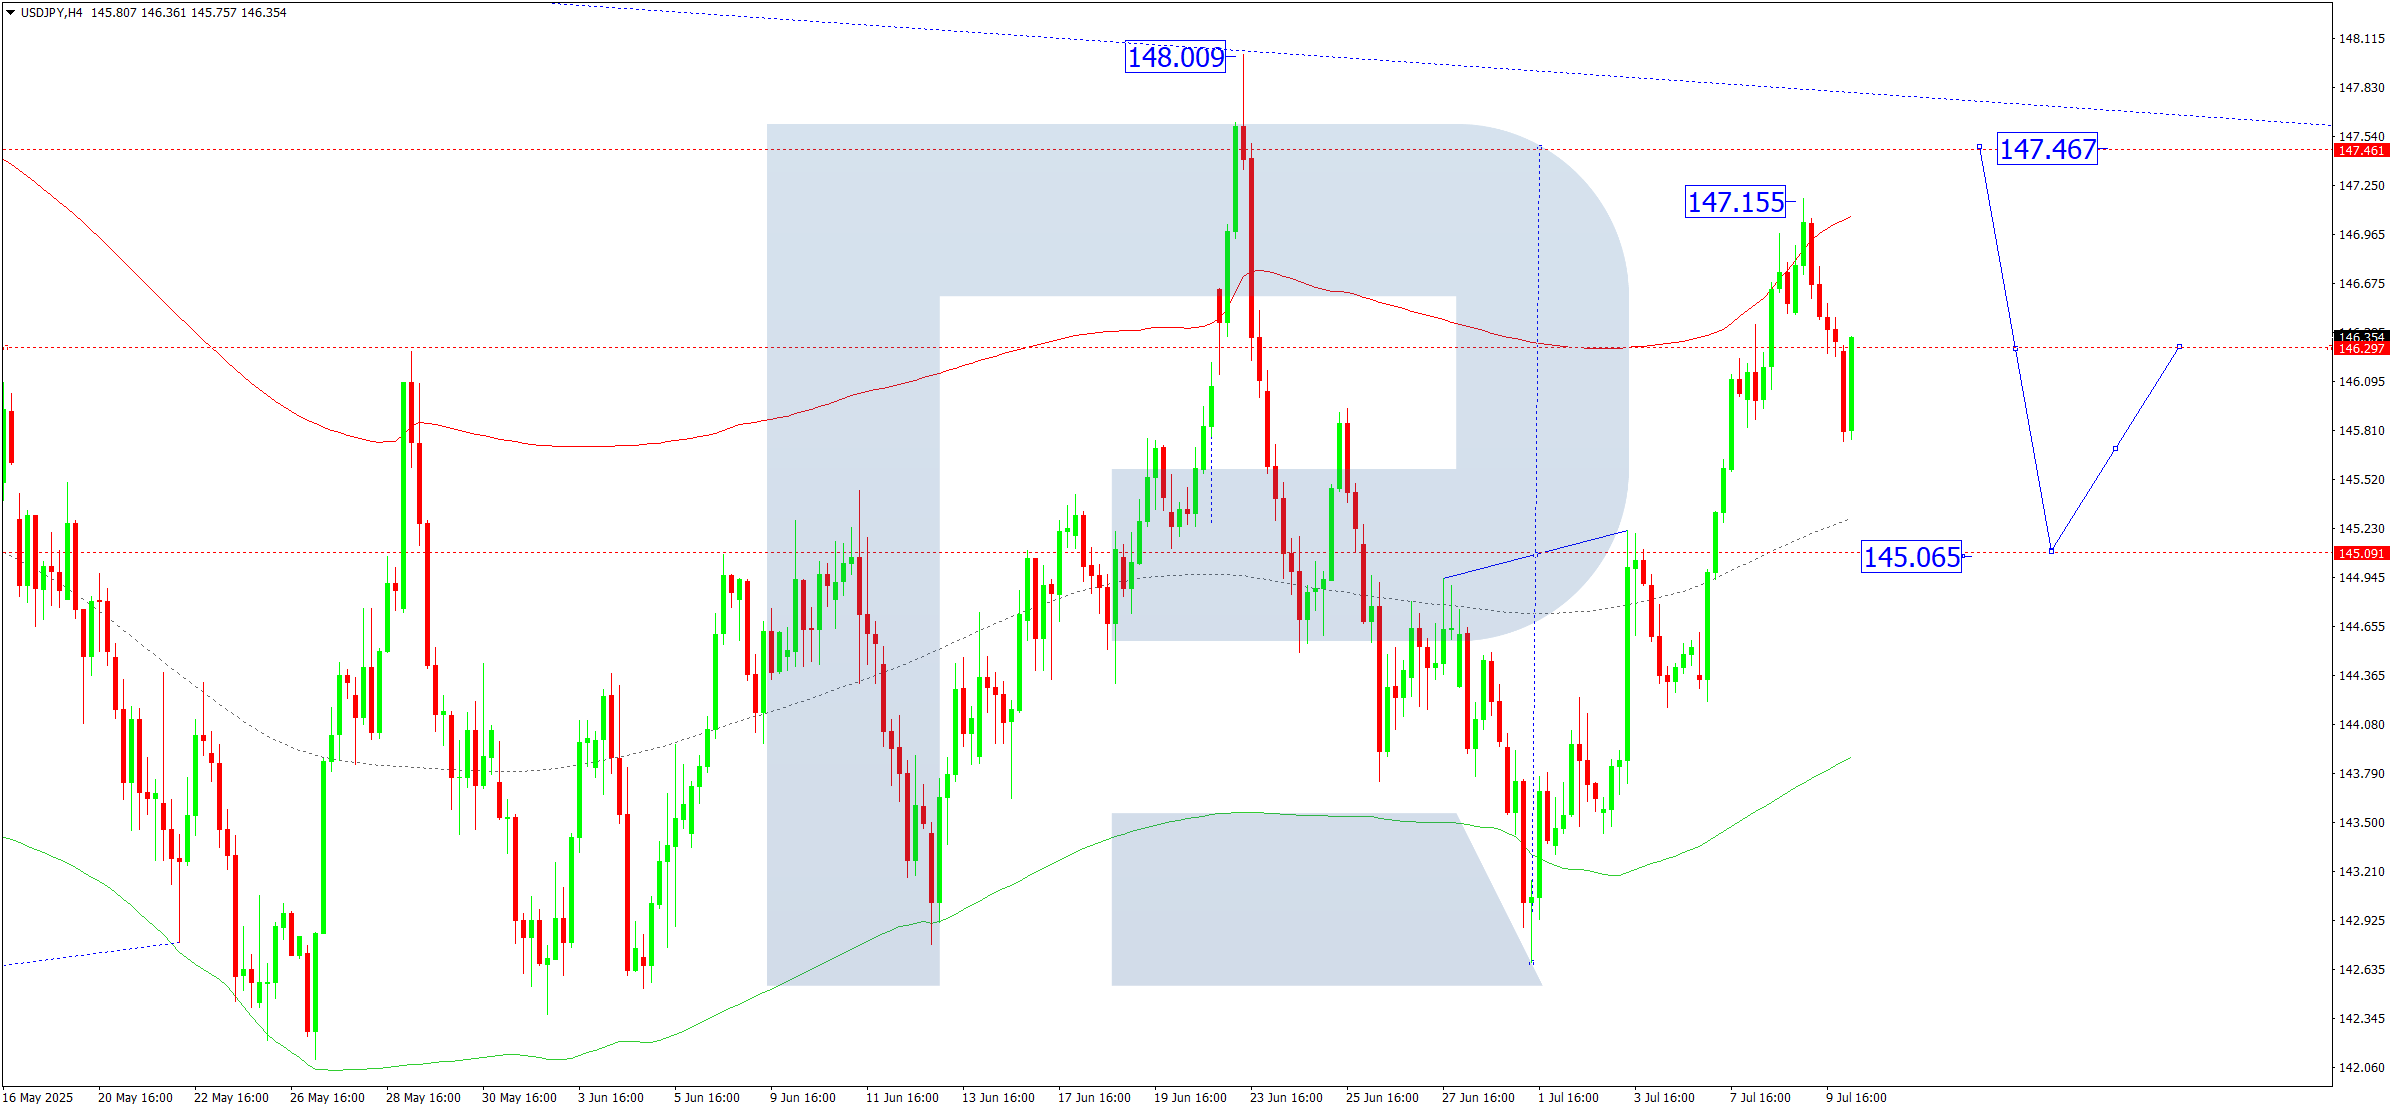
On the H4 chart of USDJPY, the market is forming a consolidation range around 146.30 without a clear trend. Today, 10 July 2025, expansion of the range upwards towards 147.46 is possible. Afterwards, a decline towards 145.06 is expected.
Technically, this scenario for USDJPY is confirmed by the Elliott wave structure and the downward wave matrix with a rotation centre at 144.84. This remains key within this wave structure. Currently, the market completed a correction structure to the Price Envelope’s upper boundary at 147.15. Afterwards, a decline towards its central line at 145.06 is possible, followed by growth towards 147.46.
Technical indicators for today’s USDJPY forecast suggest considering continuation of the growth wave towards 147.46.
GBPUSD forecast
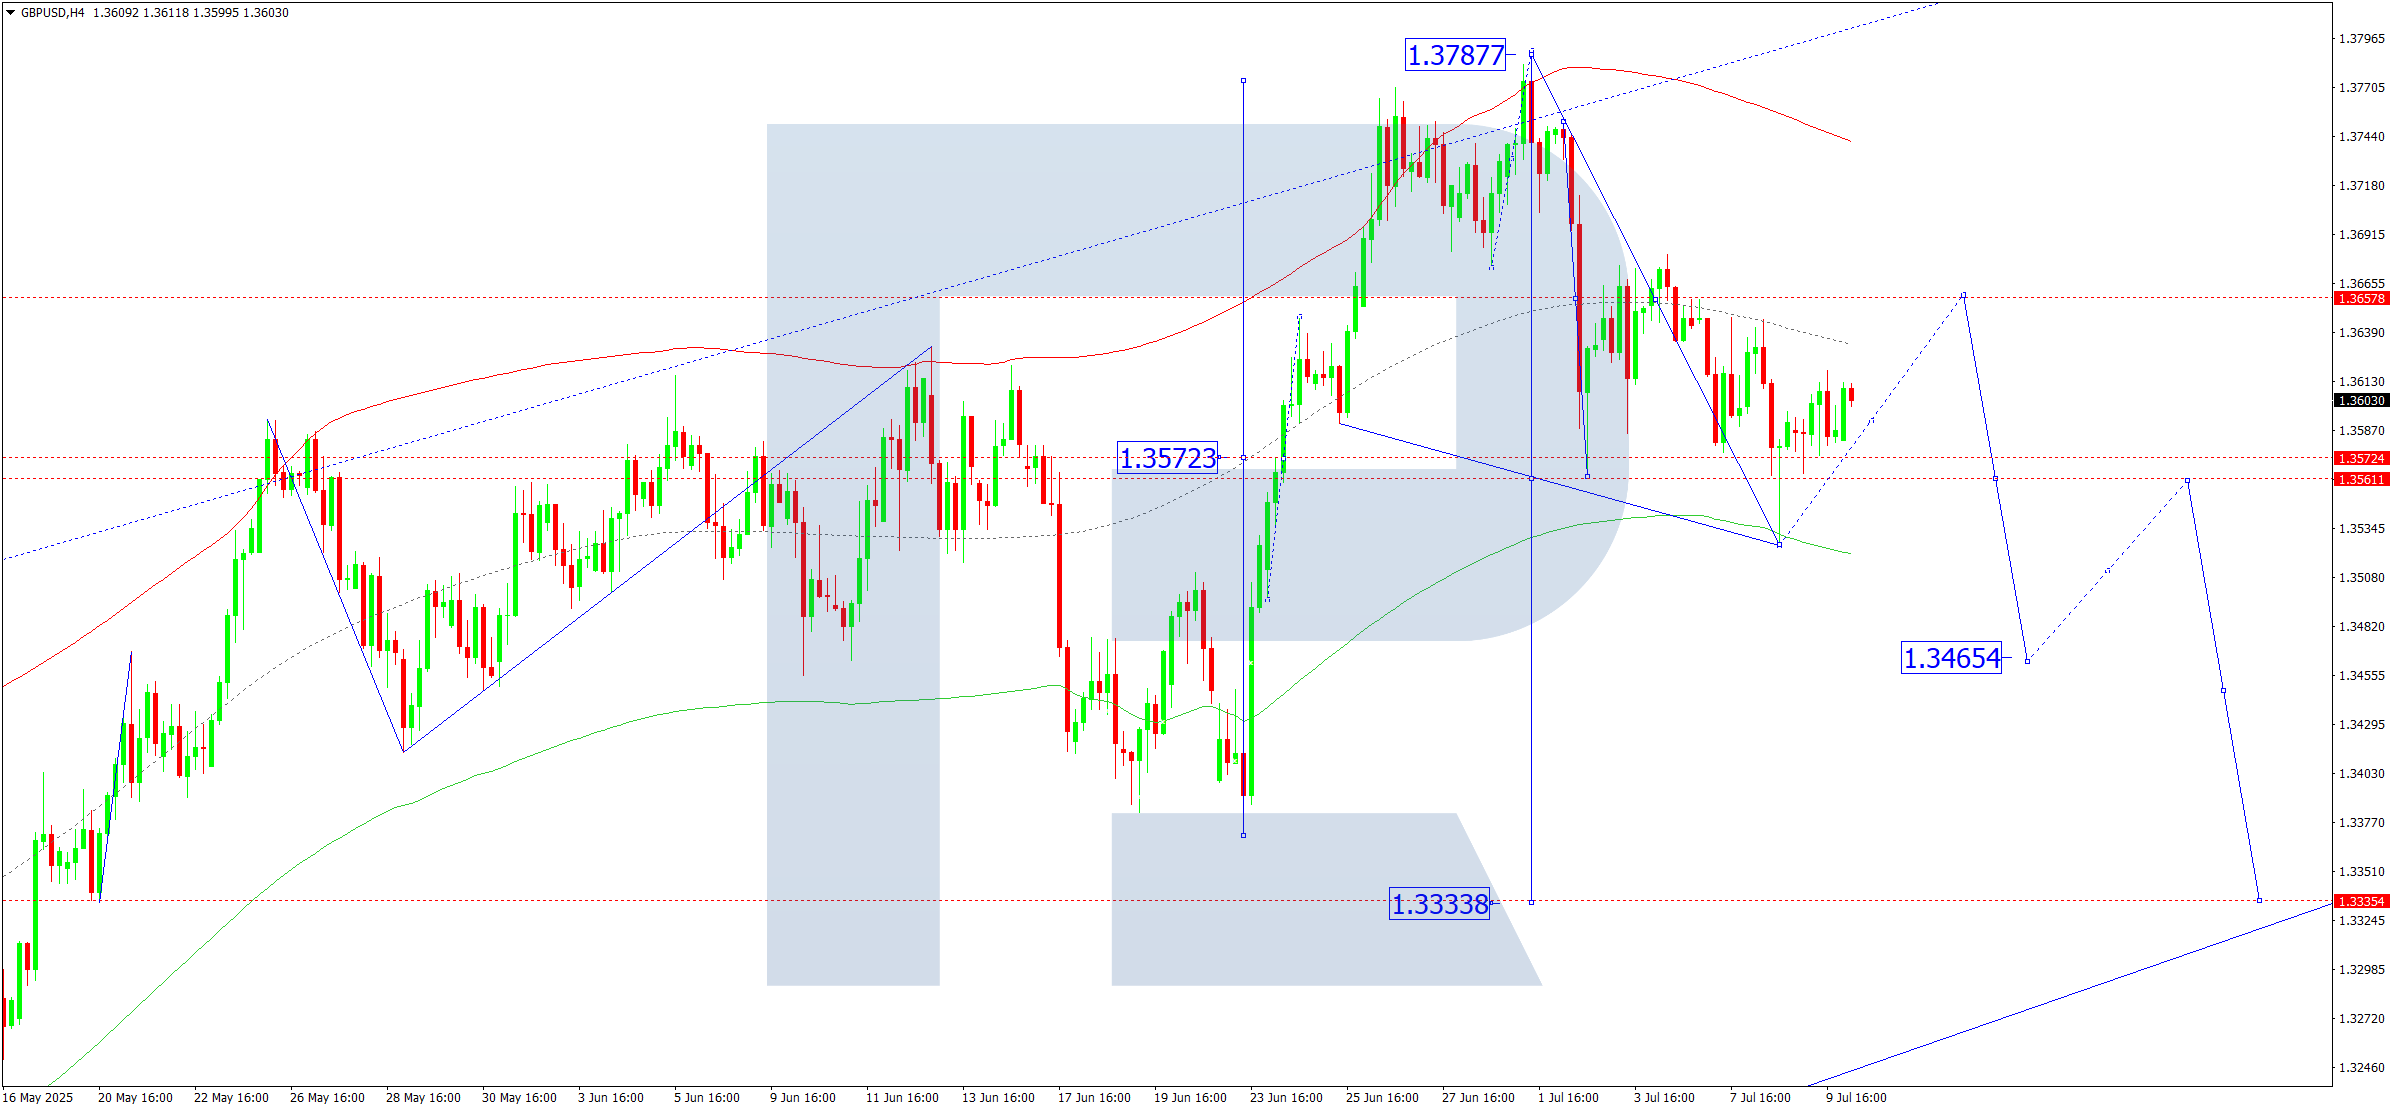
On the H4 chart of GBPUSD, the market is forming a consolidation range around 1.3590. Today, 10 July 2025, we expect an upward breakout and a correction towards 1.3656. After this correction ends, a new downward wave towards 1.3520 is possible, with trend continuation towards 1.3465 as a local target.
Technically, this scenario for GBPUSD is confirmed by the Elliott wave structure and the downward wave matrix with a rotation centre at 1.3656. This remains key within this wave structure. Currently, the market completed the first downward wave to the Price Envelope’s lower boundary at 1.3527. We expect the correction wave to continue towards its central line at 1.3656.
Technical indicators for today’s GBPUSD forecast suggest considering growth towards 1.3656.
AUDUSD forecast
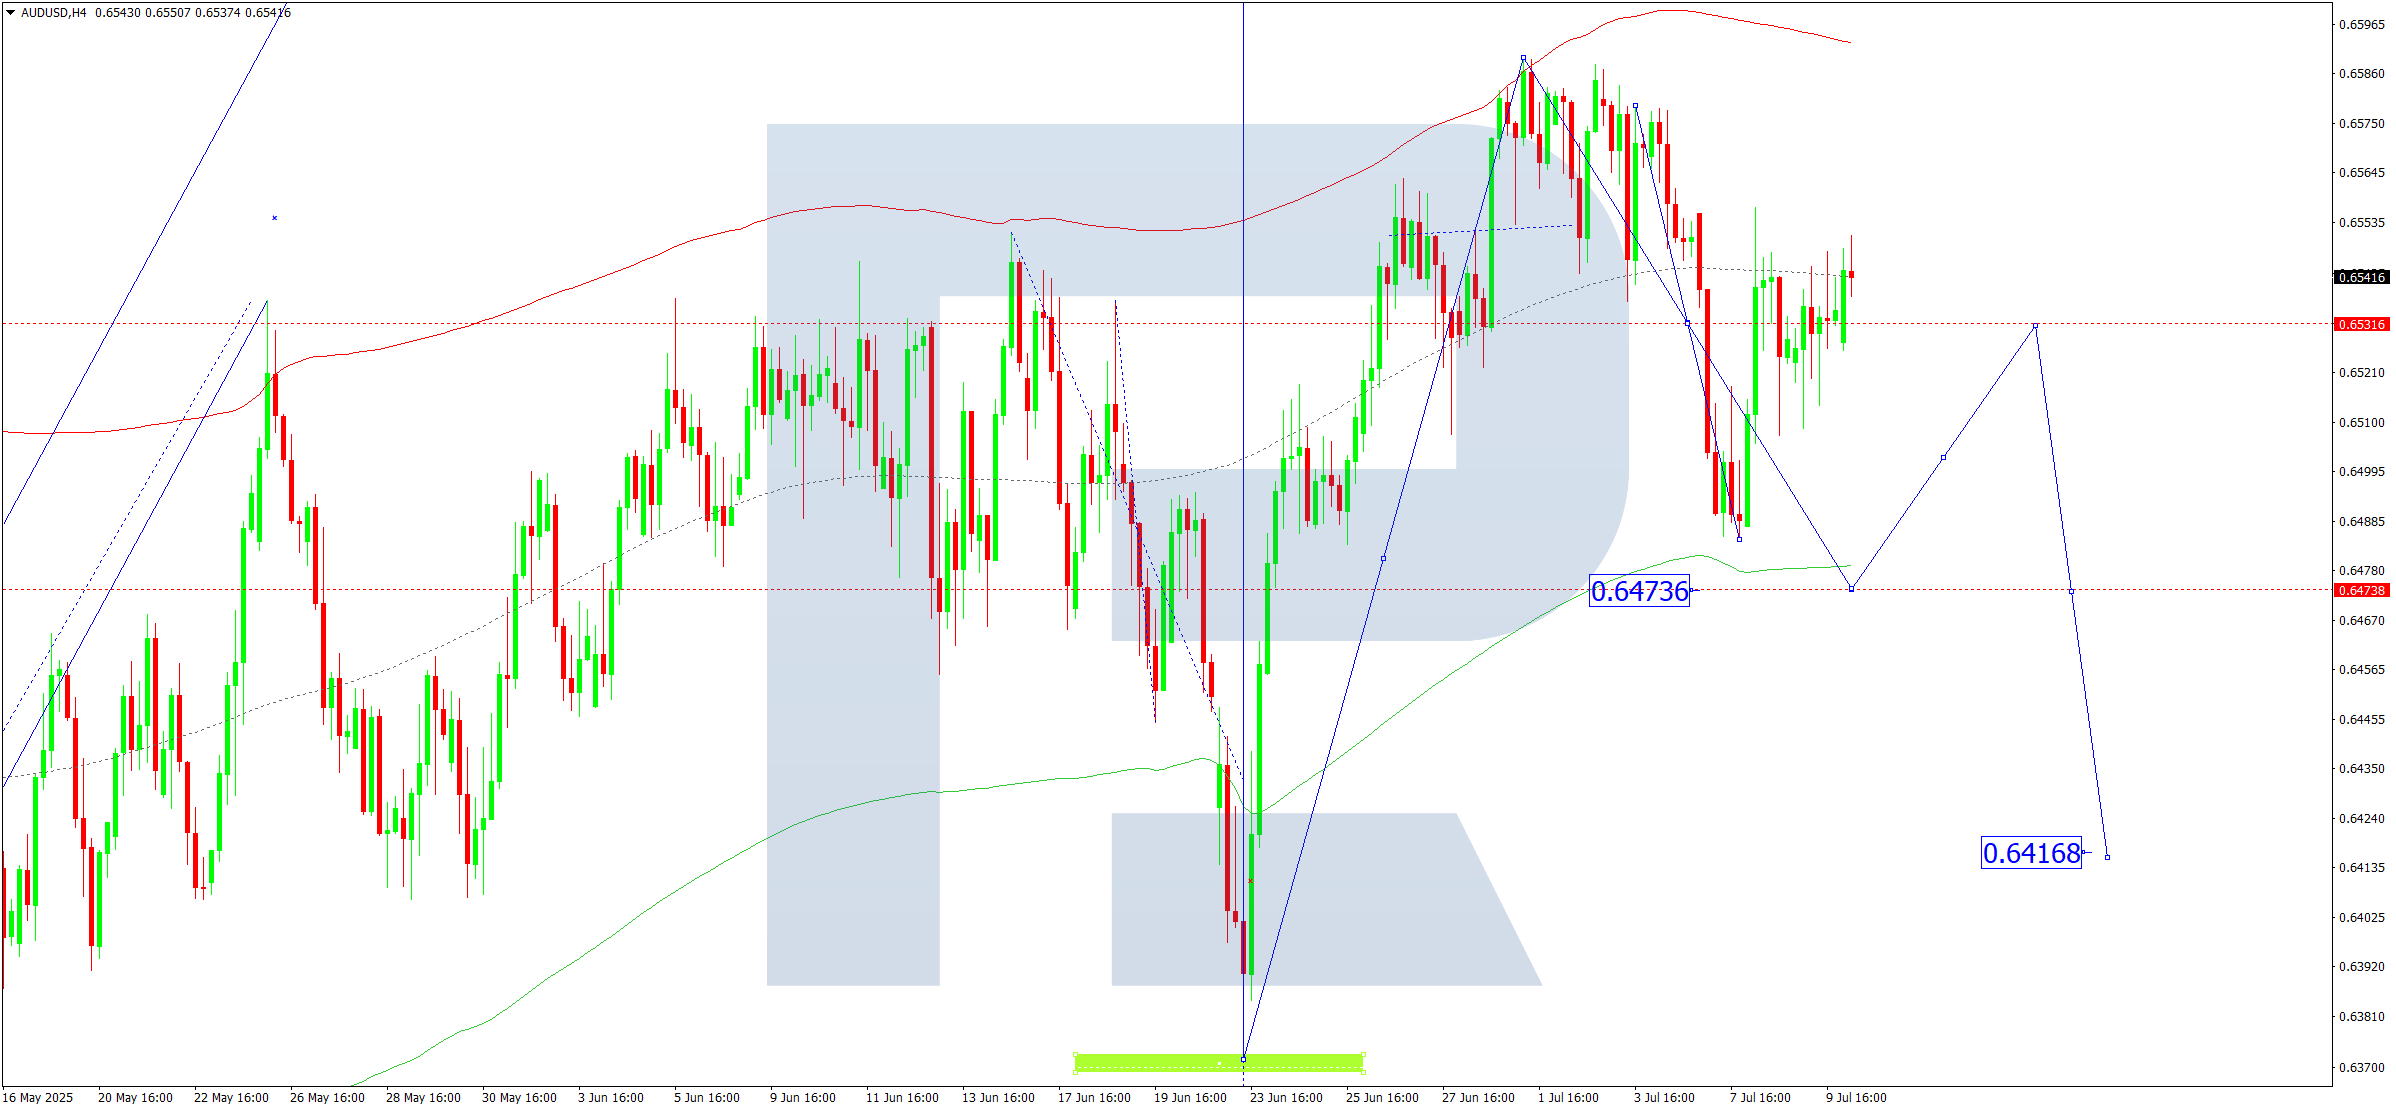
On the H4 chart of AUDUSD, the market is forming a consolidation range around 0.6550. Today, 10 July 2025, we expect the beginning of another downward wave towards 0.6473 as the first target. Upon reaching this level, a correction towards 0.6550 is possible.
Technically, this scenario is confirmed by the Elliott wave structure and the growth wave matrix with a rotation centre at 0.6444. This remains key within this wave structure. Currently, the market completed a correction to the Price Envelope’s central line at 0.6550. Today, we expect a decline towards its lower boundary at 0.6473.
Technical indicators for today’s AUDUSD forecast suggest considering a decline towards 0.6473.
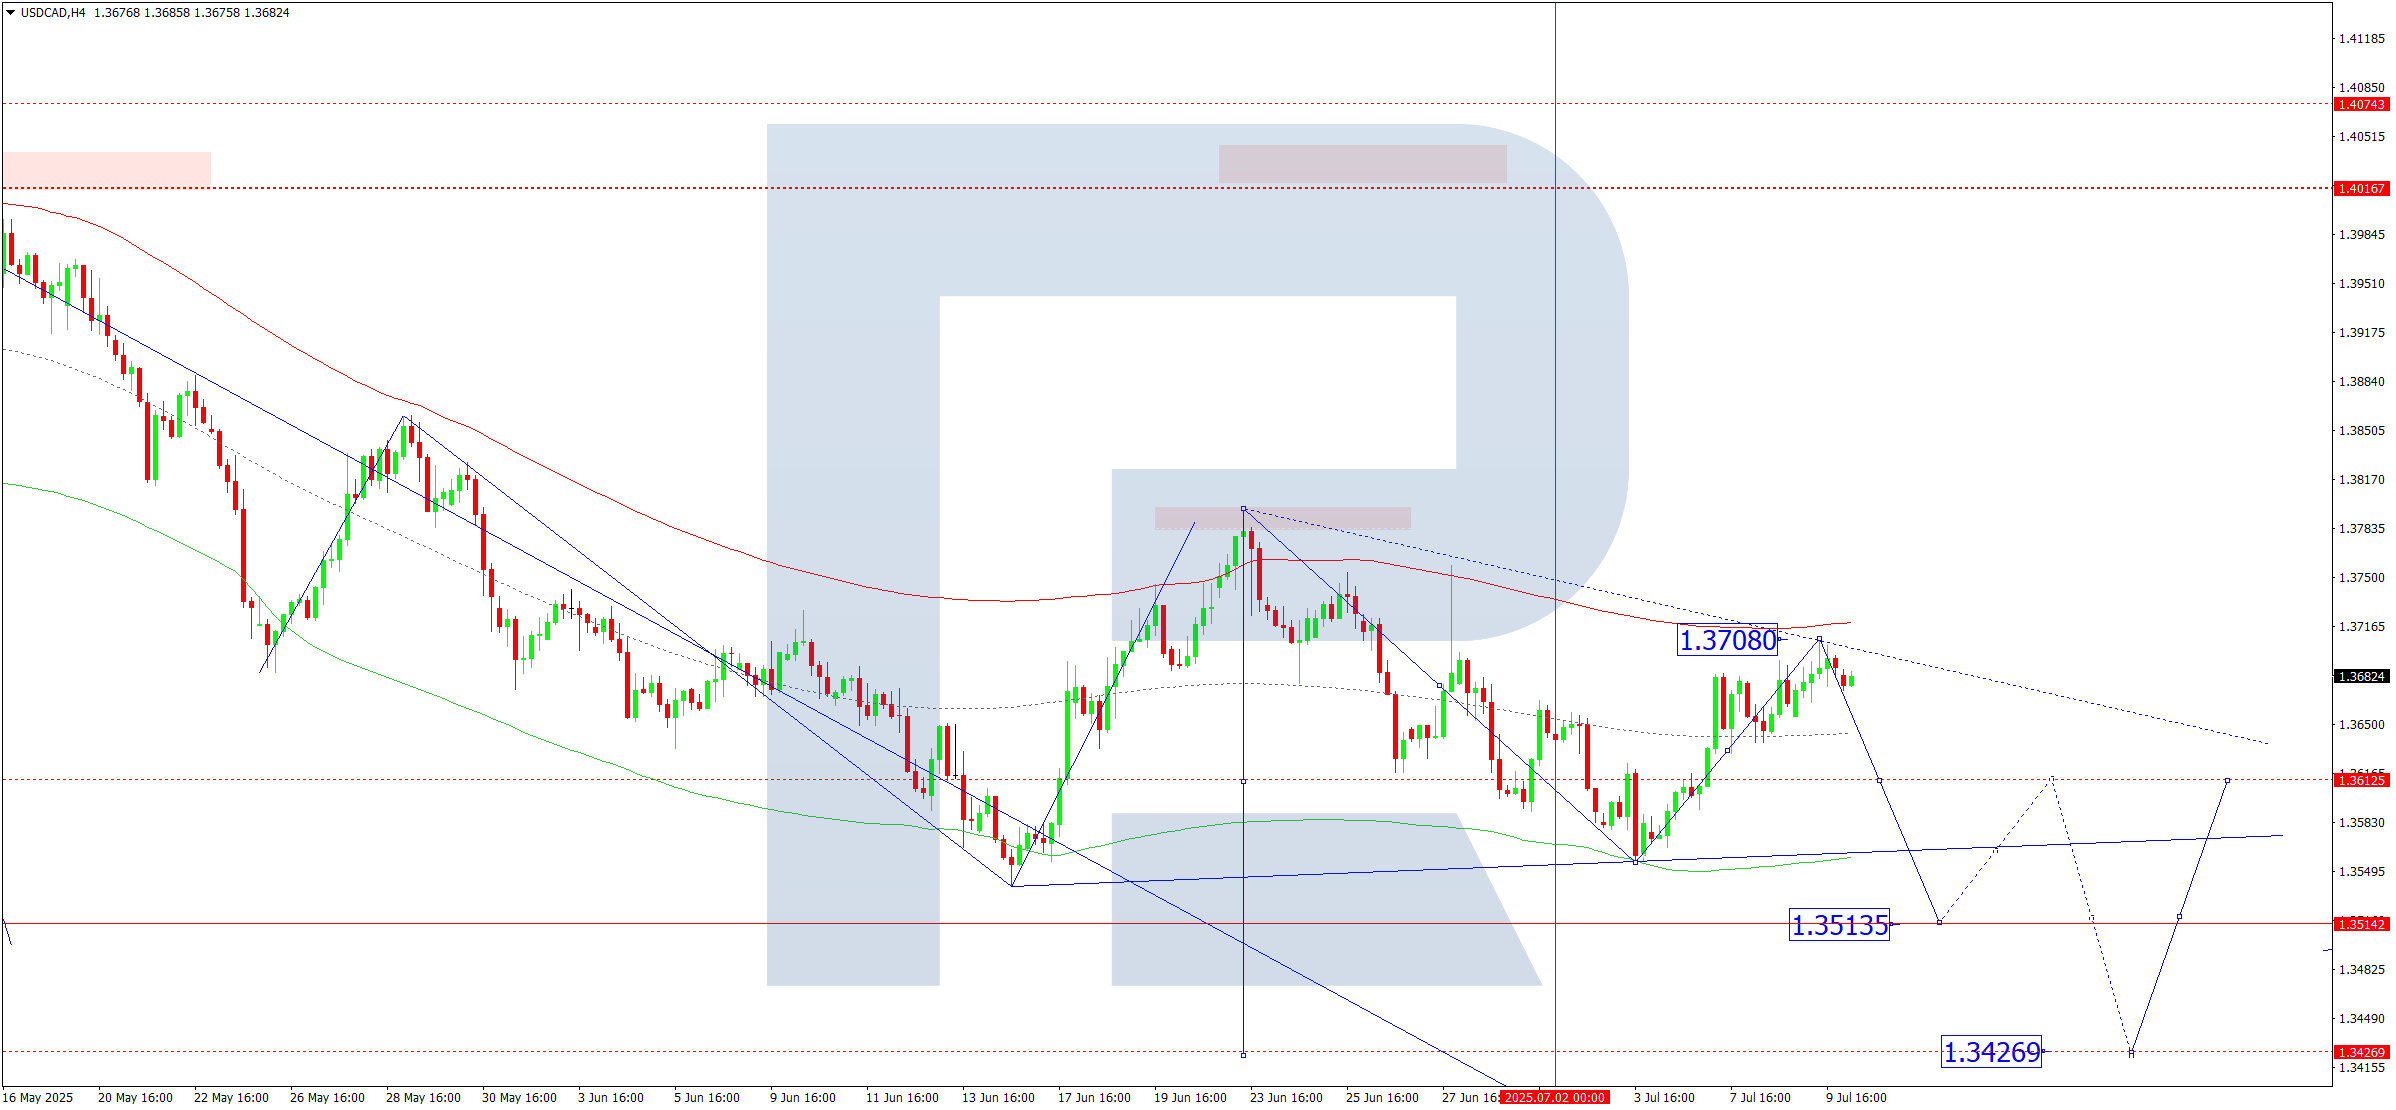
USDCAD forecast
On the H4 chart of USDCAD, the market completed a correction to 1.3708. Today, 10 July 2025, we expect the start of a downward wave towards 1.3515. Upon reaching this level, a correction towards 1.3656 is possible, followed by a decline to 1.3426.
Technically, this scenario is confirmed by the Elliott wave structure and the downward wave matrix with a rotation centre at 1.3626. This remains key within the USDCAD wave structure. Currently, the market continues developing its consolidation range around the Price Envelope’s central line at 1.3626. Today, a decline towards its lower boundary at 1.3515 is relevant.
Technical indicators for today’s USDCAD forecast suggest considering a decline towards 1.3515.
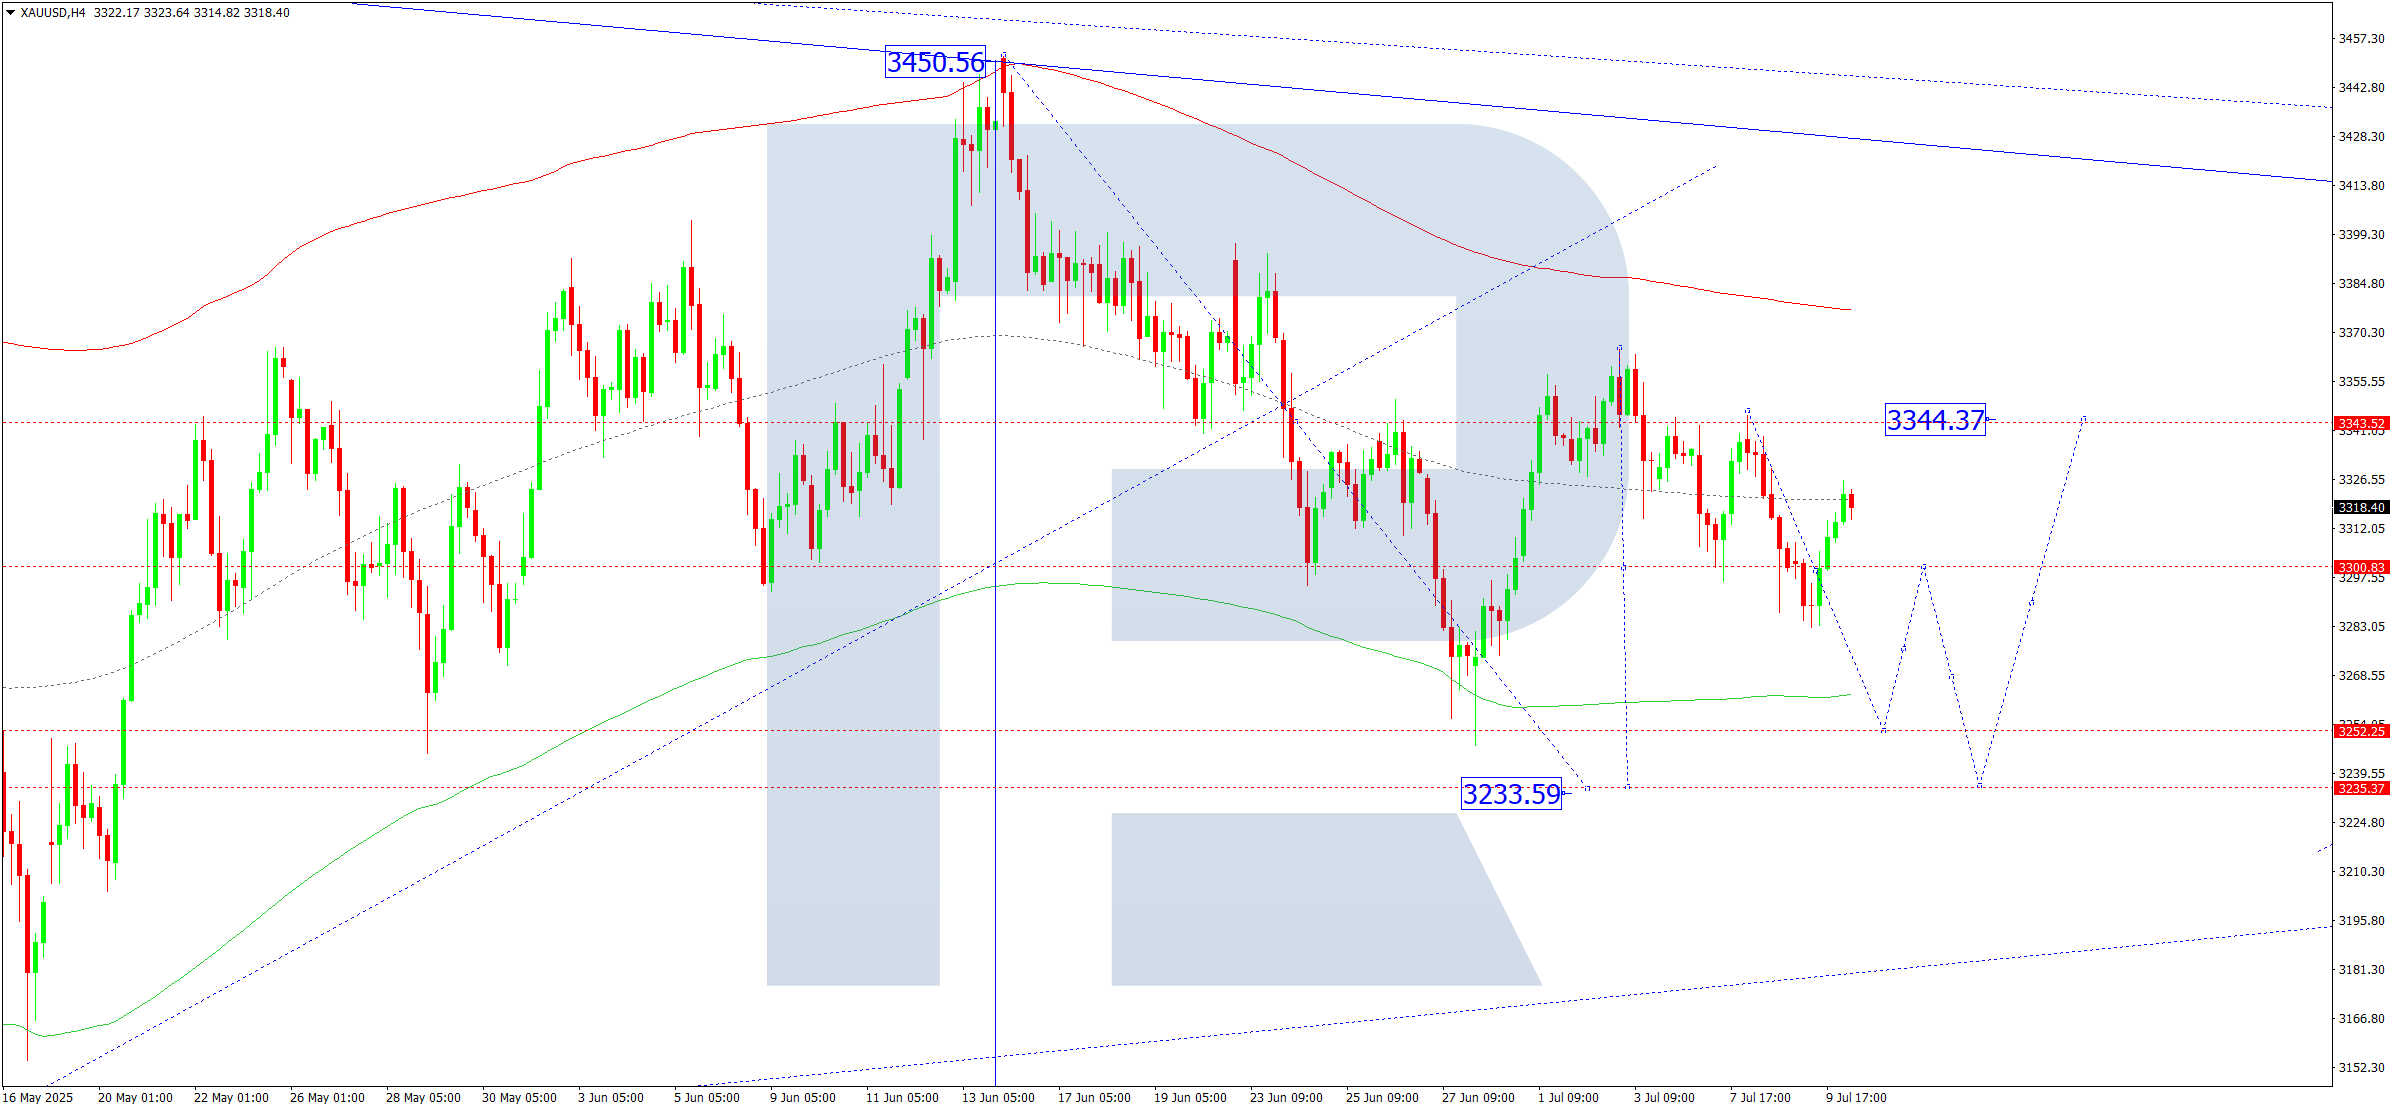
XAUUSD forecast
On the H4 chart of XAUUSD, the market continues forming a consolidation range around 3300 without a clear trend. Today, 10 July 2025, expansion of the range downwards towards 3282 is possible, then upwards towards 3300. It is relevant to consider a breakout downwards from this range for continuation of the downward wave towards 3233.
Technically, this scenario is confirmed by the Elliott wave structure and the downward wave matrix with a rotation centre at 3344. This remains key within this wave structure. Currently, the market completed a wave to the Price Envelope’s central line at 3344. Today, the structure of a downward wave towards its lower boundary at 3233 is expected.
Technical indicators for today’s XAUUSD forecast indicate the possibility of continued decline towards 3233.
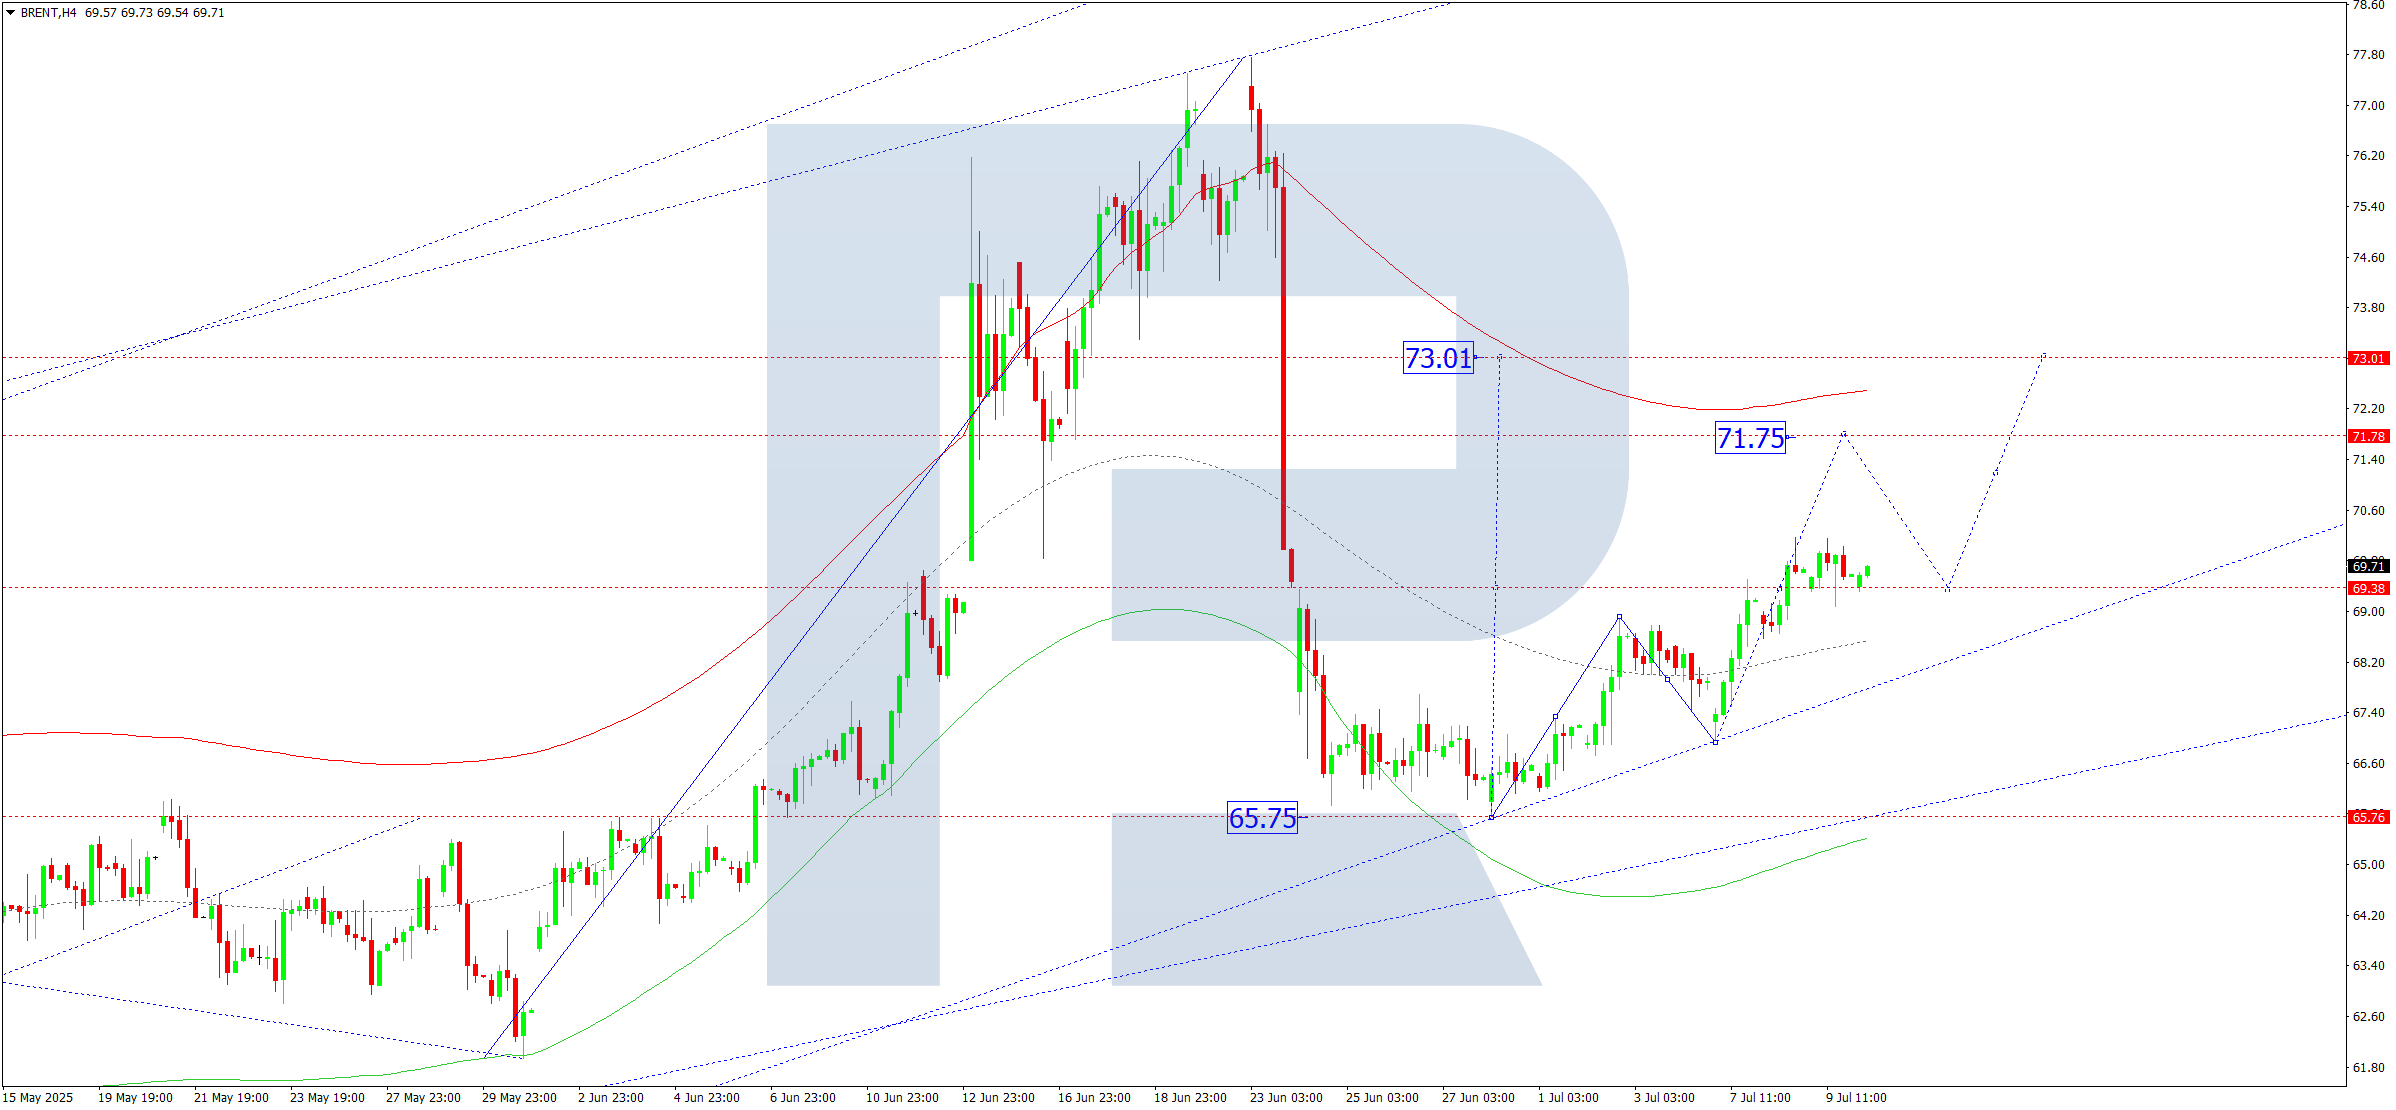
Brent forecast
On the H4 chart of Brent crude, the market continues forming a consolidation range around 69.39. Today, 10 July 2025, we consider the possibility of an upward breakout with a growth wave towards 71.75 as a local target. Afterwards, a correction towards 69.40 is possible, followed by growth towards 73.00.
Technically, this scenario is confirmed by the Elliott wave structure and the growth wave matrix with a rotation centre at 69.40. This remains key within Brent’s wave structure. Currently, the market is forming a consolidation range around the Price Envelope’s central line at 69.40. Growth towards its upper boundary at 73.00 is relevant.
Technical indicators suggest today’s Brent forecast considers potential continuation of the growth wave towards 73.00.
Forecasts presented in this section only reflect the author’s private opinion and should not be considered as guidance for trading. RoboForex bears no responsibility for trading results based on trading recommendations described in these analytical reviews.