Daily technical analysis and forecast for 20 June 2025
Here is a detailed daily technical analysis and forecast for EURUSD, USDJPY, GBPUSD, AUDUSD, USDCAD, XAUUSD and Brent for 20 June 2025.
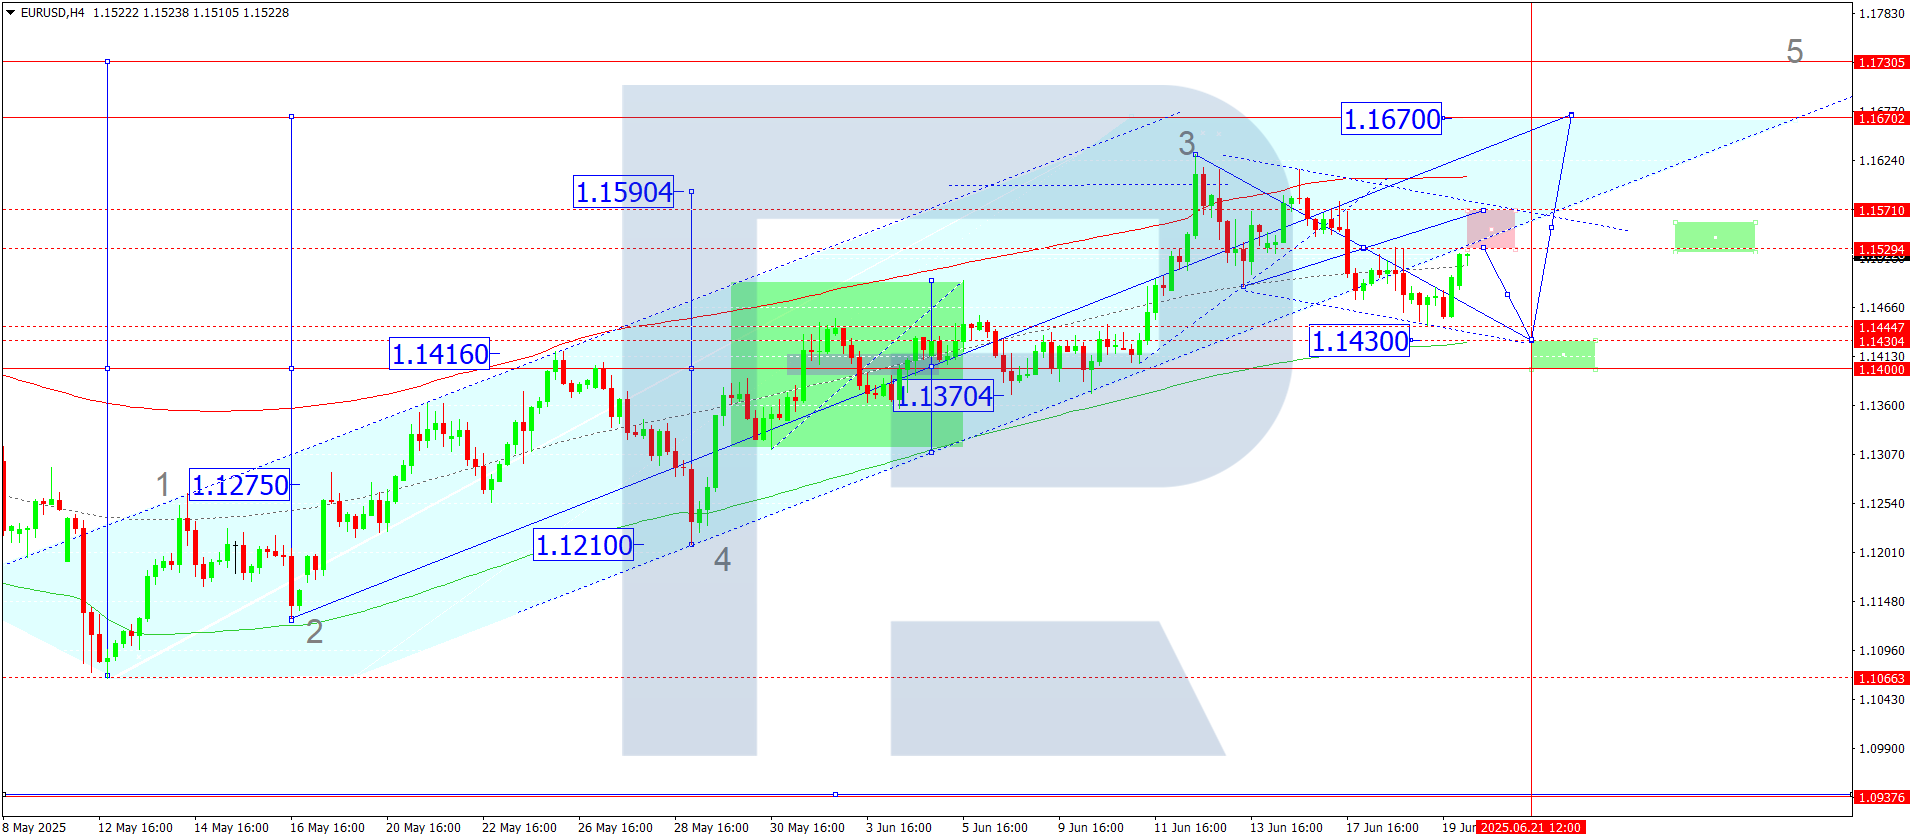
EURUSD forecast
On the H4 chart of EURUSD, the market completed a downward wave to 1.1445. Today, 20 June 2025, a growth wave to 1.1550 is anticipated. A consolidation range is likely to form around 1.1550. The entire decline appears to be corrective. Another downward structure towards 1.1430 remains possible. Later on, the price could rise to 1.1670, an estimated target.
This scenario is supported by the Elliott wave structure and the growth wave matrix with a pivot at 1.1400, seen as the key level in the current wave for EURUSD. At the moment, the market is shaping a consolidation range around the central line of the price Envelope at 1.1550. Today, the price is expected to decline towards its lower boundary at 1.1430, possibly completing the correction and initiating another growth wave to the upper boundary at 1.1670.
Technical indicators for today’s EURUSD forecast suggest a downward wave to 1.1430.
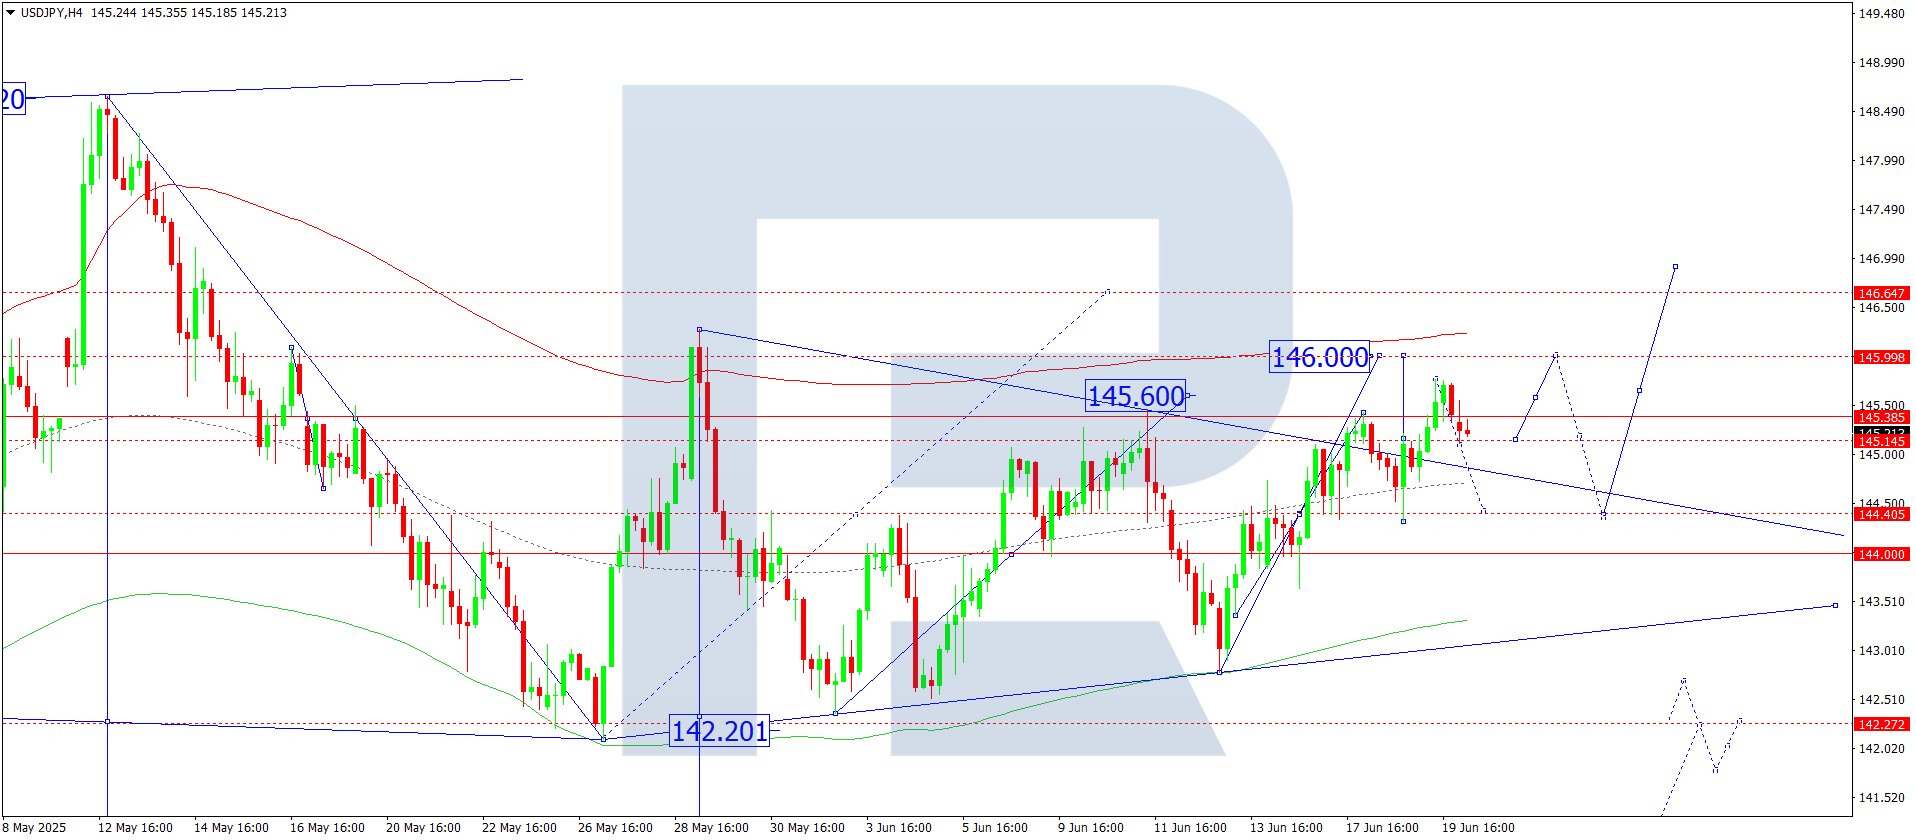
USDJPY forecast
On the H4 chart of USDJPY, the market reached 145.76 in a growth wave. Today, 20 June 2025, a corrective move to 145.14 is possible. A break below could lead to 144.44. Afterwards, a growth wave to 146.00 may develop. The broad consolidation range around 144.00 continues to evolve, and an upward expansion towards 146.60 remains possible.
The Elliott wave structure and growth wave matrix with a pivot at 144.00 confirm this scenario, viewed as key in this wave structure. Currently, the market is forming a consolidation range around the central line of the price Envelope at 144.40. Today, an upward move to its upper boundary at 146.00 remains relevant. Alternatively, a decline to the lower boundary at 144.00 is also possible.
Technical indicators for today’s USDJPY forecast suggest a continued growth wave to 146.00.
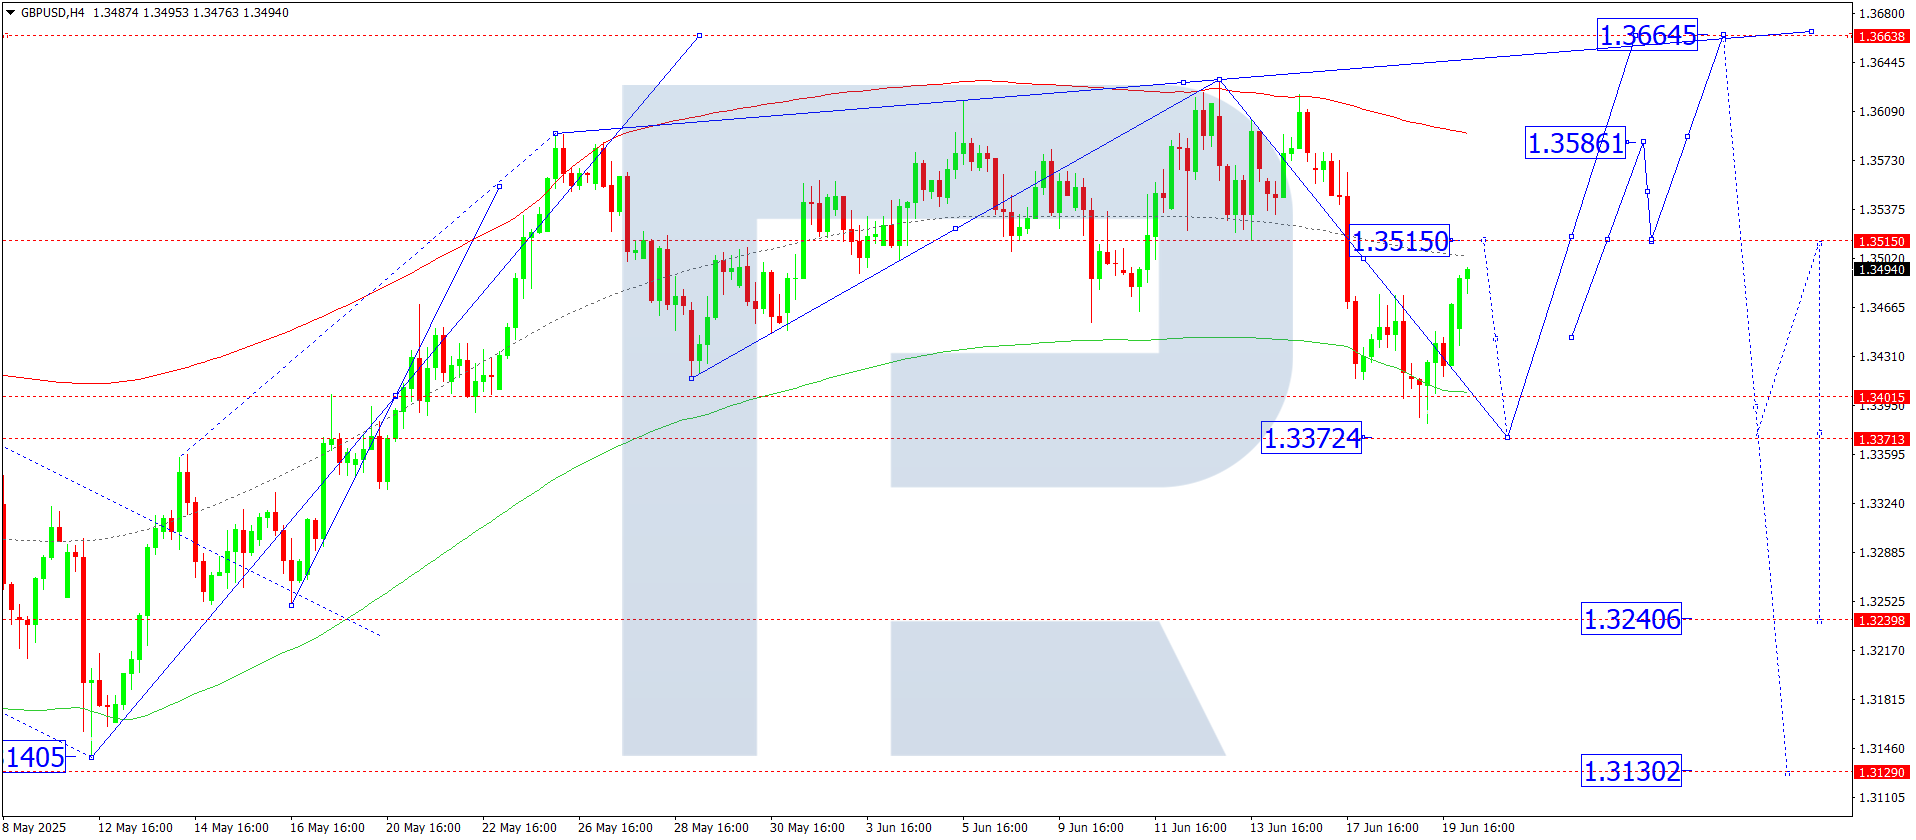
GBPUSD forecast
On the H4 chart of GBPUSD, the market declined to 1.3383, hitting a local target. Today, 20 June 2025, a correction to 1.3515 is expected. Afterwards, a decline to 1.3370 becomes relevant as the main target of the downward wave.
This scenario is supported by the Elliott wave structure and the decline wave matrix with a pivot at 1.3515, which is key in this wave structure. At the moment, the market has reached the lower boundary of the price Envelope at 1.3383. A corrective rise to the central line at 1.3515 is expected today, followed by a downward wave to the lower boundary at 1.3370.
Technical indicators for today’s GBPUSD forecast suggest a decline to 1.3370.
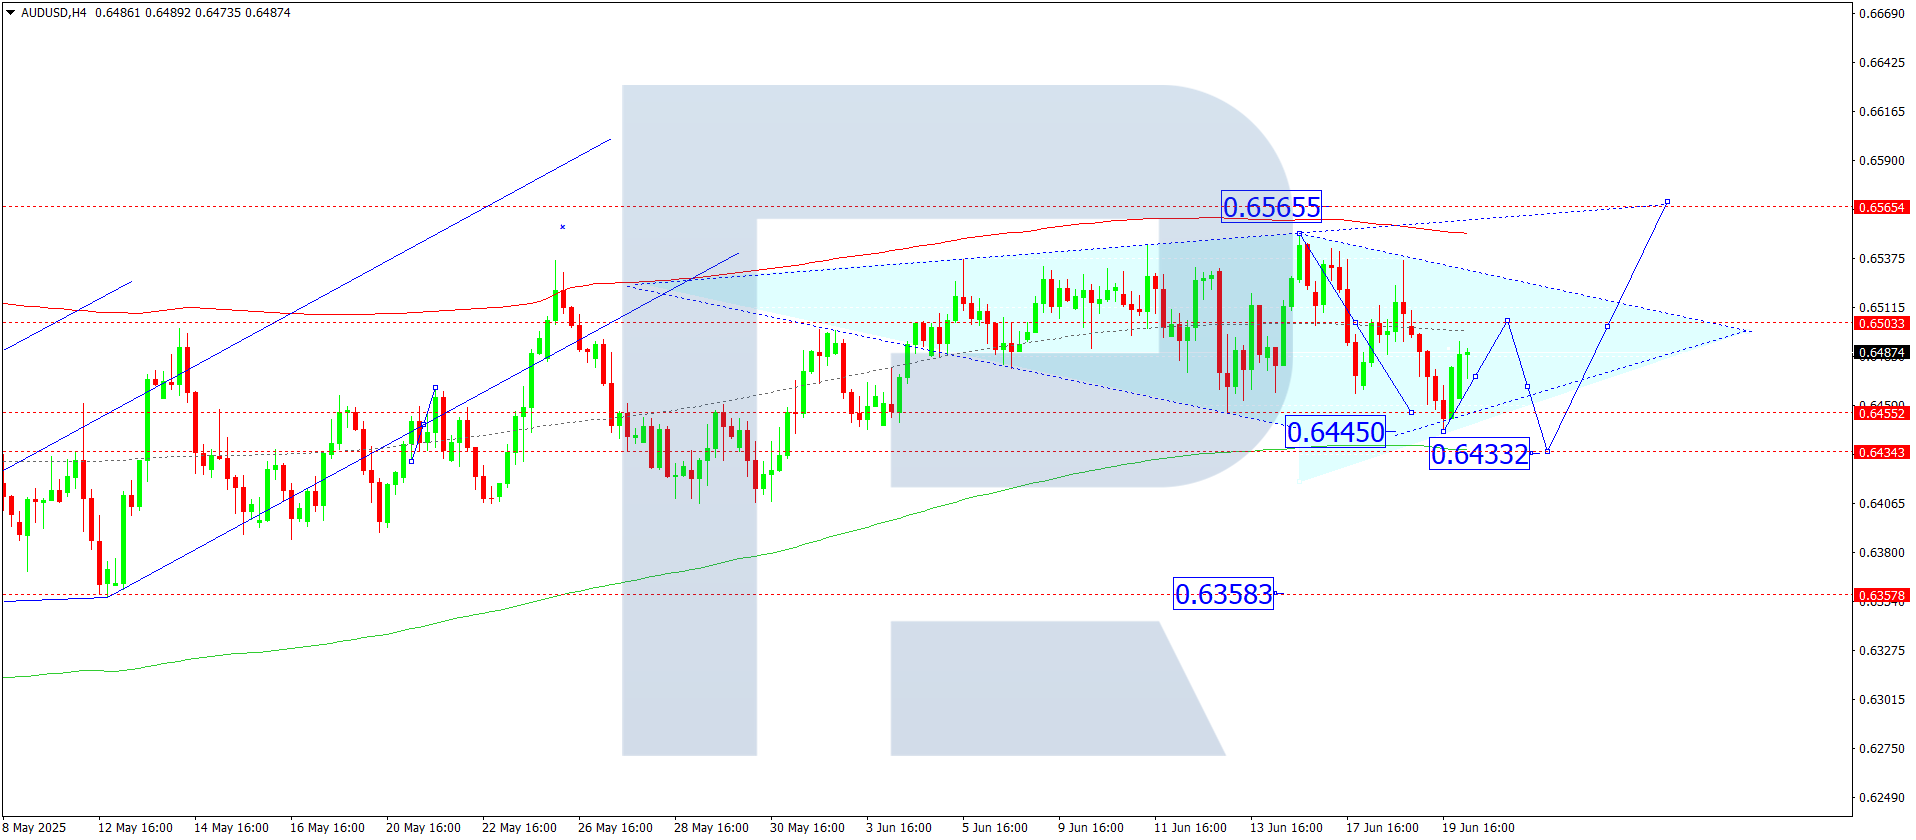
AUDUSD forecast
On the H4 chart of AUDUSD, the market completed a downward wave to 0.6445. Today, 20 June 2025, a rise to 0.6500 is likely. A decline to 0.6433 might follow, before another upward move to 0.6500. The market continues to shape a broad consolidation range around 0.6500.
This scenario is confirmed by the Elliott wave structure and the decline matrix with a pivot at 0.6500, which is considered key in this wave. The market touched the lower boundary of the price Envelope at 0.6445 and is now forming a growth structure towards the central line at 0.6500.
Technical indicators for today’s AUDUSD forecast suggest the possibility of another downward wave to 0.6433.
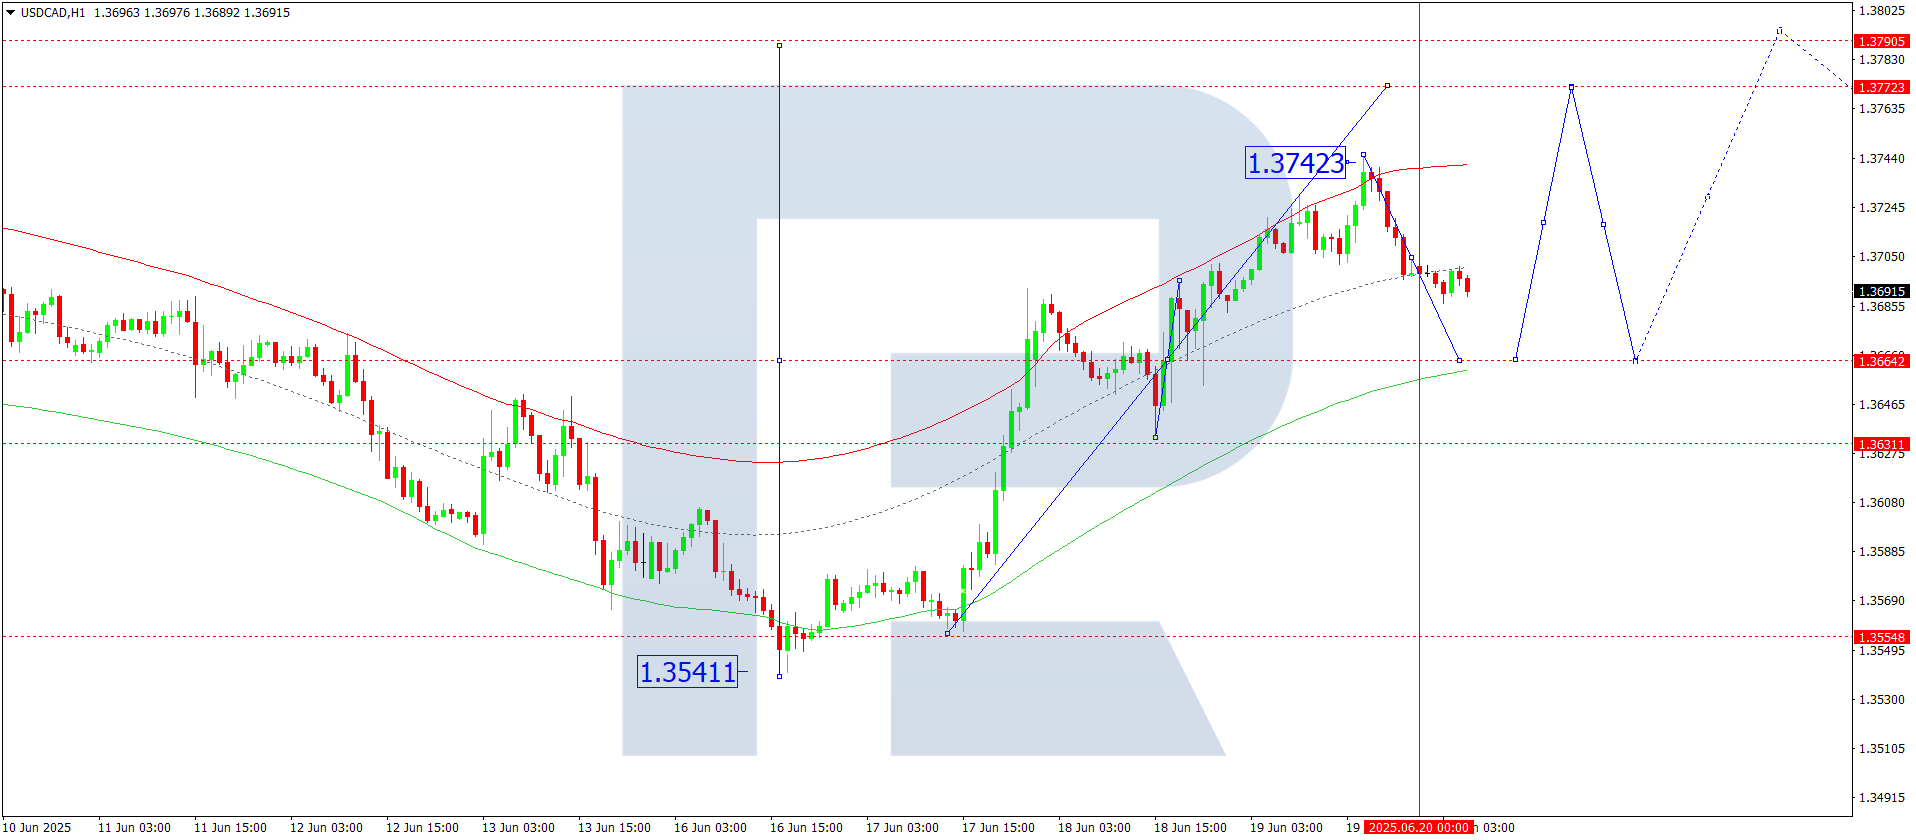
USDCAD forecast
On the H4 chart of USDCAD, the market reached 1.3742 in a growth wave, achieving a local target. Today, 20 June 2025, a correction to 1.3660 is expected. After this, the next growth wave may continue to 1.3777 as the first target.
The Elliott wave structure and the growth wave matrix with a pivot at 1.3666 support this scenario and mark it as key for the USDCAD structure. At present, the market has completed a local growth wave to the upper boundary of the price Envelope at 1.3742. Today, a correction to the lower boundary at 1.3660 is relevant, followed by a continuation to the upper boundary at 1.3777.
Technical indicators for today’s USDCAD forecast suggest a correction to 1.3660.
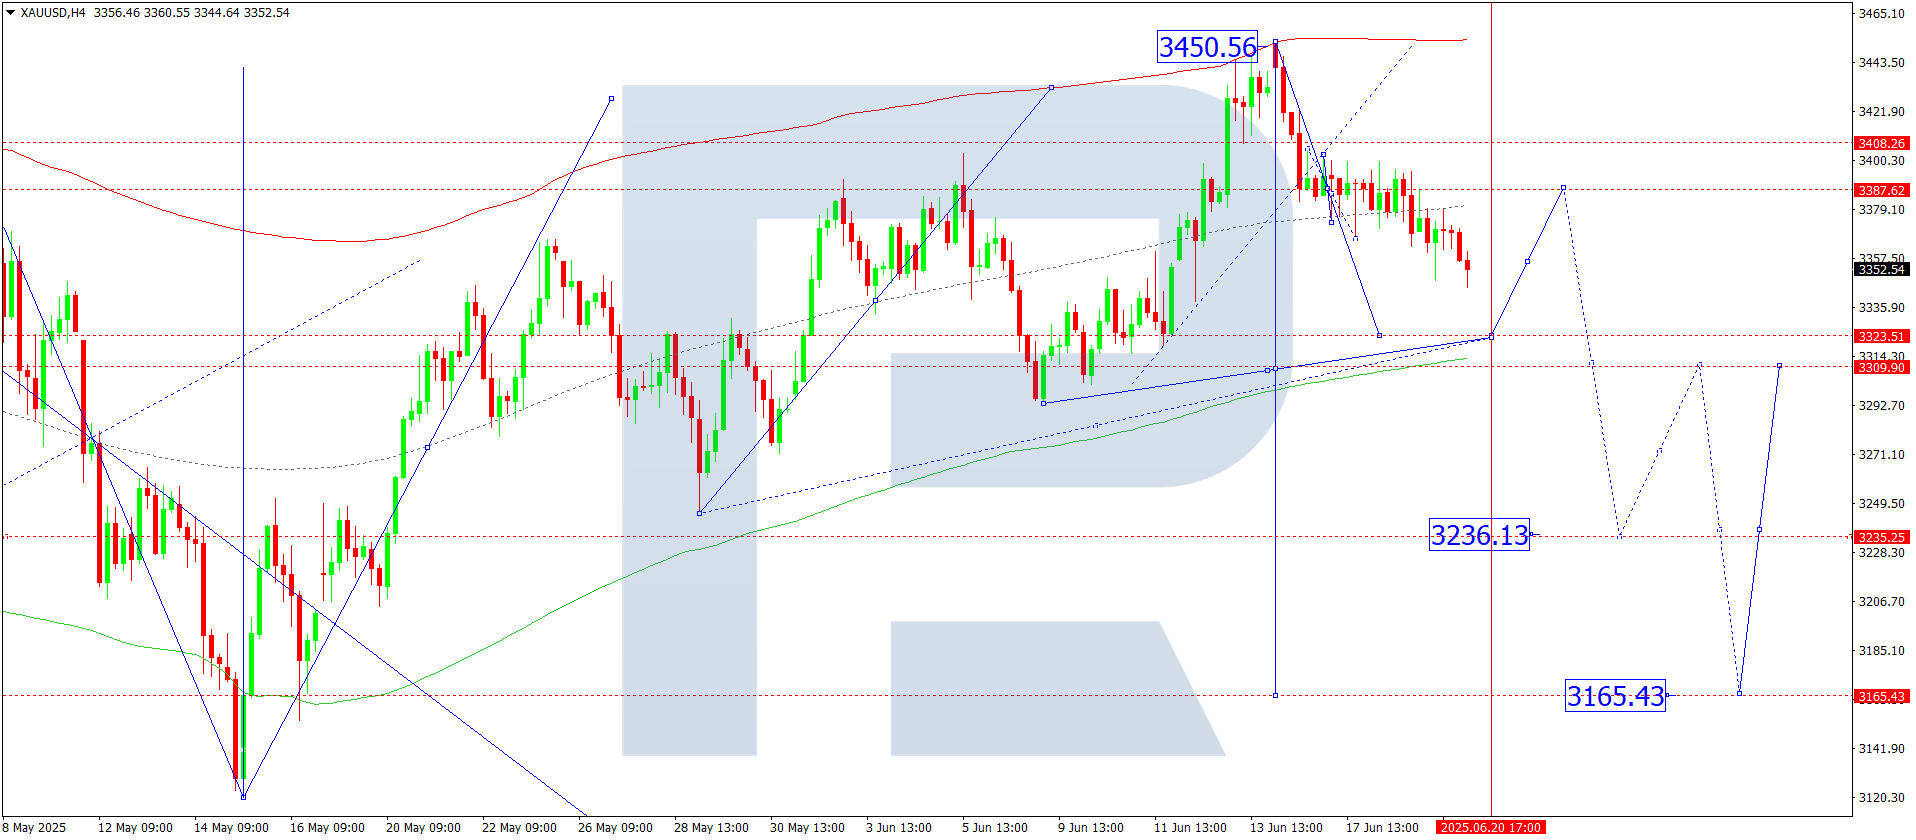
XAUUSD forecast
On the H4 chart of XAUUSD, the market broke below 3,380 and continues a downward wave towards 3,323. Today, 20 June 2025, the market is expected to reach this target level. Afterwards, a new upward wave to 3,388 may begin.
The Elliott wave structure and the decline matrix with a pivot at 3,388 support this scenario, which is considered key for XAUUSD in this wave. Currently, the market broke below the central line of the price Envelope at 3,388. Today, the downward wave could continue to the lower boundary at 3,323.
Technical indicators for today’s XAUUSD forecast point to a continued decline to 3,323.
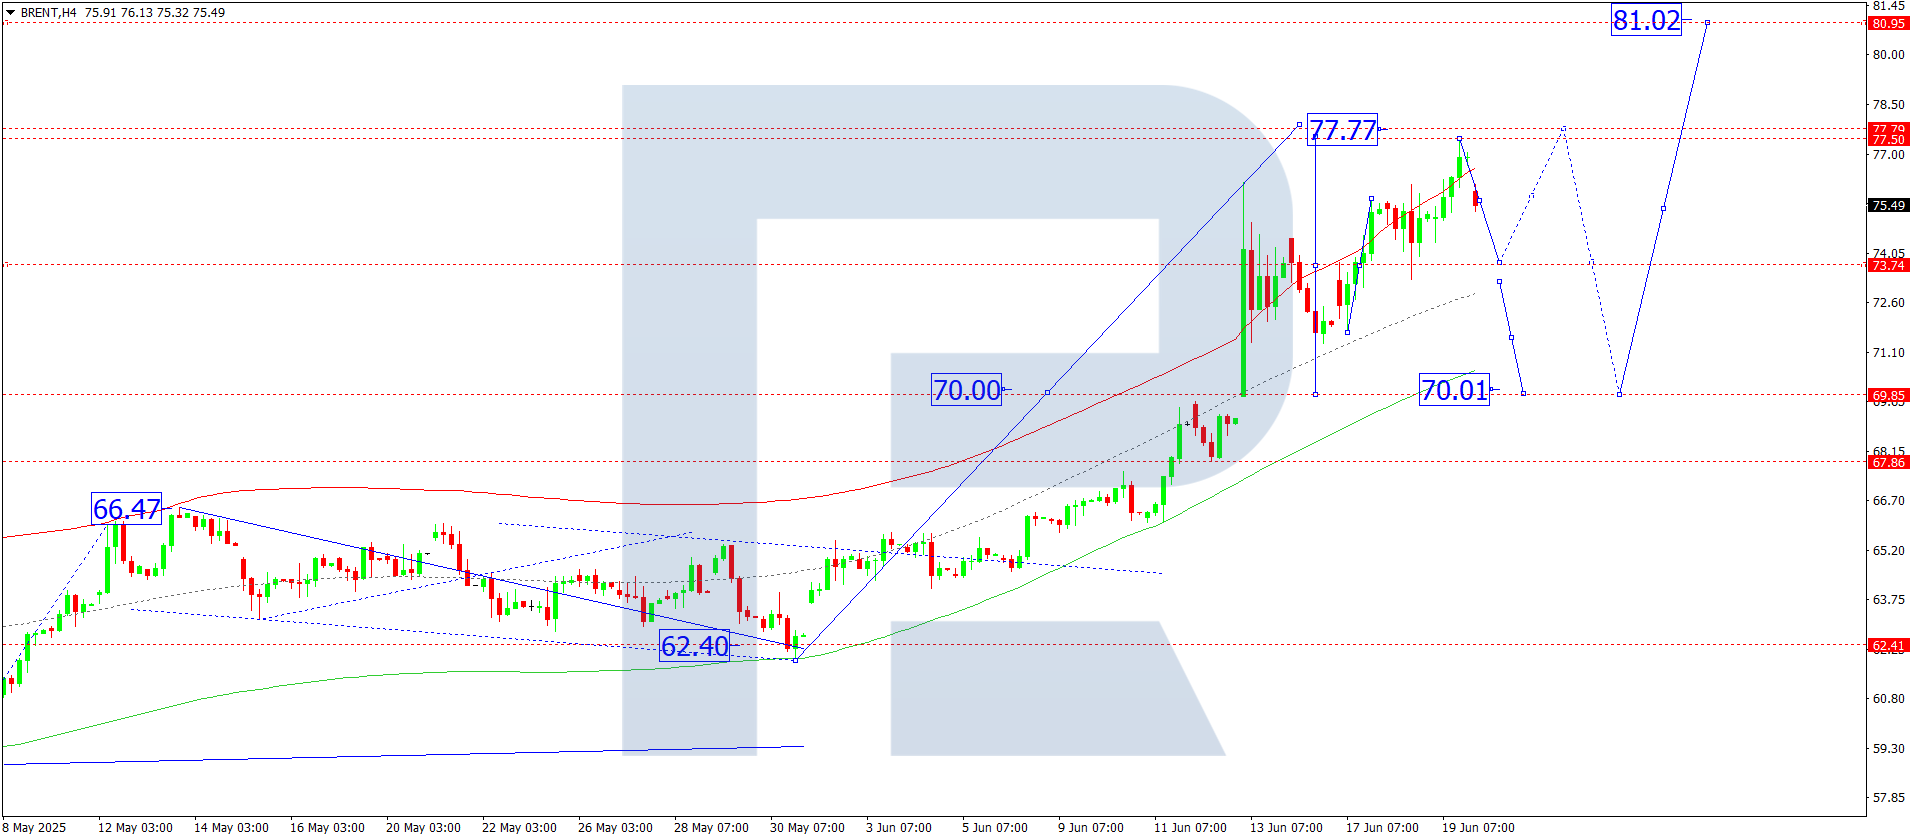
Brent forecast
On the H4 chart of Brent crude, the market reached 77.50 in a growth wave, achieving a local target. Today, 20 June 2025, a correction to 73.75 is not ruled out. Afterwards, a further rise to 77.77 is expected as the first target.
The Elliott wave structure and growth matrix with a pivot at 70.00 confirm this scenario, which is seen as key for Brent in this wave. Currently, the market is forming a growth structure to the upper boundary of the price Envelope at 77.77. Afterwards, a correction to the lower boundary at 70.00 may follow.
Technical indicators for today’s Brent forecast suggest a growth wave to 77.77.
Forecasts presented in this section only reflect the author’s private opinion and should not be considered as guidance for trading. RoboForex bears no responsibility for trading results based on trading recommendations described in these analytical reviews.