Daily technical analysis and forecast for 9 June 2025
Here is a detailed daily technical analysis and forecast for EURUSD, USDJPY, GBPUSD, AUDUSD, USDCAD, XAUUSD and Brent for 9 June 2025.
EURUSD forecast
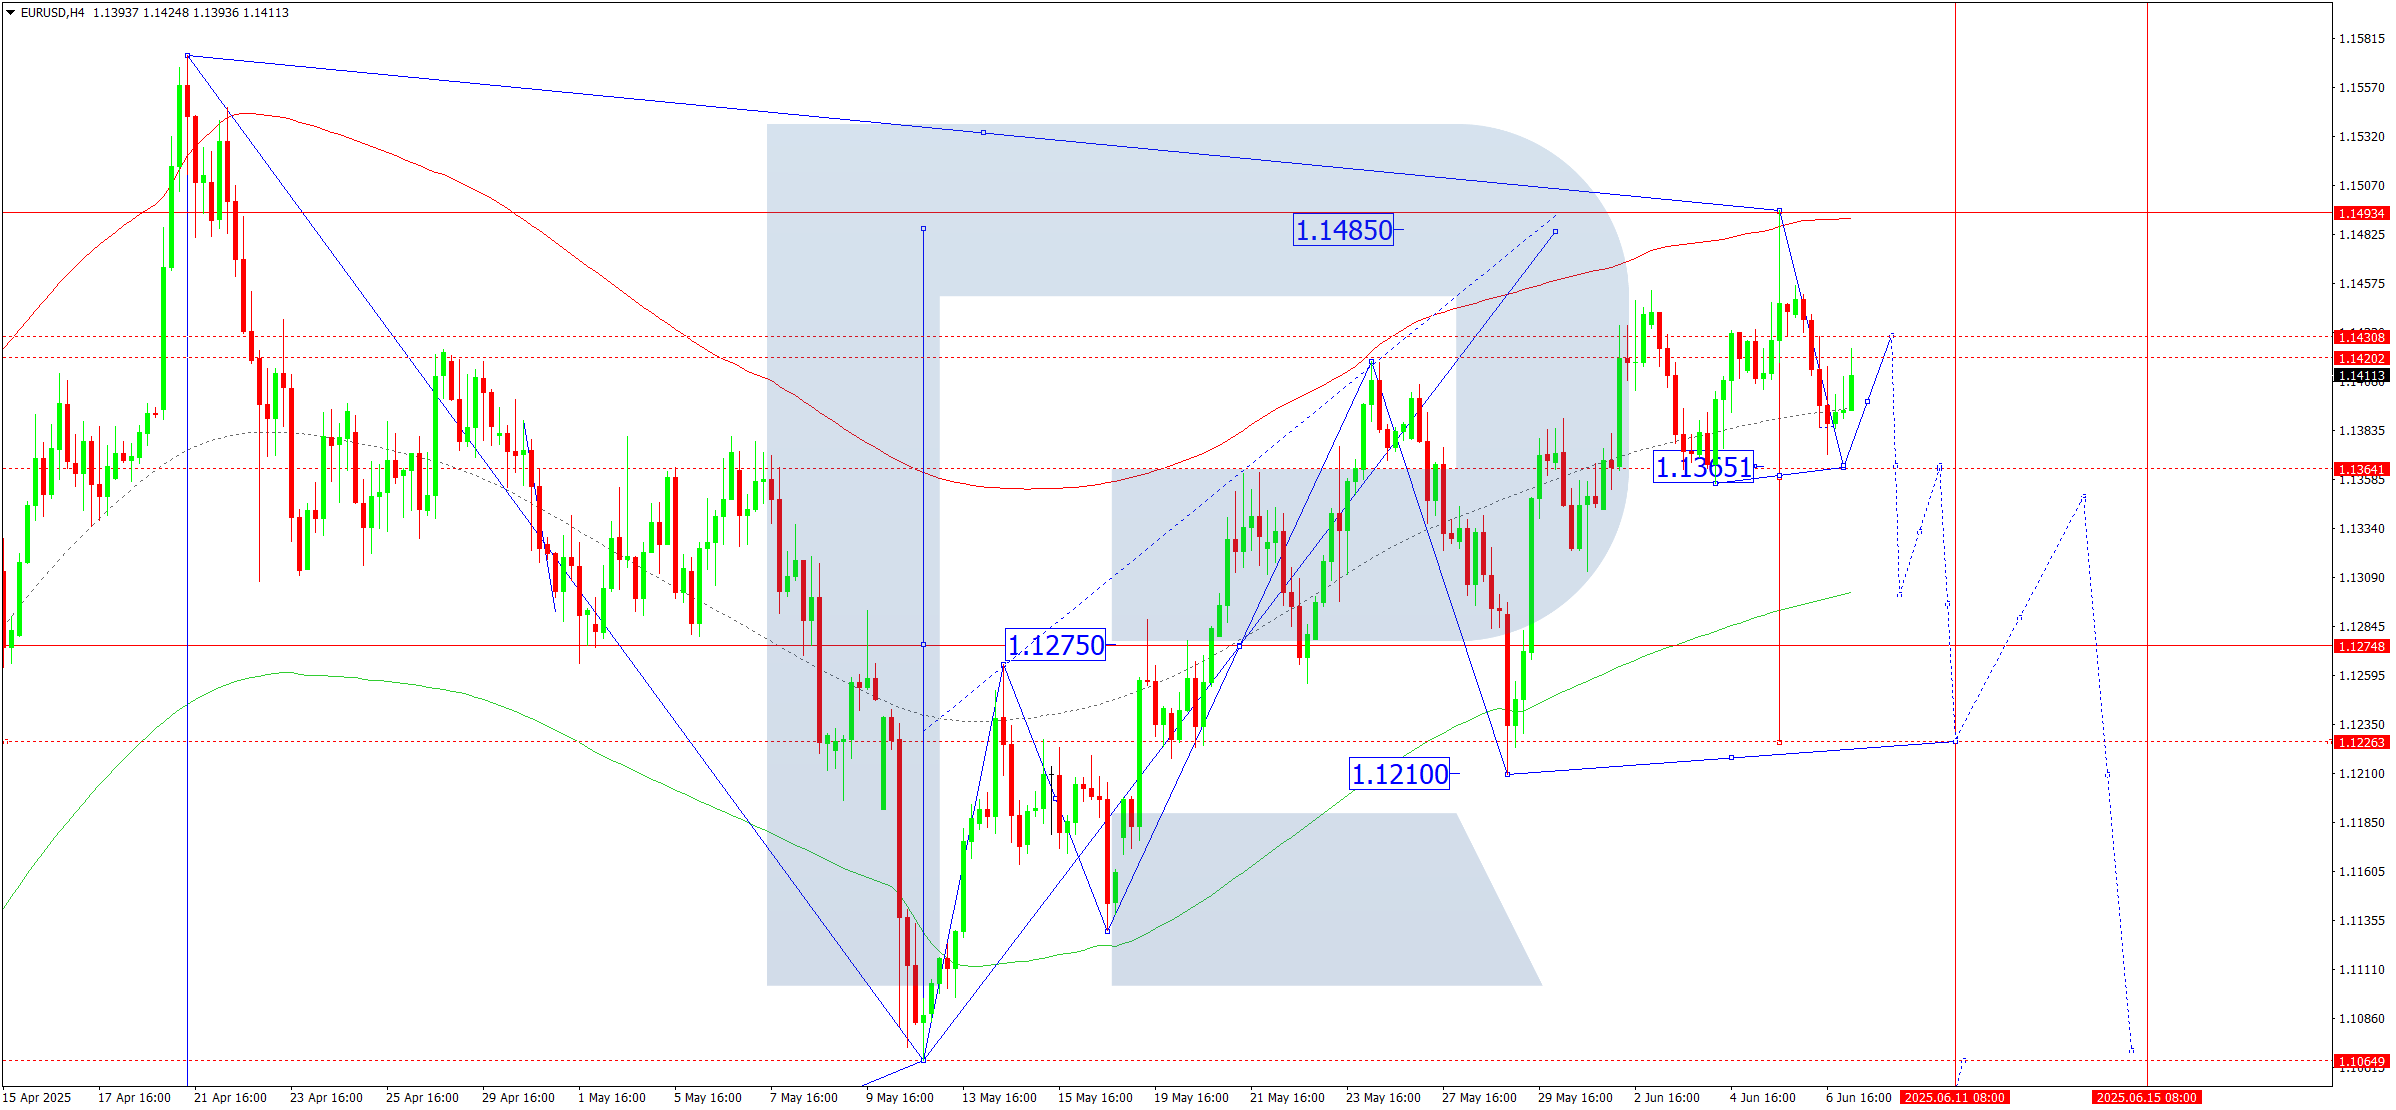
On the H4 chart of EURUSD, the market is shaping a downward wave towards 1.1365. Today, 9 June 2025, this target is expected to be reached, followed by a correction to 1.1430. A consolidation range may develop between these levels. If the price breaks upward, the structure could stretch to 1.1515. A downward breakout would suggest a decline towards 1.1275, which is the local target.
This outlook is supported by the Elliott wave structure and the growth wave matrix with a pivot at 1.1275, considered key in this wave for EURUSD. The growth wave reached the upper boundary of the Price Envelope at 1.1494. Today, a decline towards the central line at 1.1365 is anticipated, with potential continuation of the trend to the lower boundary at 1.1275 as the first target.
Technical indicators for today’s EURUSD forecast suggest a decline to 1.1365 and a correction to 1.1430.
USDJPY forecast
On the H4 chart of USDJPY, the market continues consolidating around 144.00, having recently reached 145.00. Today, 9 June 2025, a pullback to 144.00 is expected. Afterwards, a move to 145.50 is possible. A downward breakout would imply a further decline to 142.20, while an upward breakout may extend the trend to 148.60.
This scenario is confirmed by the Elliott wave structure and the growth wave matrix with a pivot at 144.00, seen as key in this wave. The market hit the local growth target at 145.00 and a technical return to the central line of the Price Envelope at 144.00 is now likely. Afterwards, a growth wave may develop towards the upper boundary at 145.50.
Technical indicators for today’s USDJPY forecast suggest a correction to 144.00 and a growth wave to 145.50.

GBPUSD forecast
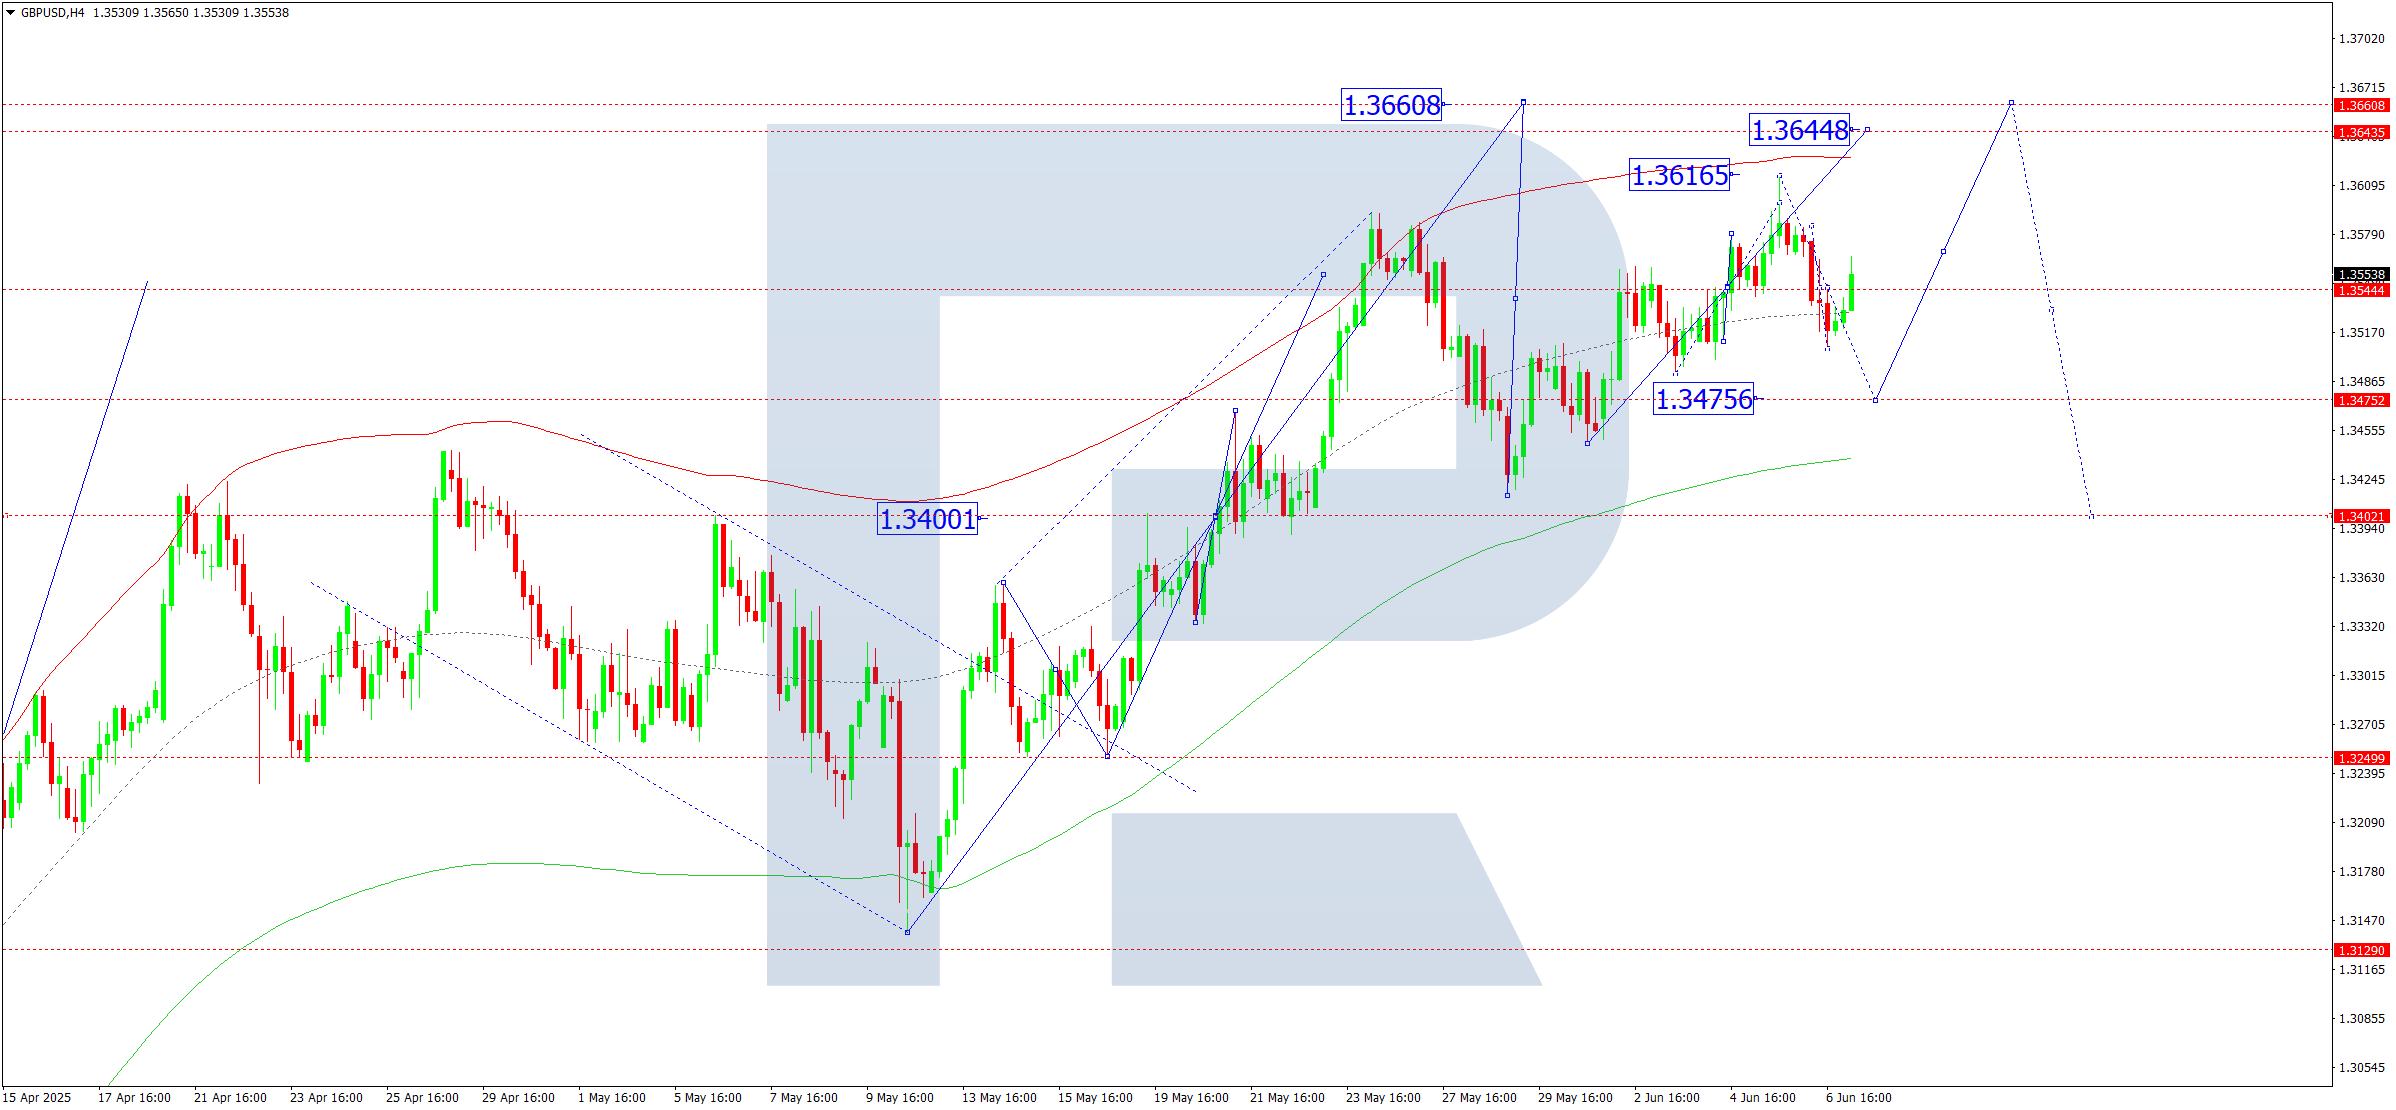
On the H4 chart of GBPUSD, the market is forming a consolidation range around 1.3544. Today, 9 June 2025, a decline to 1.3477 is expected, followed by a rebound to 1.3544. A breakout downwards could initiate a move to 1.3400. An upward breakout may stretch the wave towards 1.3644.
The Elliott wave structure and the growth matrix with a pivot at 1.3400 support this view, considered key in this wave. Currently, the market is consolidating around the central line of the Price Envelope at 1.3544. A move to its lower boundary at 1.3477 is likely, with a subsequent rise to the upper boundary at 1.3644.
Technical indicators for today’s GBPUSD forecast suggest a decline to 1.3477.
AUDUSD forecast
On the H4 chart of AUDUSD, the market completed a drop to 0.6488 followed by a correction to 0.6514. Today, 9 June 2025, a new decline to 0.6446 is expected. A subsequent growth wave towards 0.6500 may follow. The market is likely to continue developing a consolidation range around this level.
This scenario is supported by the Elliott wave structure and the growth wave matrix with a pivot at 0.6446, seen as key in this wave. The market recently reached the central line of the Price Envelope at 0.6488. Today, a correction to 0.6514 and a new decline to the lower boundary at 0.6446 are possible.
Technical indicators for today’s AUDUSD forecast suggest a decline to 0.6446.

USDCAD forecast
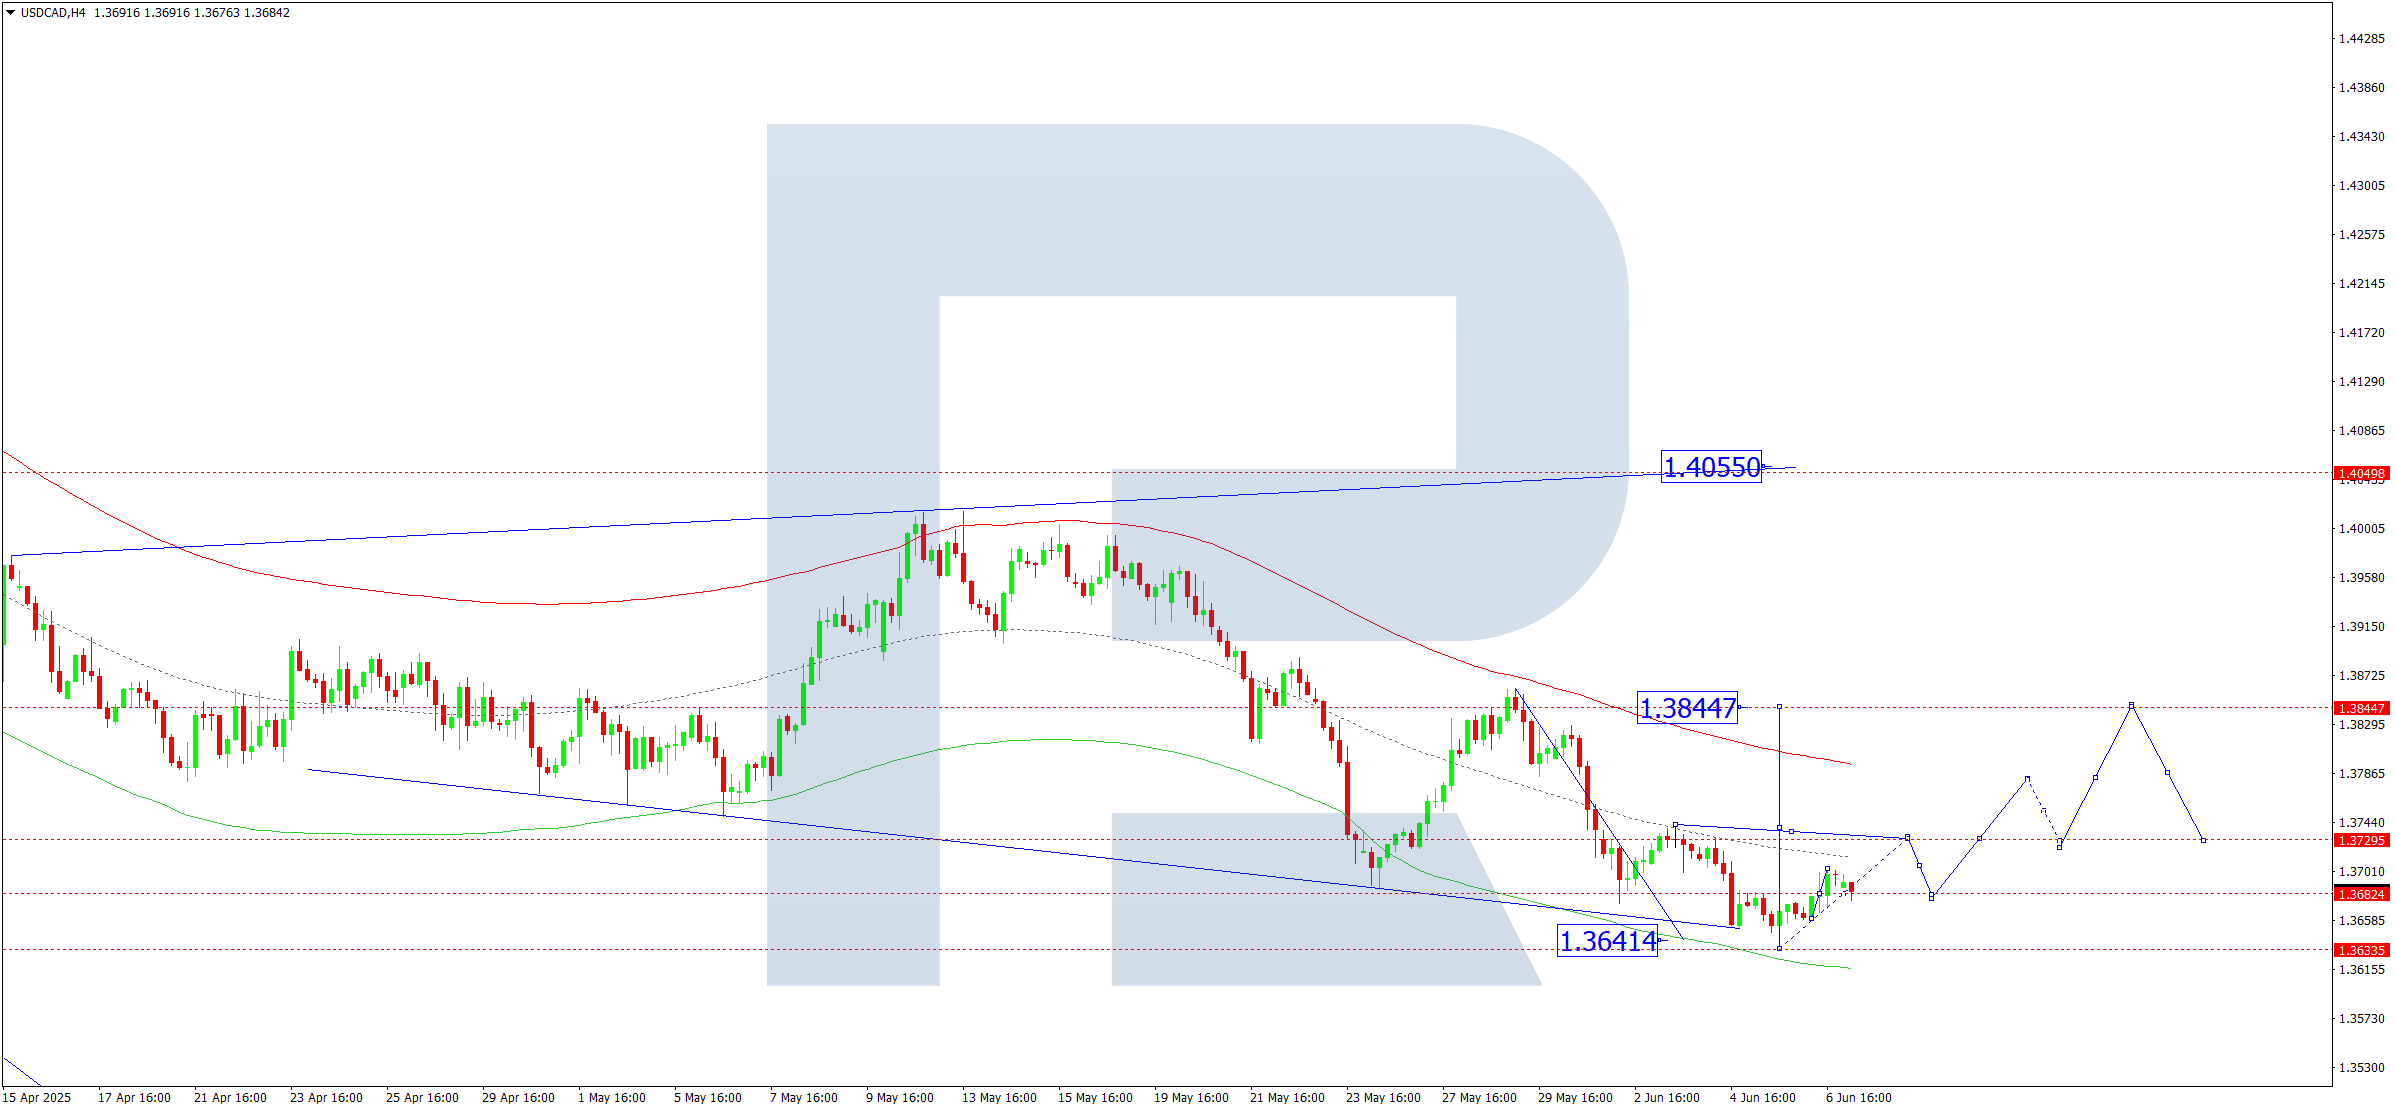
On the H4 chart of USDCAD, the market reached a low at 1.3633. Today, 9 June 2025, a consolidation range may form at this bottom. A breakout upwards could open potential for a growth wave to 1.3844, the first target.
The Elliott wave structure and the decline wave matrix with a pivot at 1.3860 confirm this view, considered key for USDCAD. The market has completed the fifth downward wave to the lower boundary of the Price Envelope at 1.3633. A rebound to the central line at 1.3745 is expected today.
Technical indicators for today’s USDCAD forecast suggest a rebound to 1.3745.
XAUUSD forecast
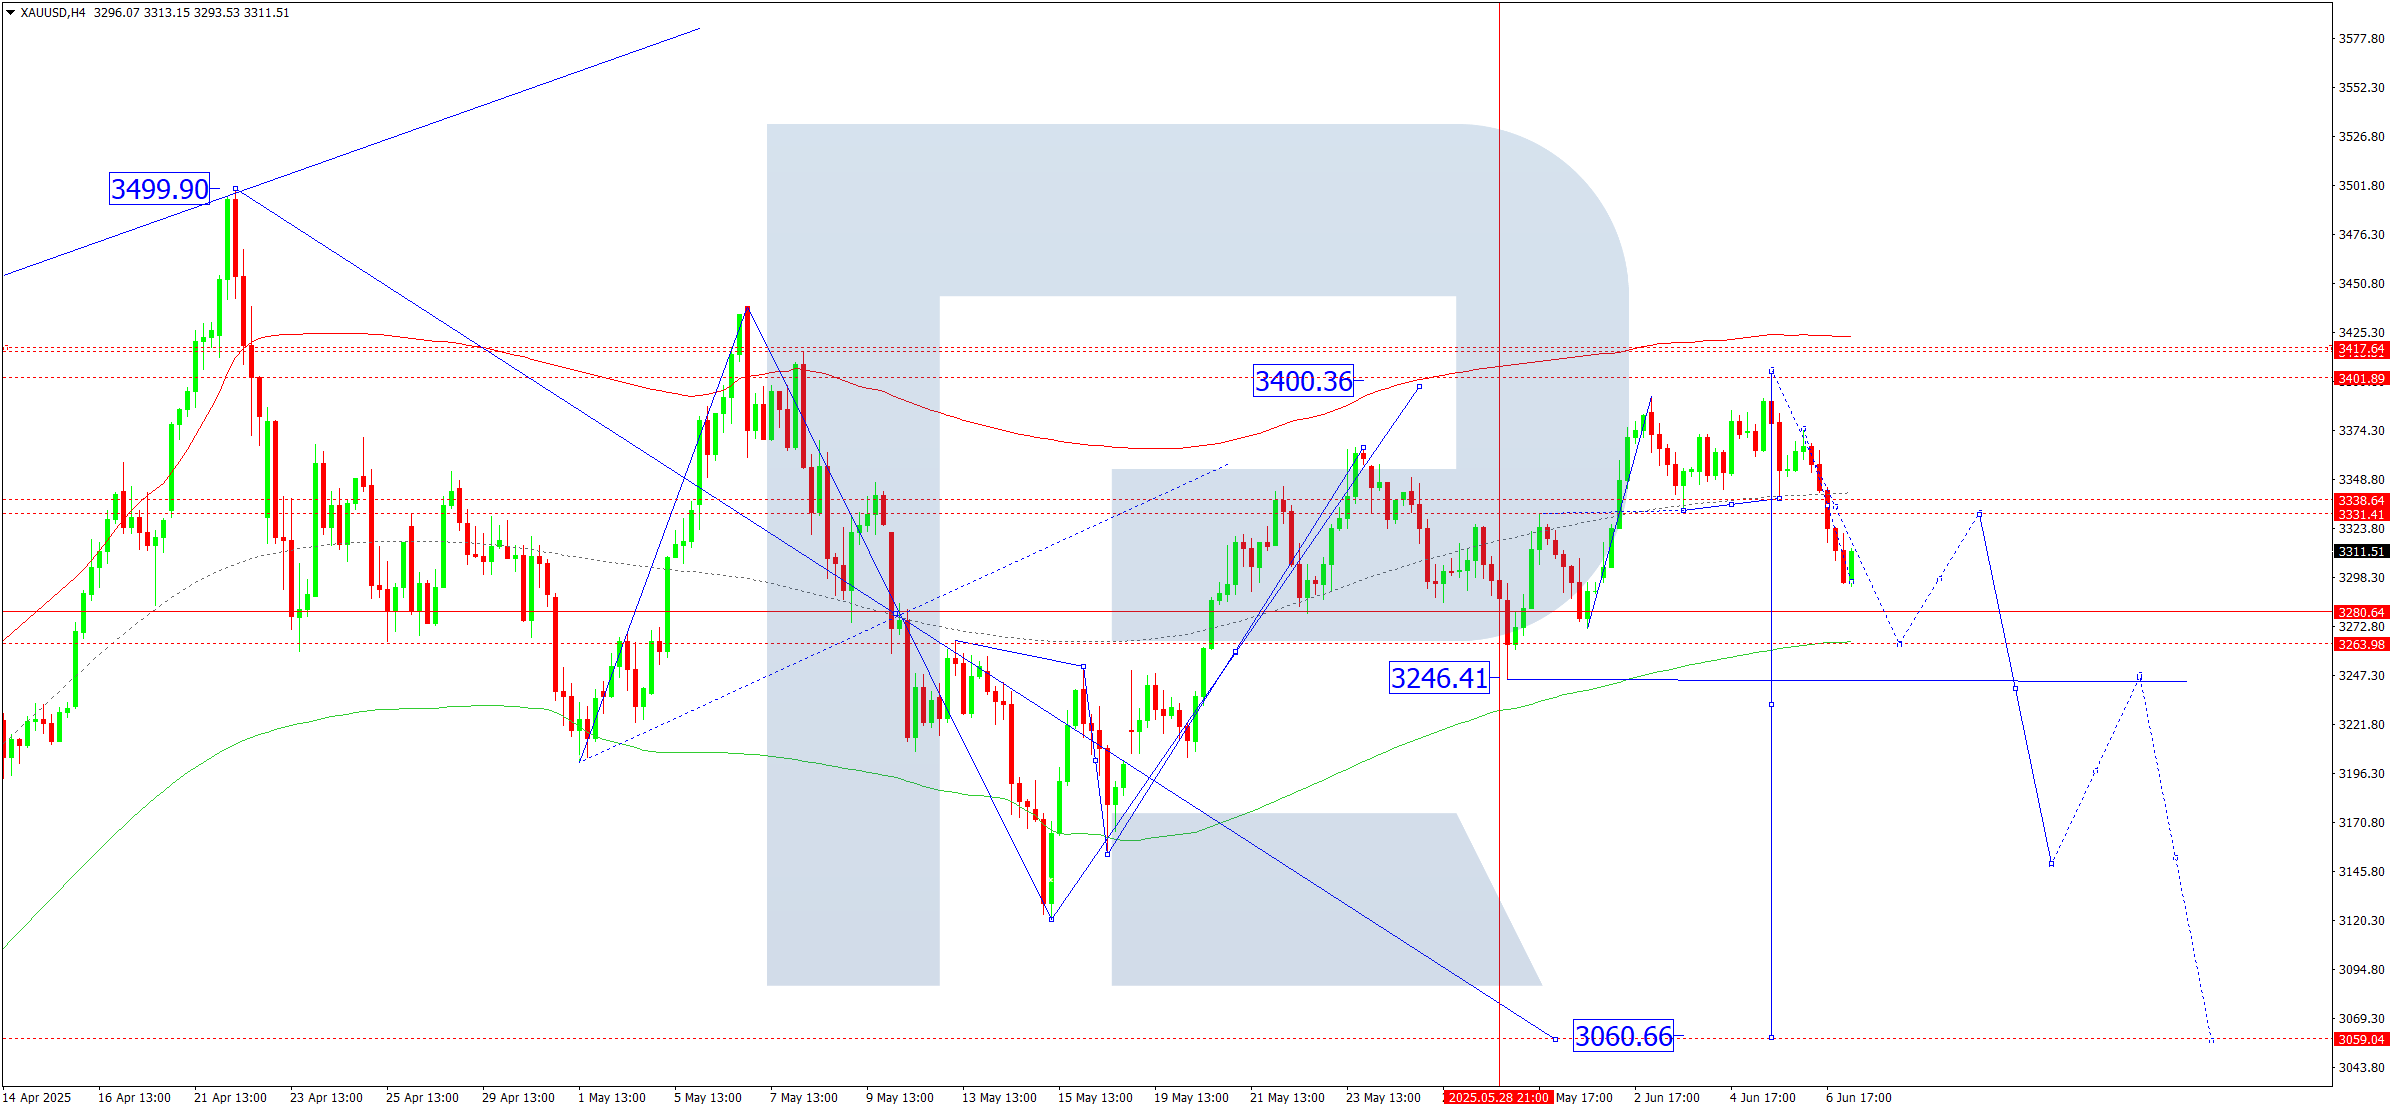
On the H4 chart of XAUUSD, the market broke below 3338 and declined to 3293. Today, 9 June 2025, a rebound to test 3333 from below is likely. Afterwards, a new downward wave may extend to 3263, the first target.
This scenario is supported by the Elliott wave structure and the decline matrix with a pivot at 3280, seen as key in this wave. The market is shaping the fifth wave of a correction towards the upper boundary of the Price Envelope at 3400. Today, the continuation of a decline towards the lower boundary at 3263 is likely.
Technical indicators for today’s XAUUSD forecast suggest a further drop to 3263.
Brent forecast
On the H4 Brent crude chart, the market continues consolidating around 65.00. Today, 9 June 2025, the market reached 66.33. A pullback to 65.00 (testing from above) is expected. A breakout upward may open potential for a rise to 68.00, with a continued trend towards 69.70 as the local target.
This scenario is confirmed by the Elliott wave structure and the growth matrix with a pivot at 65.00, considered key in this wave. The market is forming a growth structure towards the upper boundary of the Price Envelope at 68.00. A new consolidation range may then form before a continued trend to 69.70.
Technical indicators for today’s Brent forecast suggest a correction to 65.00 followed by a rise to 68.00.

Forecasts presented in this section only reflect the author’s private opinion and should not be considered as guidance for trading. RoboForex bears no responsibility for trading results based on trading recommendations described in these analytical reviews.