Daily technical analysis and forecast for 5 June 2025
Here is a detailed daily technical analysis and forecast for EURUSD, USDJPY, GBPUSD, AUDUSD, USDCAD, XAUUSD and Brent for 5 June 2025.
EURUSD forecast
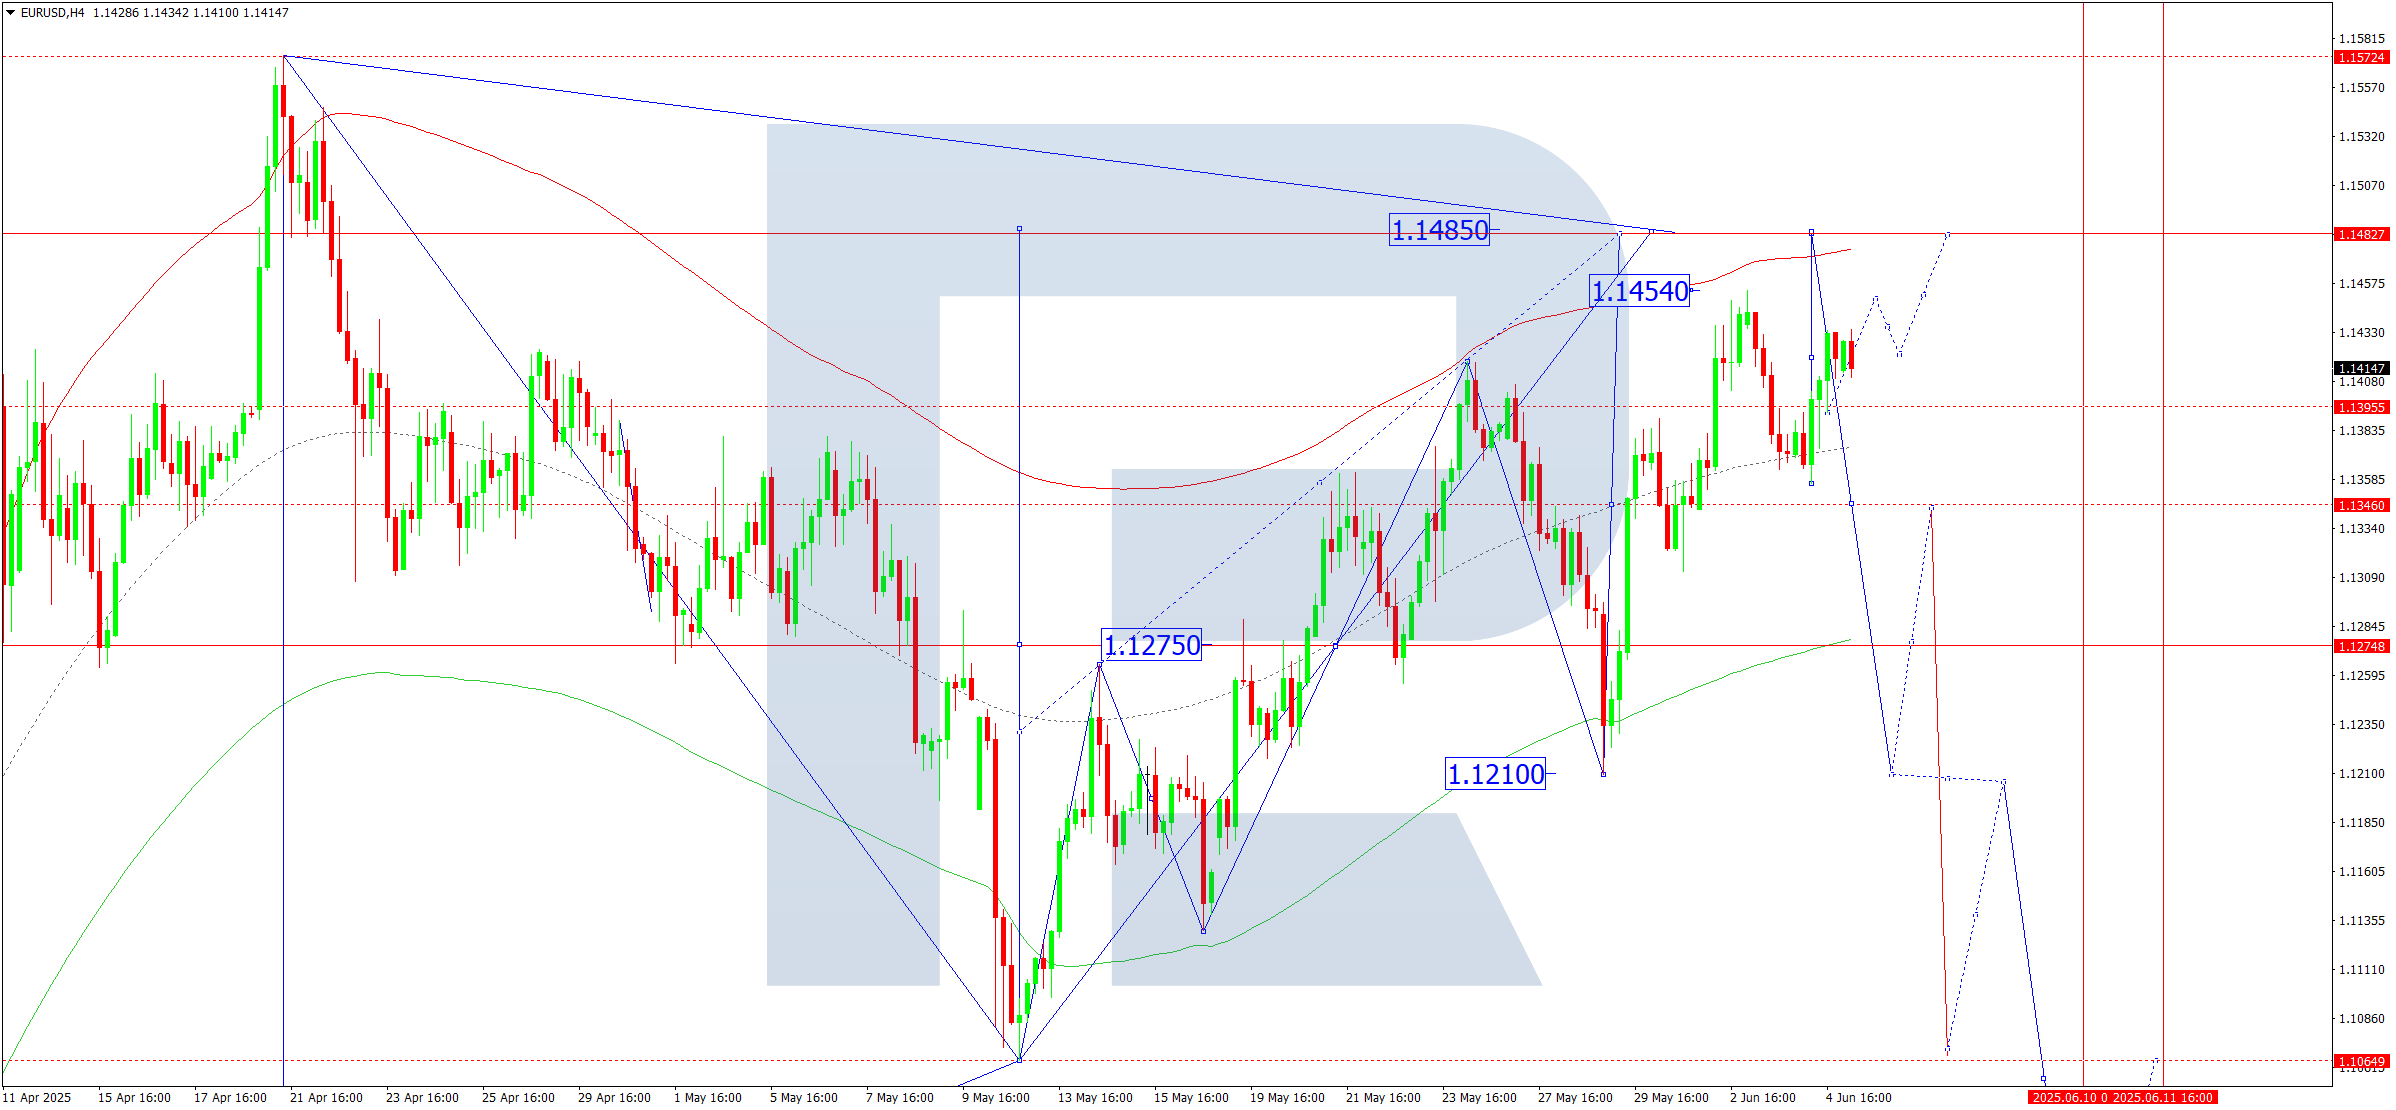
On the H4 chart of EURUSD, the market completed a growth wave to 1.1434. Today, 5 June 2025, a pullback to 1.1395 is expected, forming a possible consolidation range between these levels. An upward breakout may extend the wave towards the main target at 1.1485. If the price moves down, it may drop to 1.1346 before resuming growth to 1.1485.
This scenario is supported by the Elliott wave structure and the growth wave matrix with a pivot at 1.1275, considered key in this wave. Currently, the fifth upward structure is developing towards the upper boundary of the price Envelope at 1.1485. Today, the focus will be on a possible consolidation above the central line. If the price breaks out of this range to the upside, the trend may continue towards 1.1485. Later, a new downward wave may begin towards the lower boundary at 1.1210, the first target.
Technical indicators for today’s EURUSD forecast suggest a continuation of the growth wave to 1.1485.
USDJPY forecast
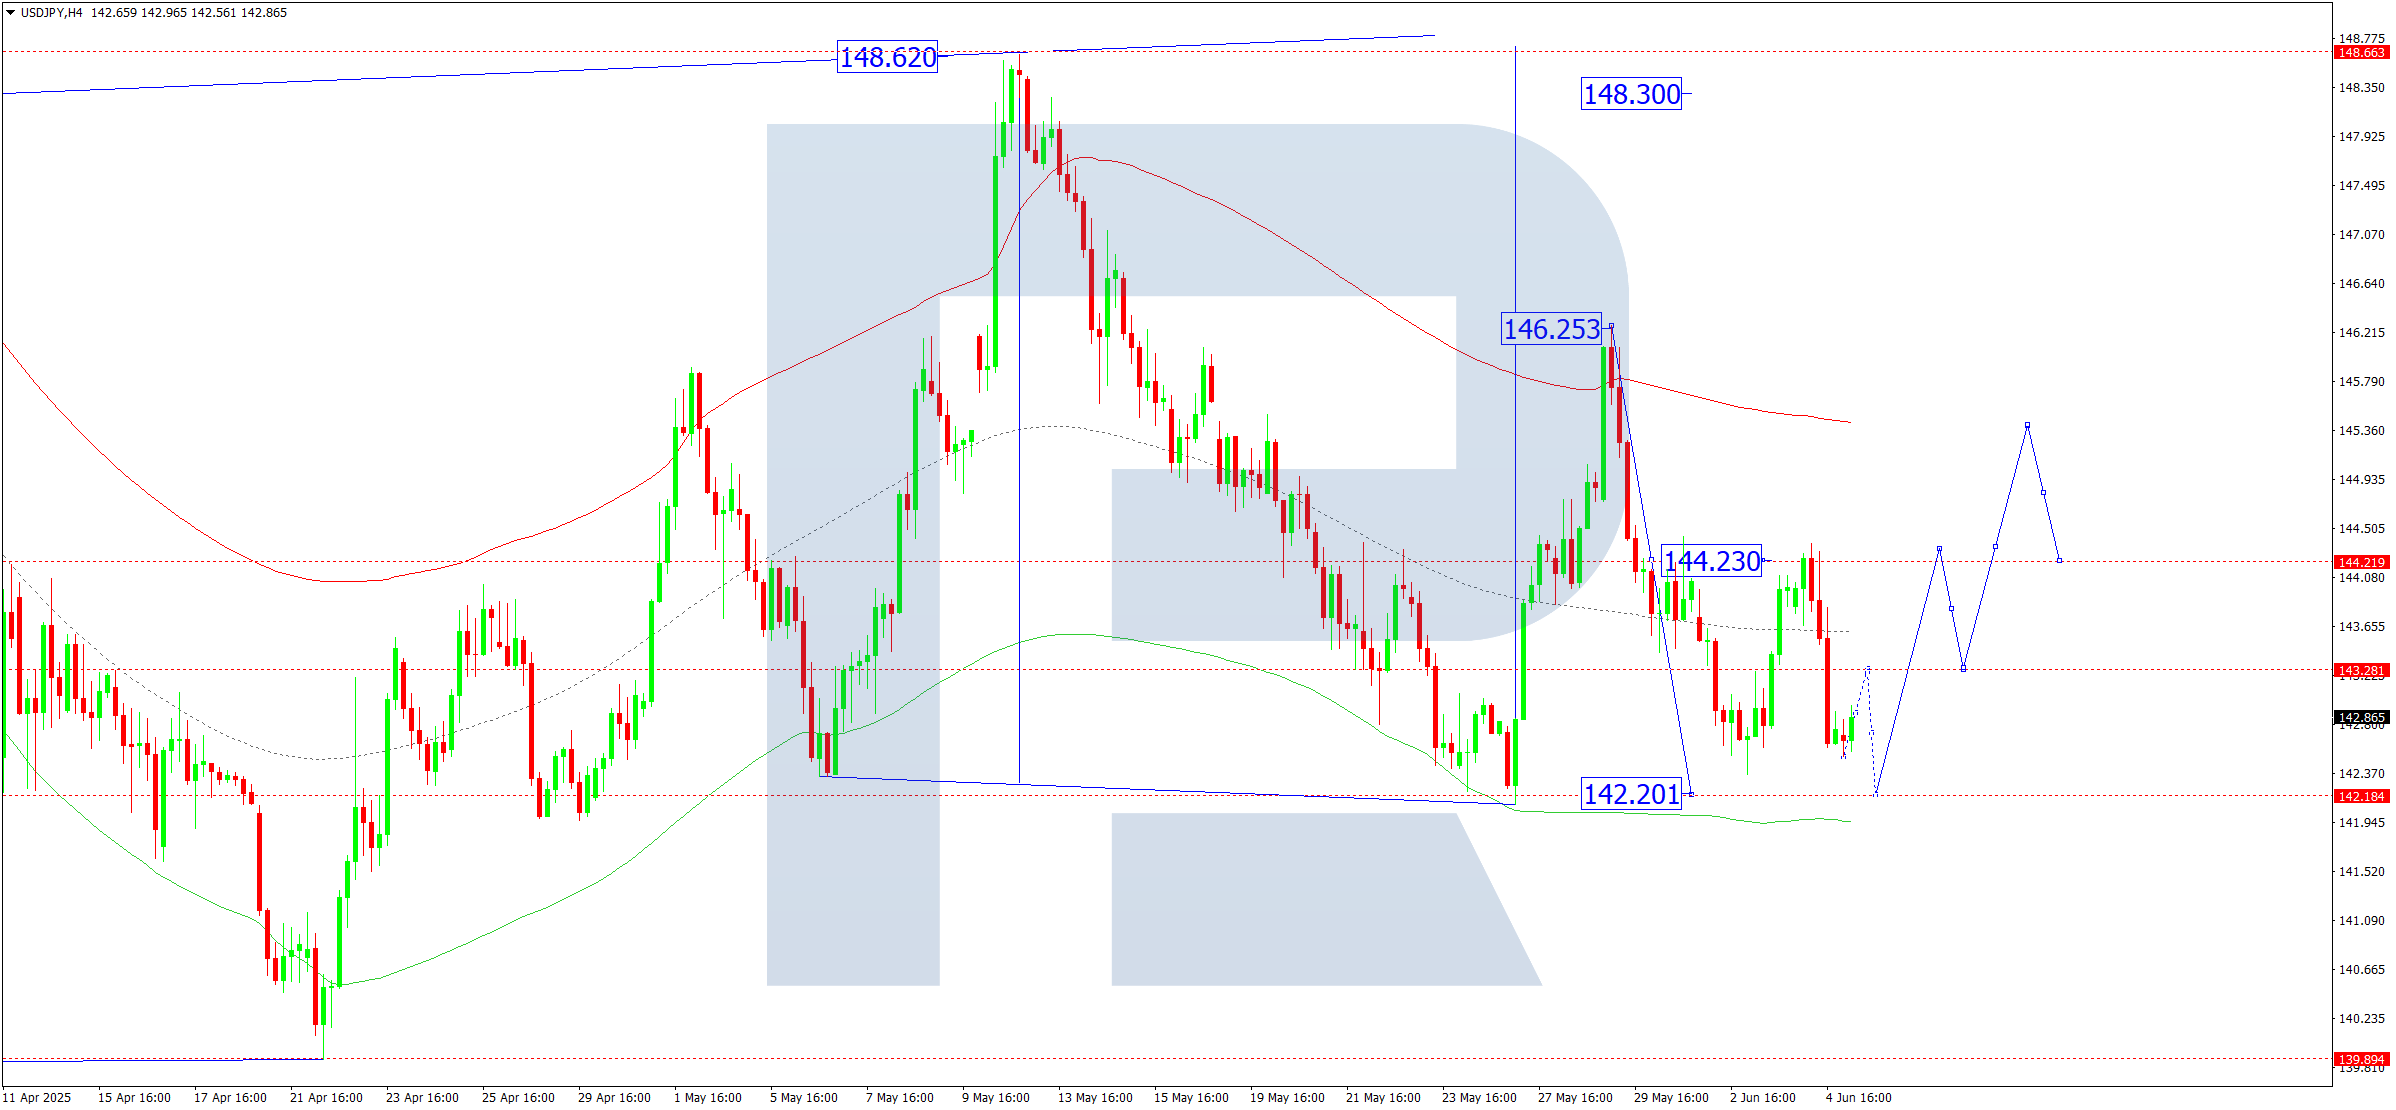
On the H4 chart of USDJPY, the market completed a downward wave to 142.53. Today, 5 June 2025, a bounce to 143.30 is anticipated. Then, another decline to 142.20 is expected, followed by a rebound to 144.34. This forms a broad consolidation range around 144.34.
This scenario is supported by the Elliott wave structure and the downward wave matrix with a pivot at 144.34, seen as key in this wave. The market has already made a technical return to the central line of the price Envelope at 144.34. Today, the forecast considers the continuation of the downward wave to the lower boundary at 142.20.
Technical indicators for today’s USDJPY forecast suggest a move down to 142.20.
GBPUSD forecast
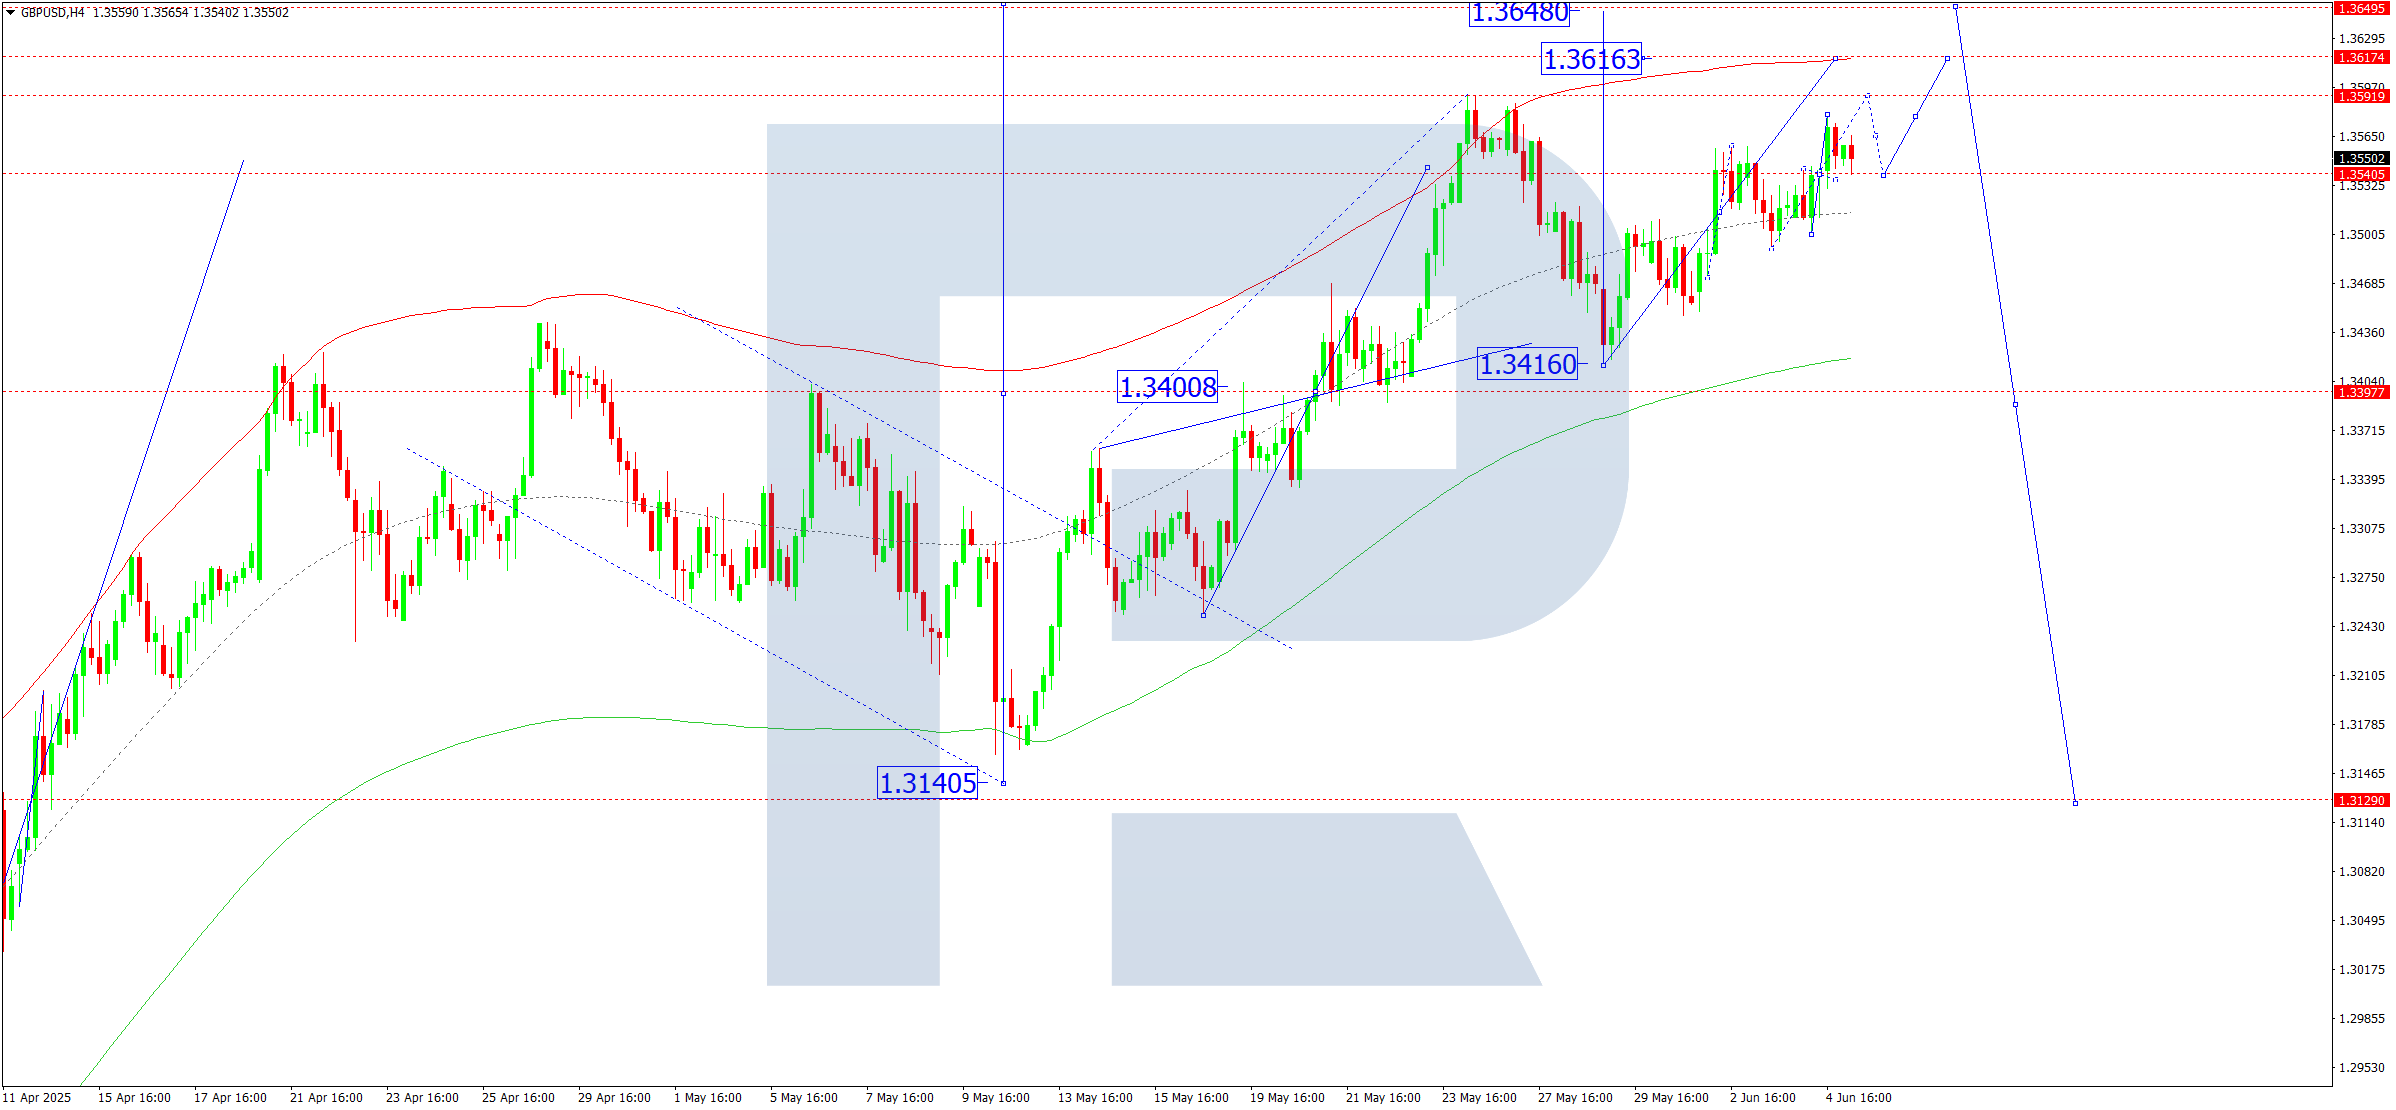
On the H4 chart of GBPUSD, the market reached 1.3579. Today, 5 June 2025, a pullback to 1.3540 is expected. The wave may then continue to 1.3616, with a potential extension to 1.3648. Afterwards, a decline to 1.3400 is possible.
This scenario is technically supported by the Elliott wave structure and the growth wave matrix with a pivot at 1.3400, viewed as key. The market is consolidating around the central line at 1.3540. If the price breaks down, the correction may extend to the lower boundary at 1.3500. From there, a new wave to the upper boundary at 1.3648 may follow. If it breaks upward now, the trend might immediately continue to 1.3648.
Technical indicators for today’s GBPUSD forecast suggest growth to 1.3616 and 1.3648.
AUDUSD forecast
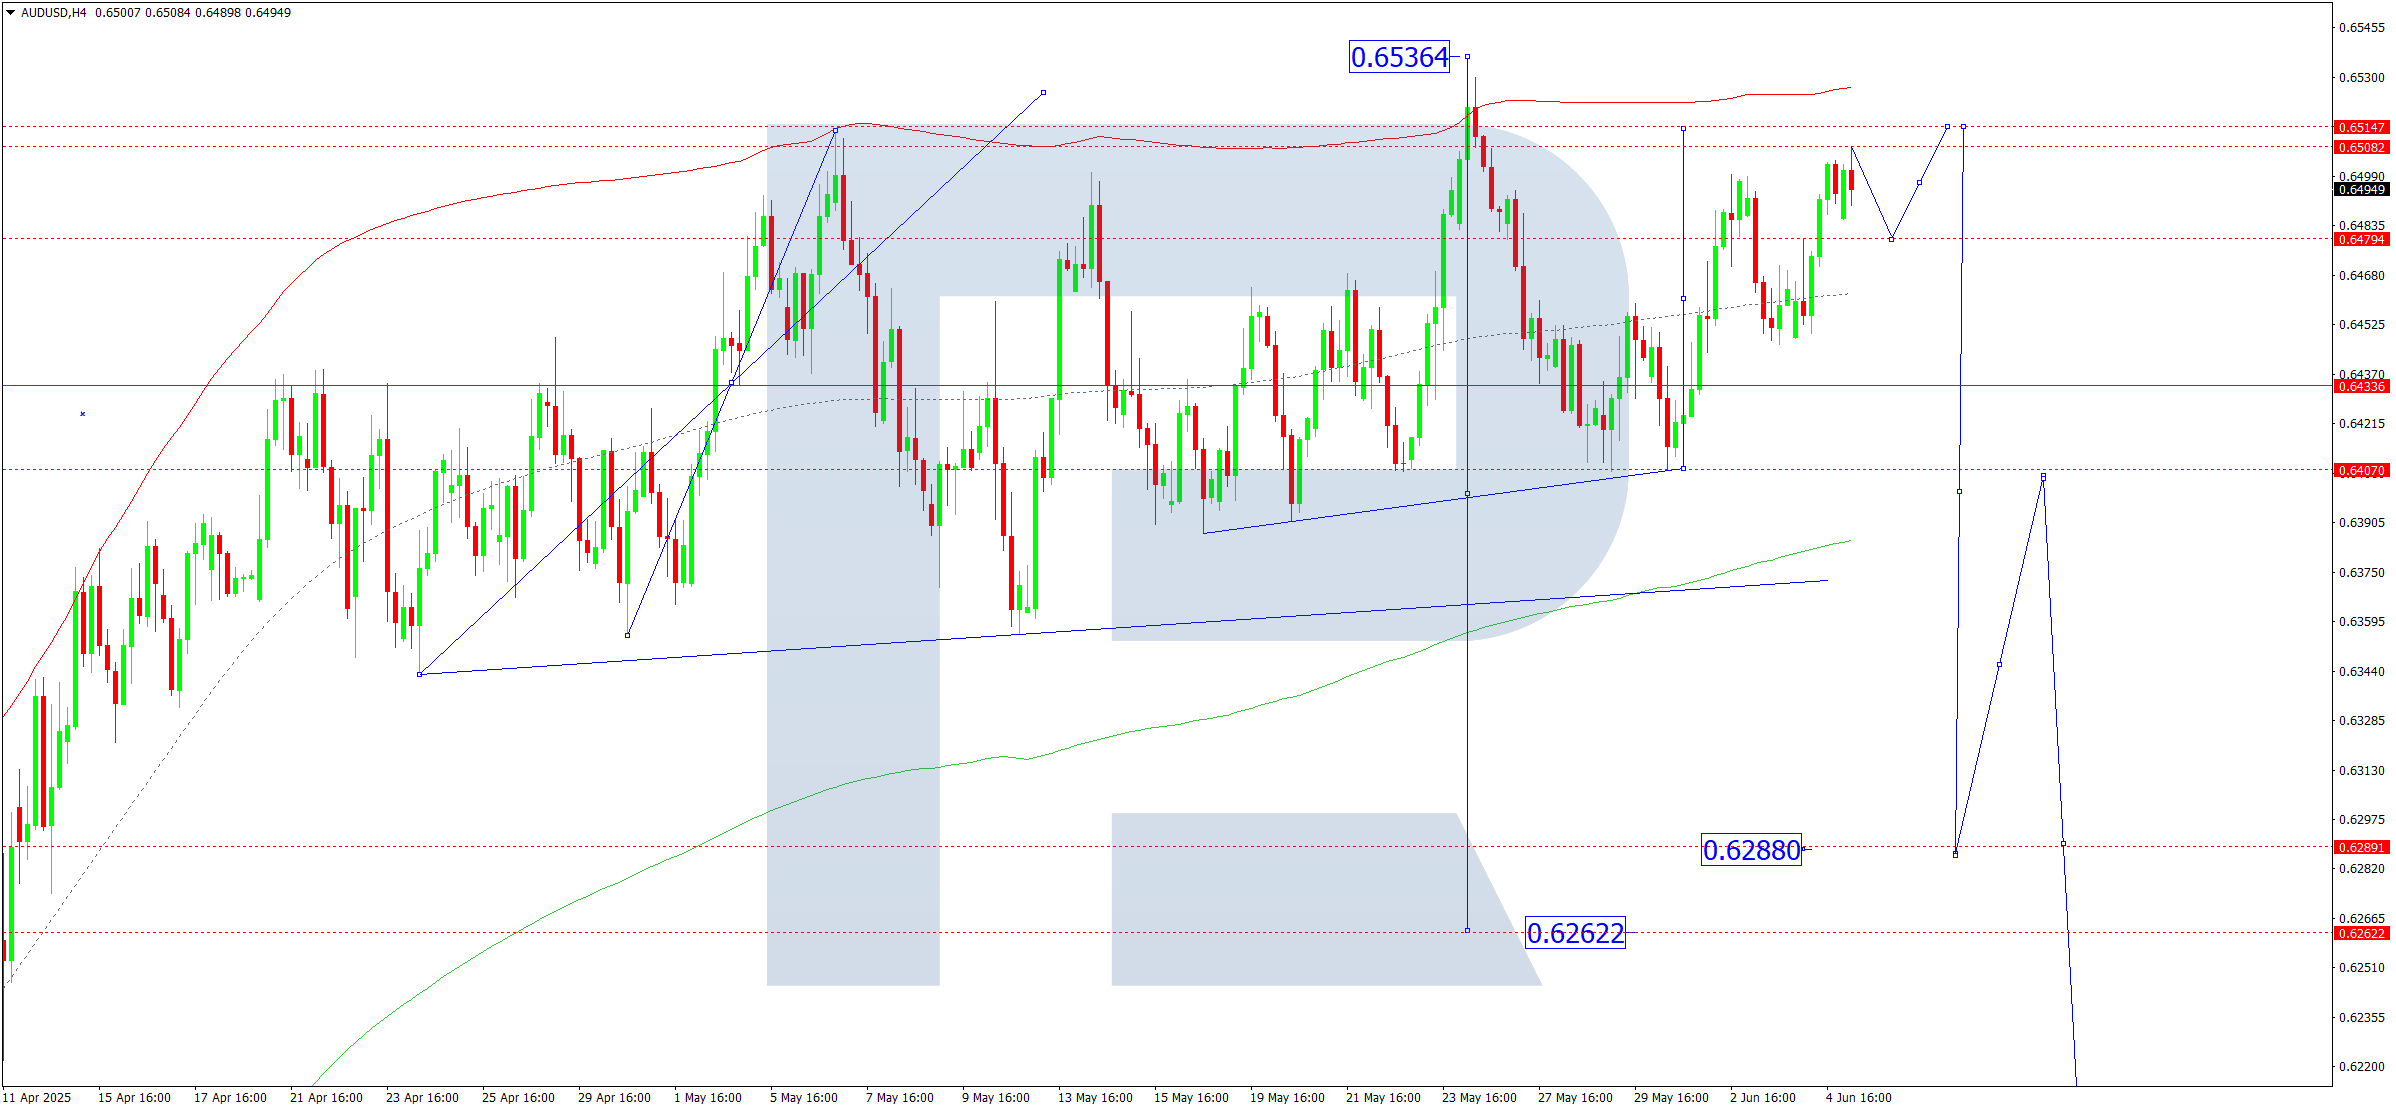
On the H4 chart of AUDUSD, the market completed a growth wave to 0.6508. Today, 5 June 2025, a pullback to 0.6475 is expected. Then, a new upward move towards 0.6515 could follow, which will exhaust the growth potential of this wave.
This scenario is supported by the Elliott wave structure and the growth wave matrix with a pivot at 0.6434, seen as key. The market is consolidating around the central line of the price Envelope at 0.6460. Today, a continuation of the growth wave to the upper boundary at 0.6515 is possible.
Technical indicators for today’s AUDUSD forecast suggest a potential move to 0.6515.
USDCAD forecast
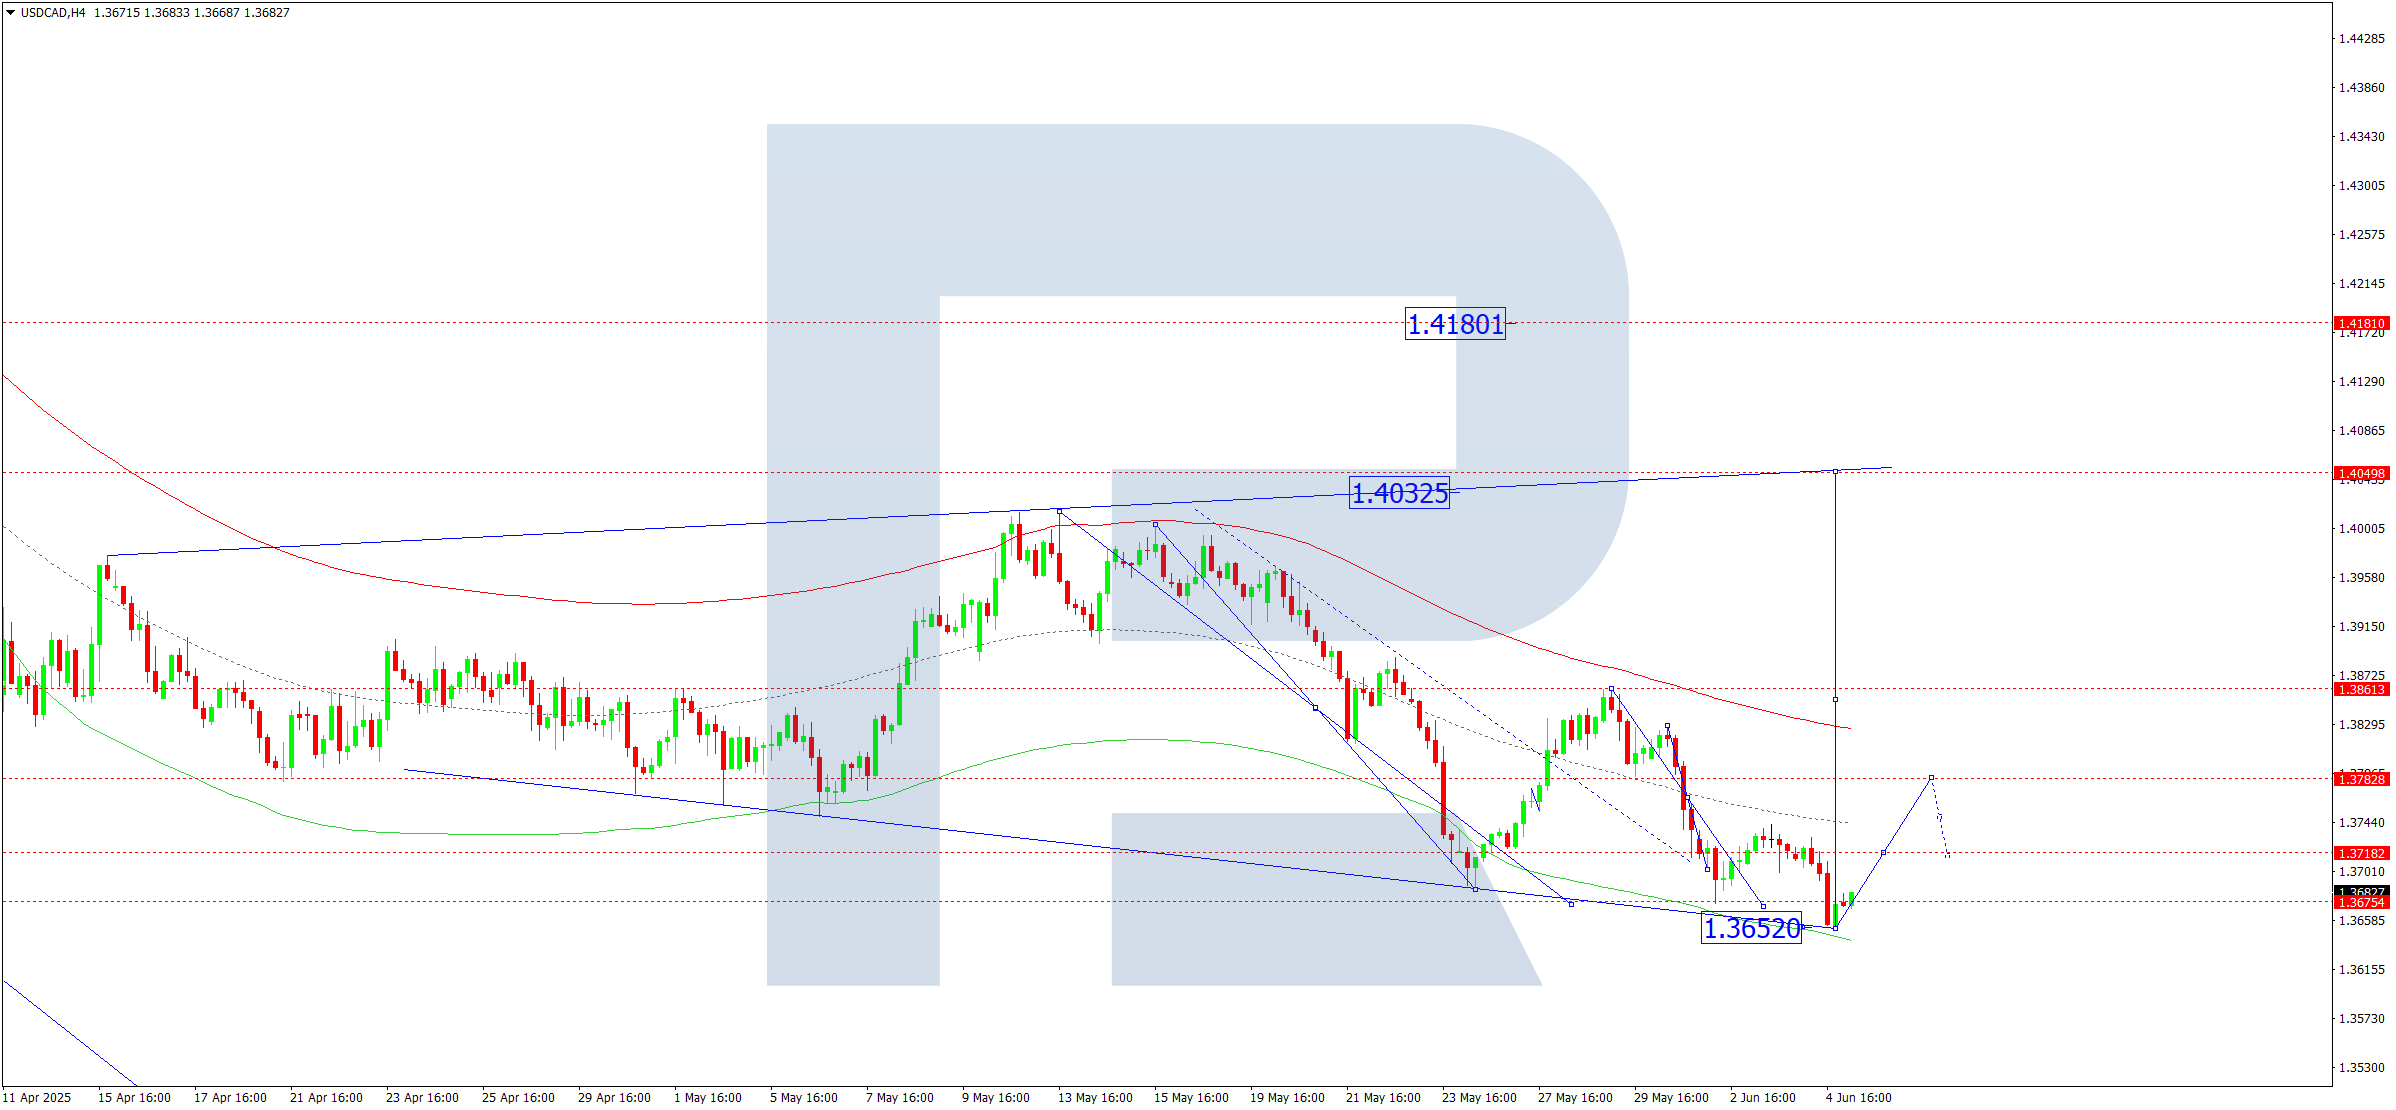
On the H4 chart of USDCAD, the market completed a downward wave to 1.3652. Today, 5 June 2025, a rise to 1.3783 is anticipated, followed by a correction to 1.3725. Afterwards, the wave may continue to 1.3860.
This scenario is supported by the Elliott wave structure and the downward wave matrix with a pivot at 1.3860, considered key for USDCAD. Currently, the fifth downward wave has reached the lower boundary of the price Envelope at 1.3652. Today, the market may begin a rebound towards the central line at 1.3720.
Technical indicators for today’s USDCAD forecast suggest a growth wave to 1.3720.
XAUUSD forecast
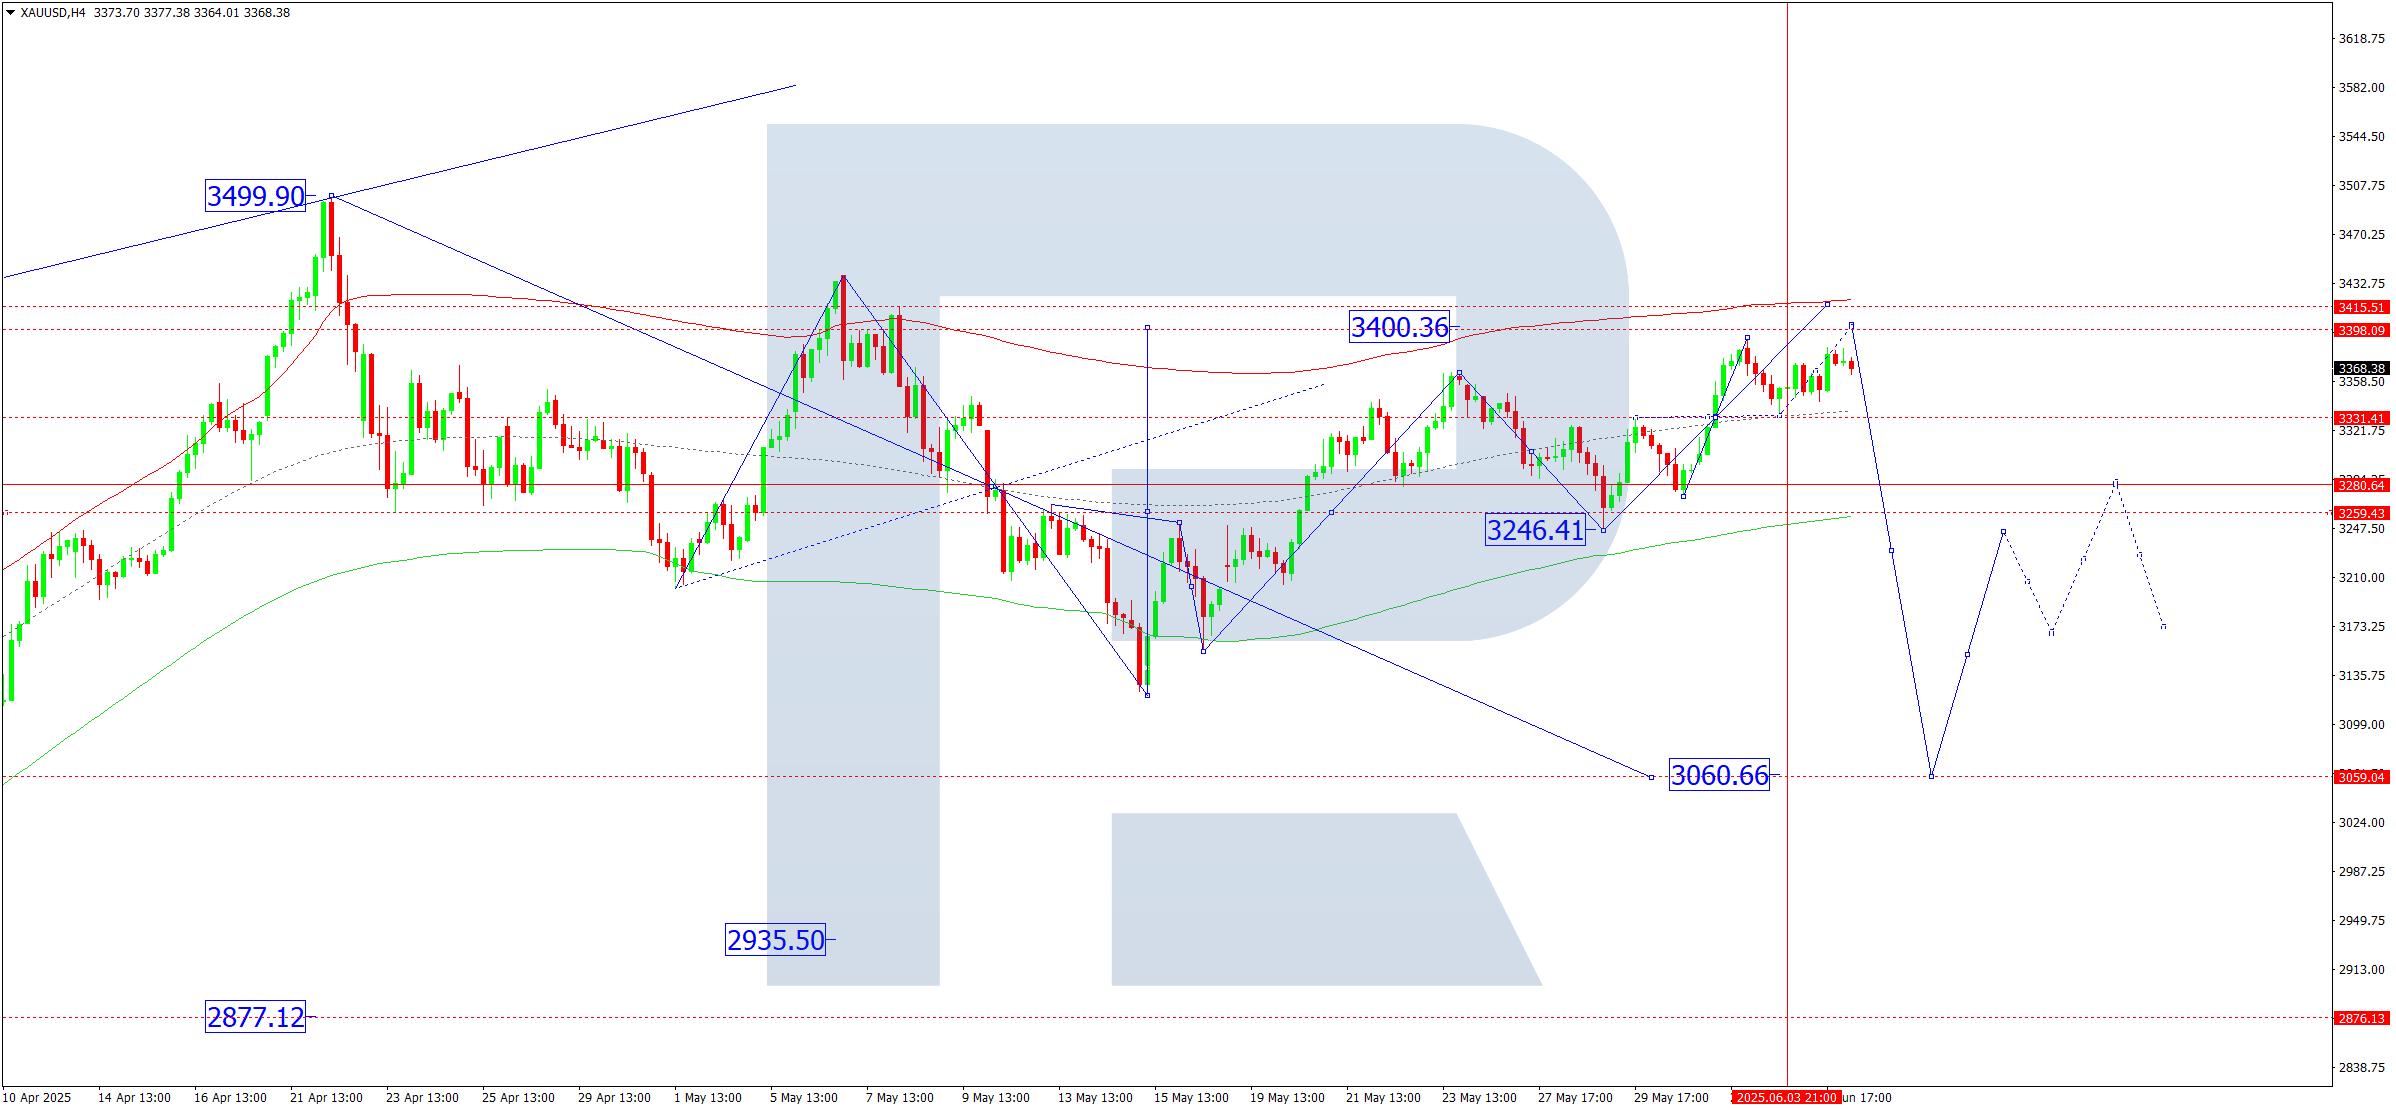
On the H4 chart of XAUUSD, the market continues to form a consolidation range around 3,333. Today, 5 June 2025, a breakout upwards may lead to a rise towards 3,400. A downward breakout could trigger a correction to 3,280.
This scenario is confirmed by the Elliott wave structure and the downward wave matrix with a pivot at 3,246, regarded as key. Currently, the market is developing the fifth wave of a correction towards the upper boundary of the price Envelope at 3,400. Once this move ends, a new decline towards the lower boundary at 3,240 is likely.
Technical indicators for today’s XAUUSD forecast suggest a continuation of the growth wave to 3,400.
Brent forecast
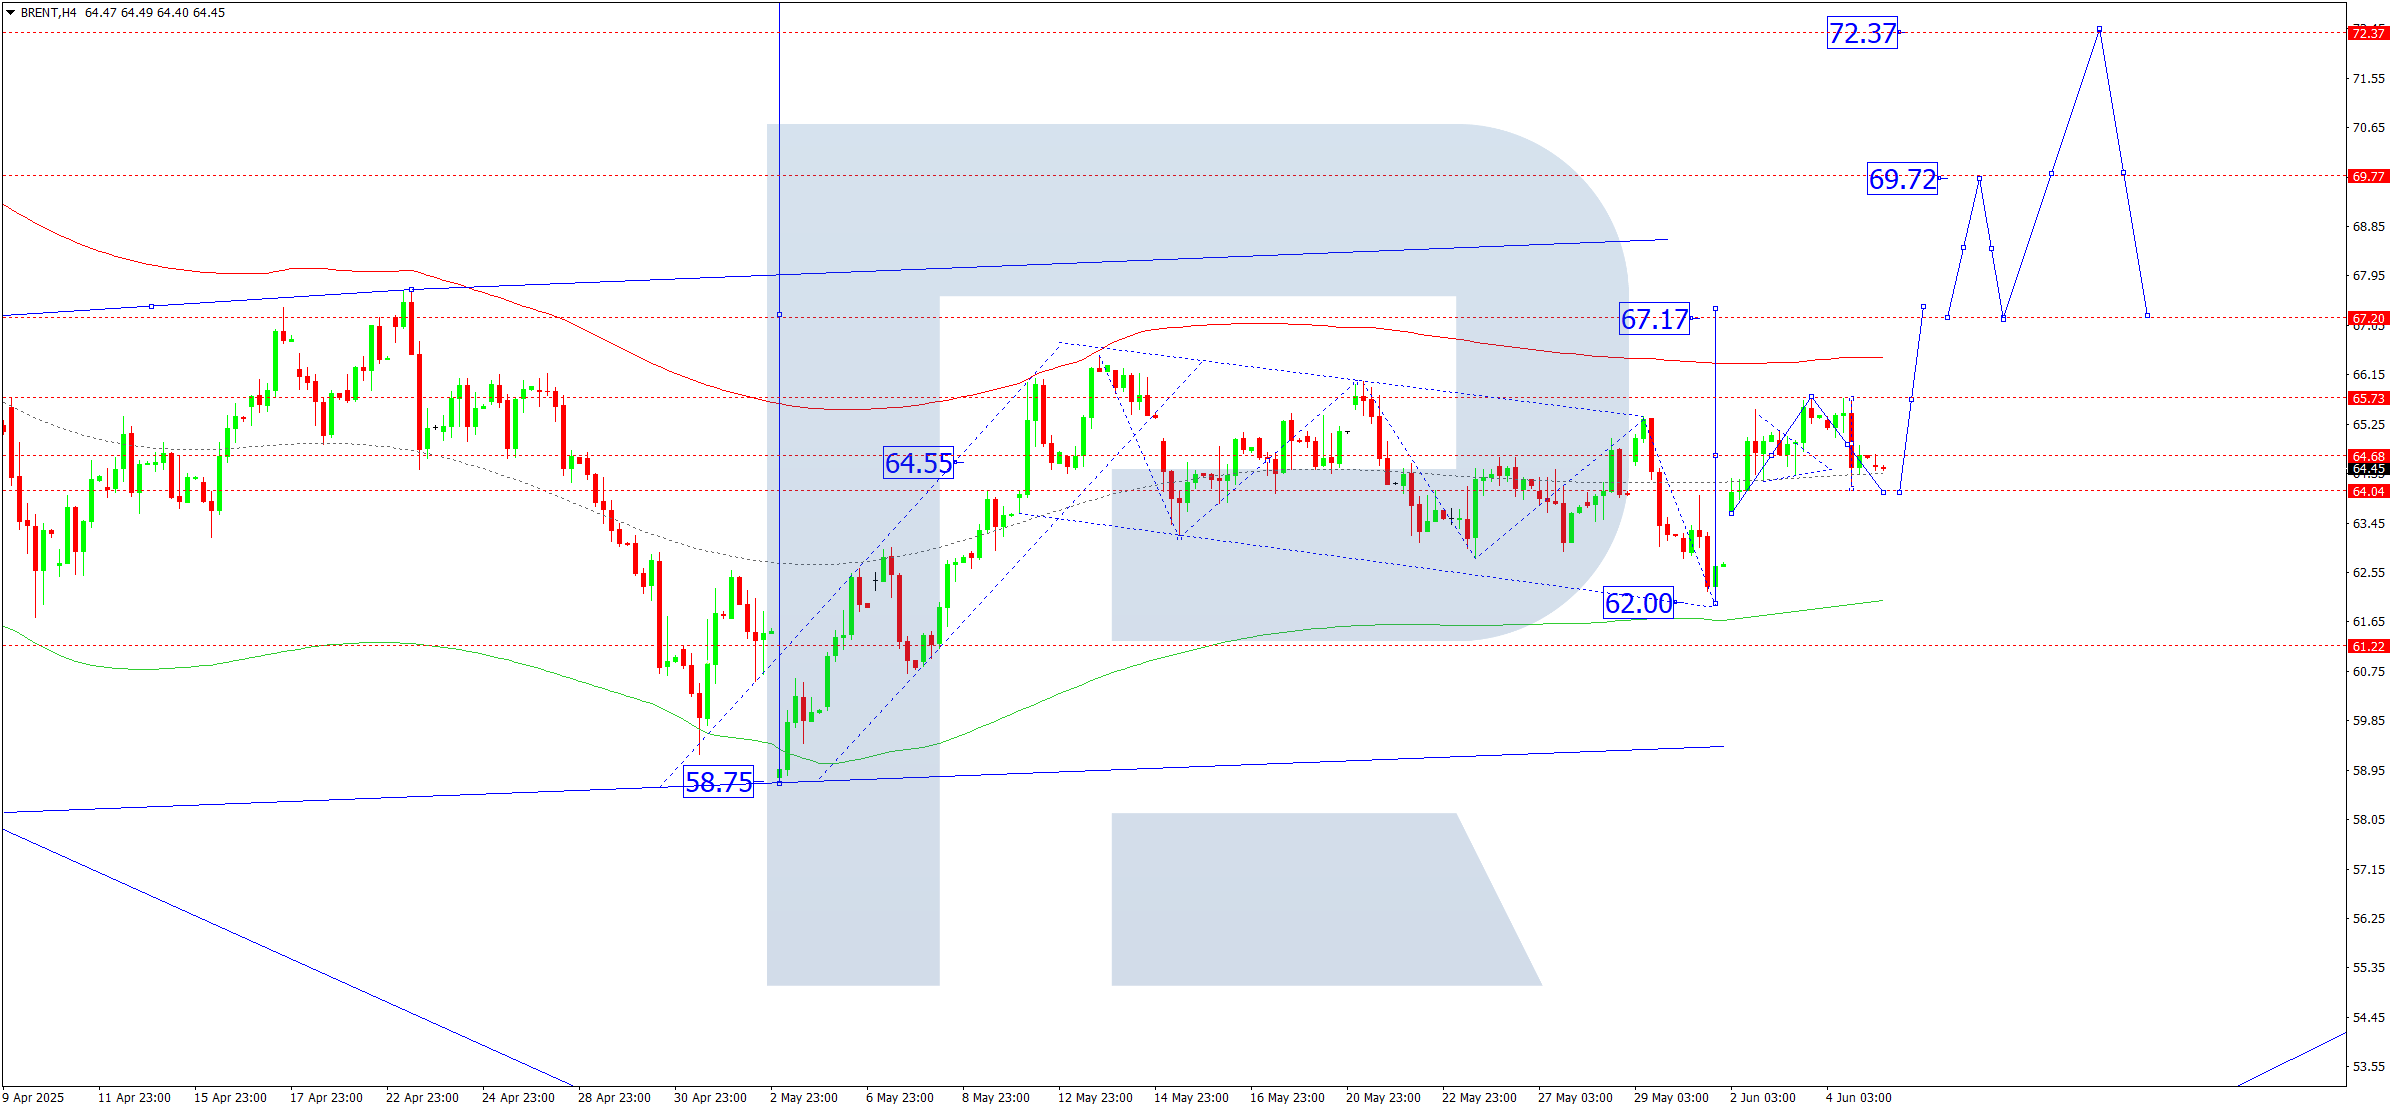
On the H4 Brent crude chart, the market continues consolidating around 64.66. Today, 5 June 2025, a further growth wave to 67.17 is possible, with the trend potentially extending to the local target of 69.72.
This scenario is supported by the Elliott wave structure and the growth wave matrix with a pivot at 64.66, considered key for Brent. Currently, the market is forming a growth wave towards the upper boundary of the price Envelope at 67.17. Later, a new consolidation range may appear before continuing the trend to 69.72.
Technical indicators for today’s Brent forecast suggest a likely rise to 67.17.
Forecasts presented in this section only reflect the author’s private opinion and should not be considered as guidance for trading. RoboForex bears no responsibility for trading results based on trading recommendations described in these analytical reviews.