Daily technical analysis and forecast for 3 June 2025
Here is a detailed daily technical analysis and forecast for EURUSD, USDJPY, GBPUSD, AUDUSD, USDCAD, XAUUSD and Brent for 3 June 2025.
EURUSD forecast
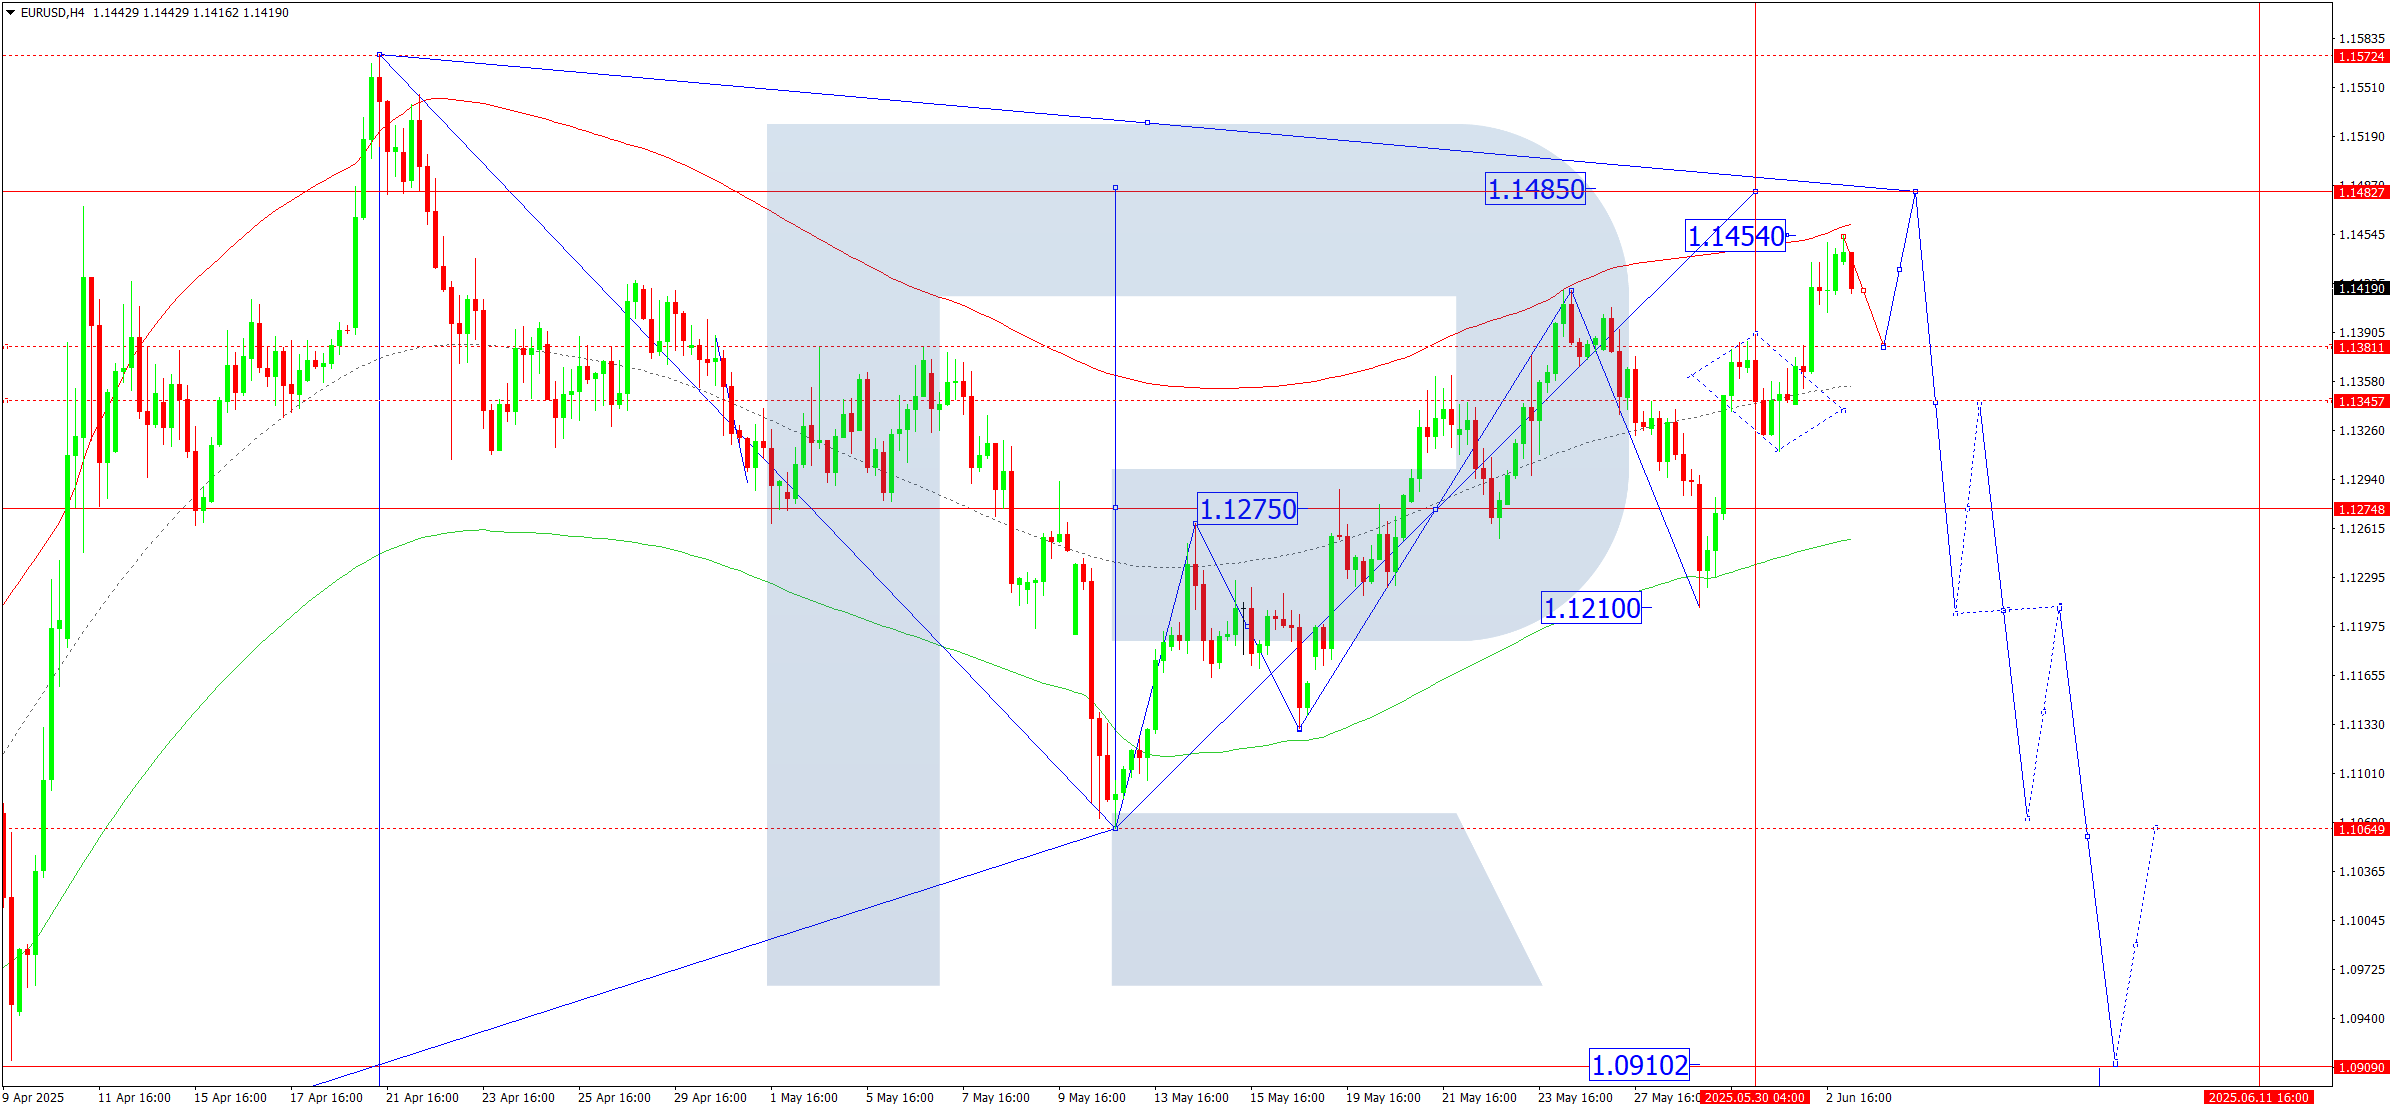
On the H4 chart of EURUSD, the market formed a consolidation range around 1.1345 and, following an upward breakout, continues the fifth wave of growth. Today, 3 June 2025, the range extended to 1.1454. A technical pullback to the previously broken level of 1.1380 (testing from above) is expected. Afterwards, the rise towards 1.1485 remains possible.
This scenario is technically confirmed by the Elliott wave structure and the growth wave matrix with a pivot at 1.1275, viewed as key in the EURUSD wave. Currently, the fifth upward structure is unfolding towards the upper boundary of the price Envelope at 1.1485. Today, the market might reach this target. Later, a new downward wave may begin towards the lower boundary at 1.1210, the first target.
Technical indicators for today’s EURUSD forecast suggest a continued upward wave to 1.1485.
USDJPY forecast
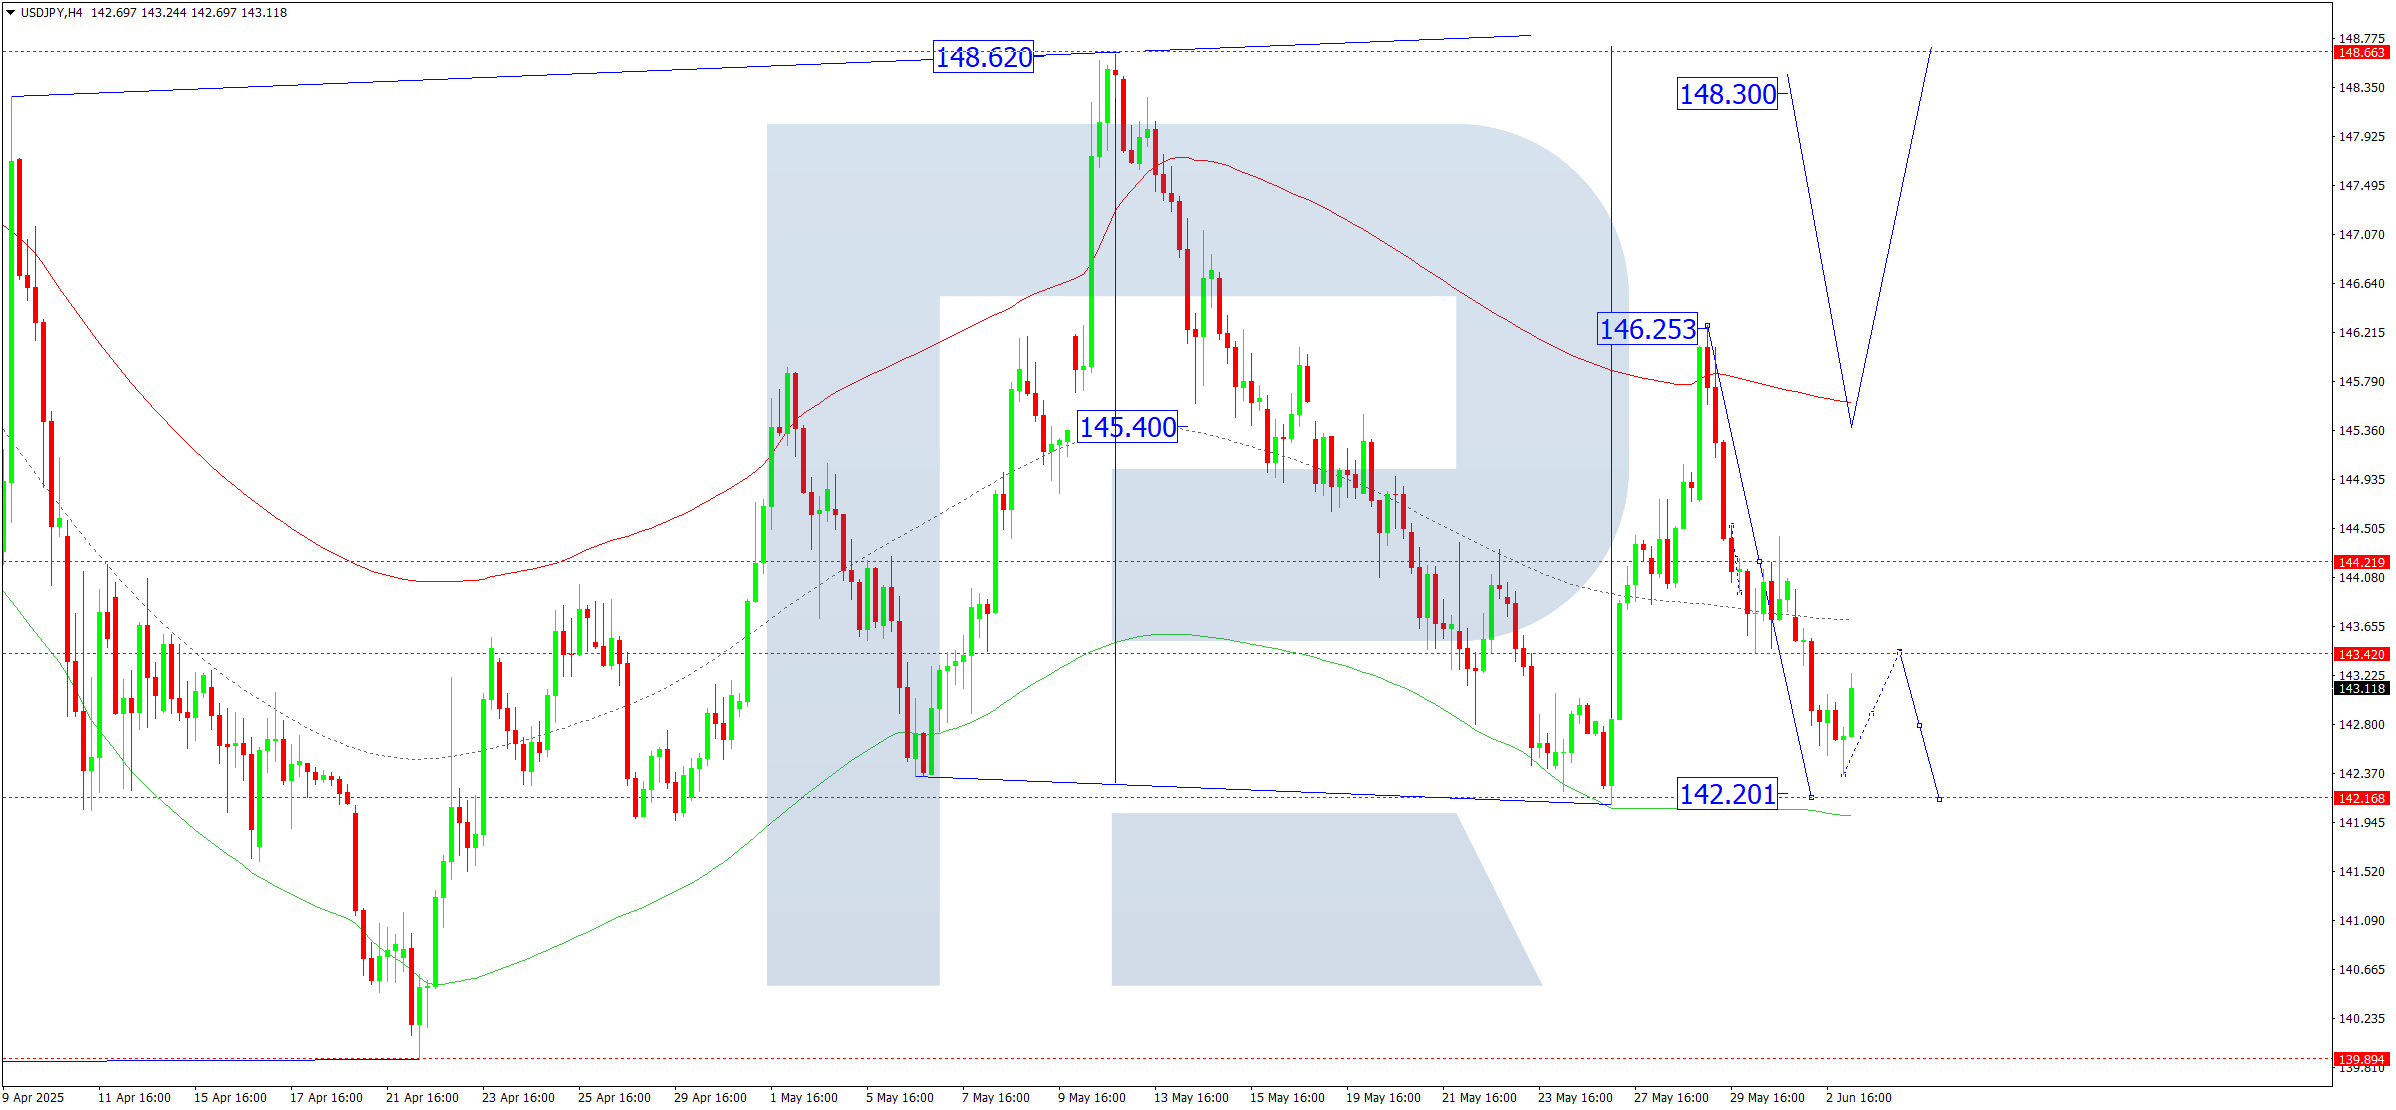
On the H4 chart of USDJPY, the market continues the downward wave towards 142.20. Today, 3 June 2025, the pair reached 142.37. A rebound to 143.43 (testing from below) is expected. Afterwards, another leg down to 142.20 remains possible.
This scenario is supported by the Elliott wave structure and the downward wave matrix with a pivot at 144.22, considered key in this wave. The market formed a consolidation range around the central line of the price Envelope and broke downward towards the lower boundary at 142.20. Today, the market may hit this target and then correct towards the central line at 144.22.
Technical indicators for today’s USDJPY forecast suggest a move down to 142.20.
GBPUSD forecast
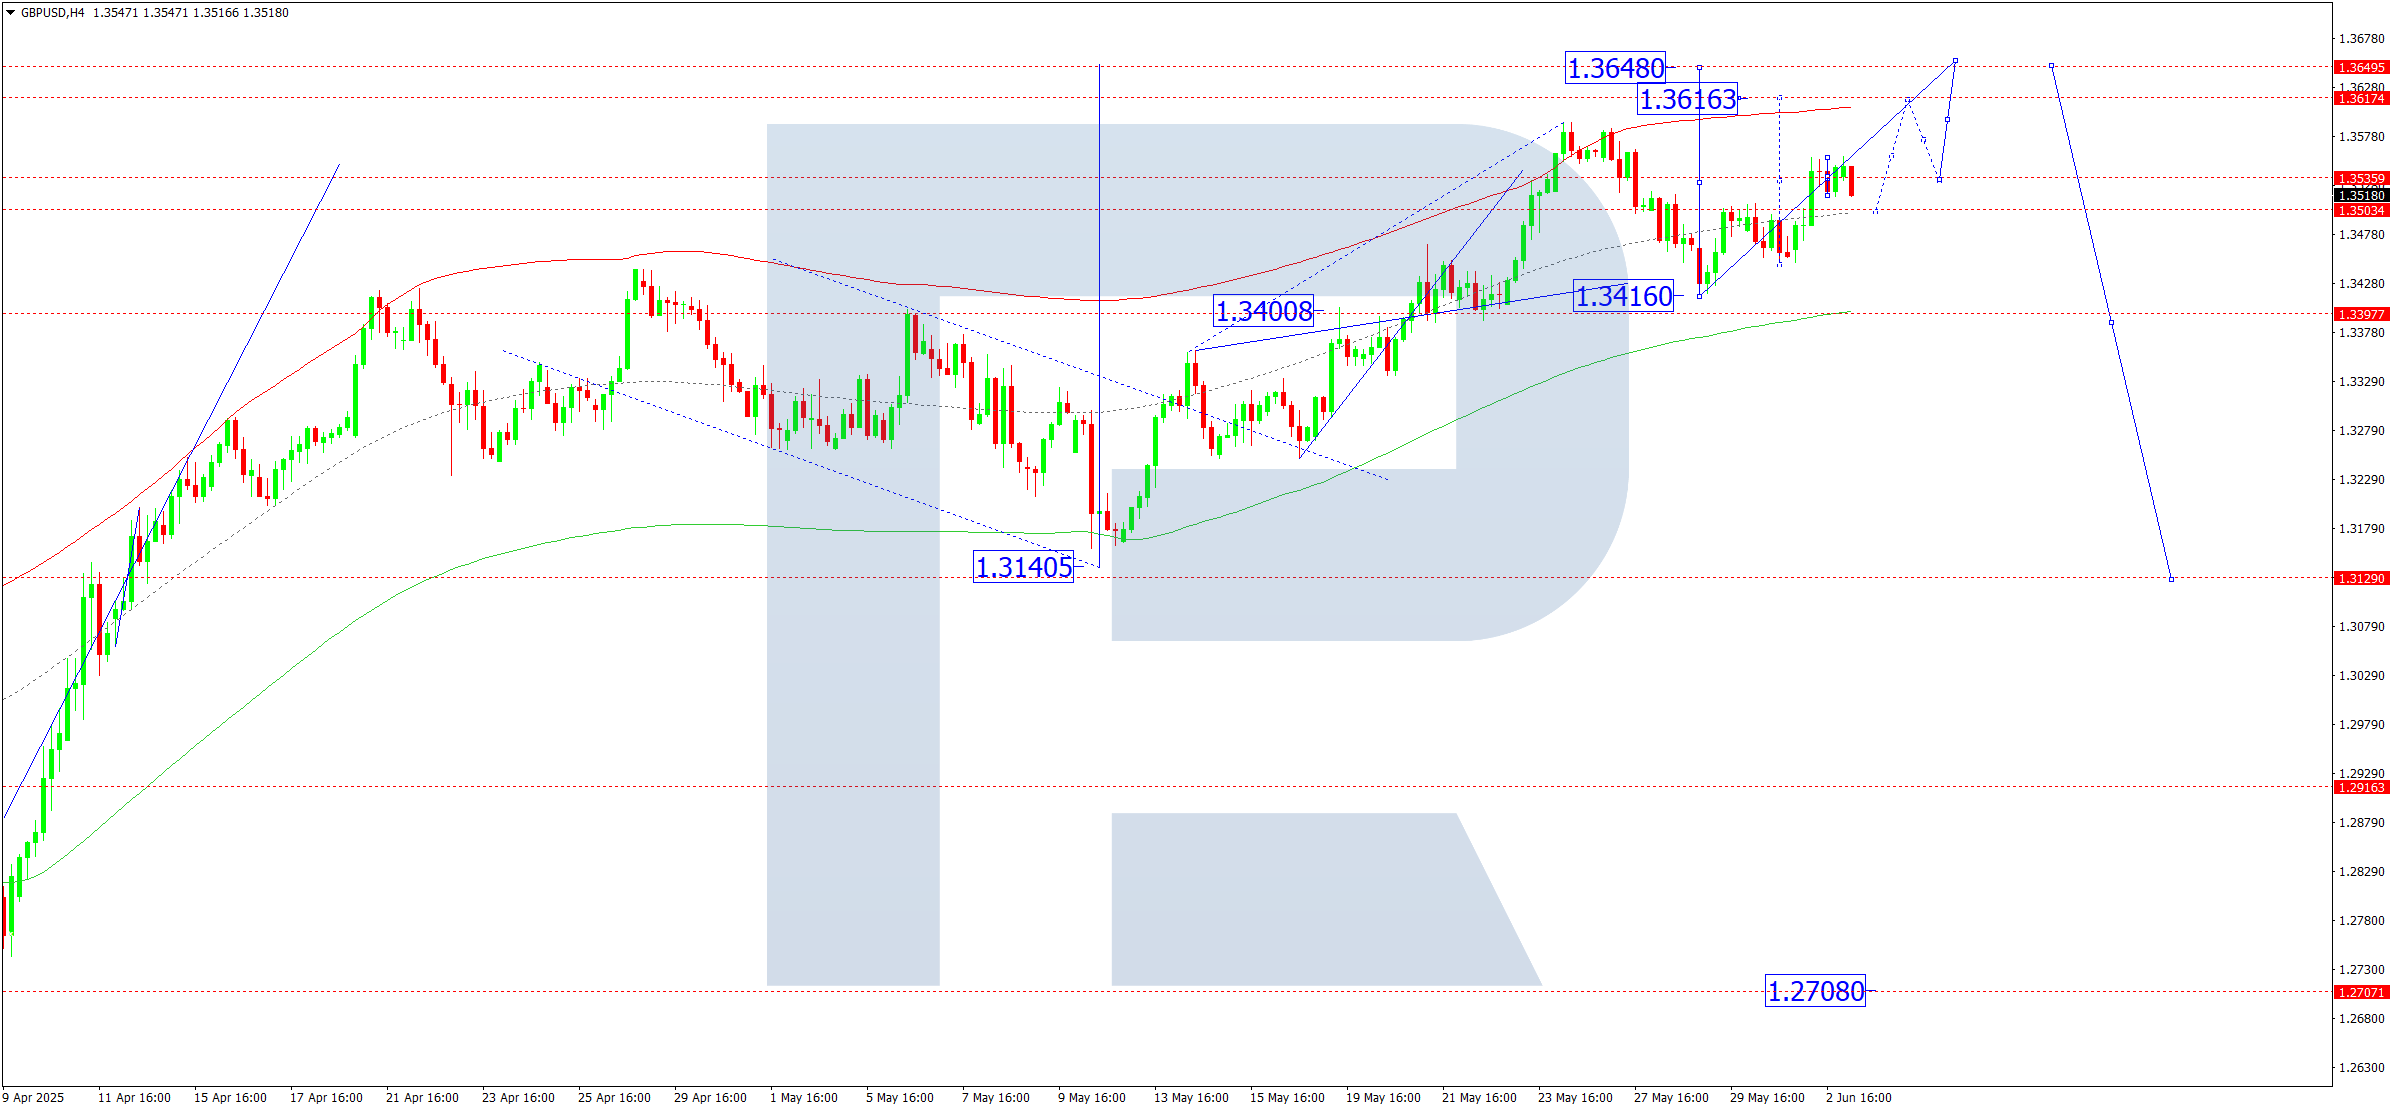
On the H4 chart of GBPUSD, the market formed an upward structure to 1.3559. Today, 3 June 2025, the pair may decline to 1.3503. Afterwards, a rise towards 1.3616 remains likely, with the potential for the trend to continue to 1.3648.
This scenario is confirmed by the Elliott wave structure and the growth wave matrix with a pivot at 1.3400, considered key in this wave. The market is currently consolidating near the central line at 1.3500. A downward breakout may extend the correction to the lower boundary at 1.3400. A subsequent rise to the upper boundary at 1.3648 is expected. If the market breaks out upwards, the trend could continue immediately to the upper boundary at 1.3648.
Technical indicators for today’s GBPUSD forecast suggest a correction to 1.3500 and a rise to at least 1.3616.
AUDUSD forecast
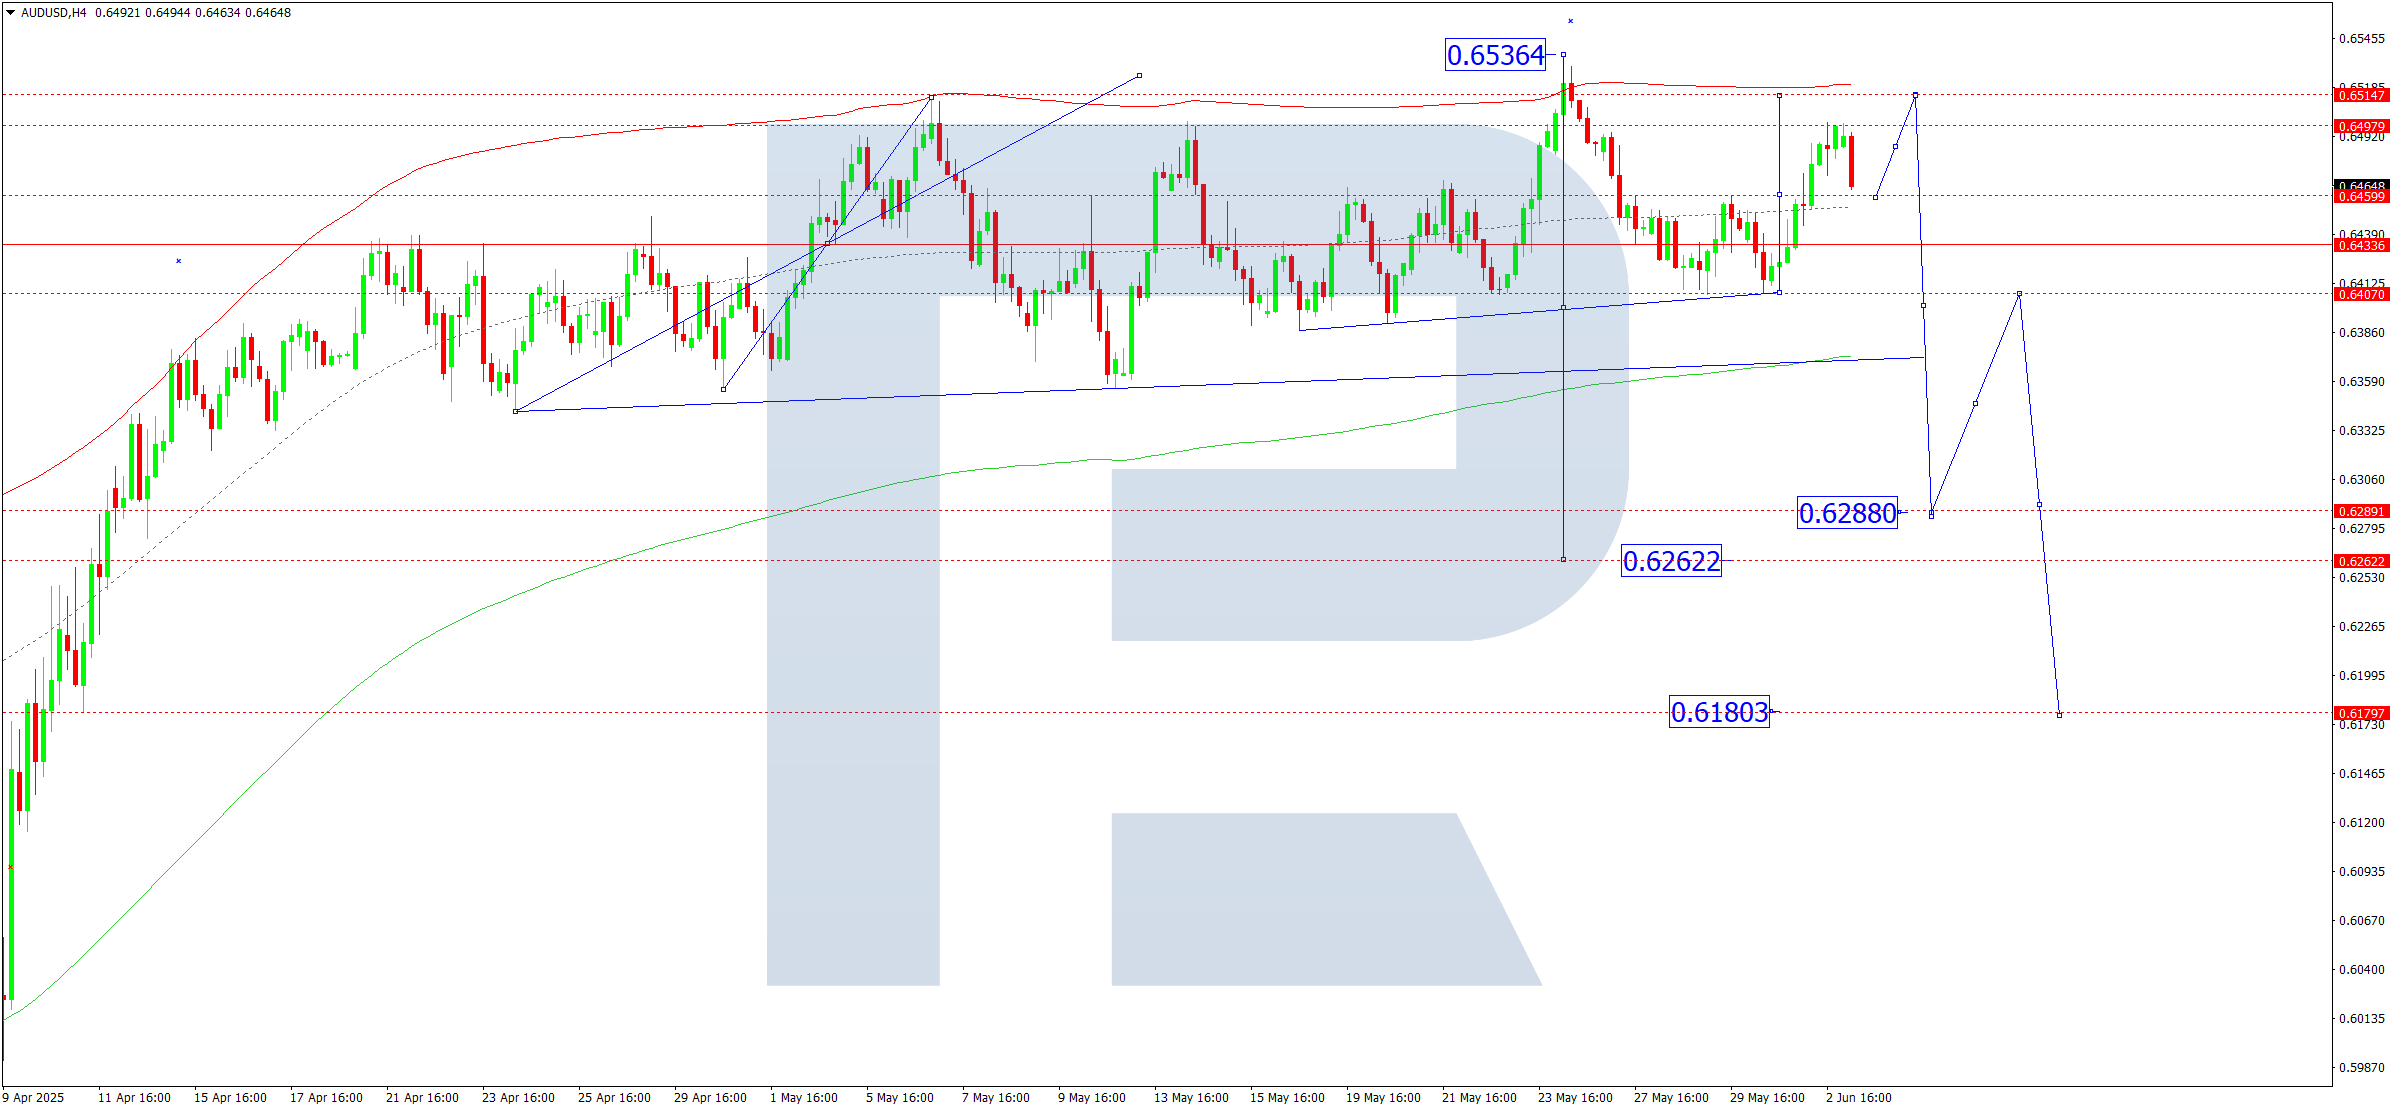
On the H4 chart of AUDUSD, the market broke out upwards from the consolidation range and completed a wave to 0.6499. Today, 3 June 2025, a pullback to 0.6460 is anticipated. Afterwards, a further rise to 0.6515 remains possible.
This scenario is backed by the Elliott wave structure and the growth wave matrix with a pivot at 0.6434, seen as key in this wave. The market is consolidating around the central line of the price Envelope at 0.6460. Today, a breakout upwards may extend the wave to the upper boundary at 0.6515.
Technical indicators for today’s AUDUSD forecast suggest a pullback to 0.6460 and a rise to 0.6515.
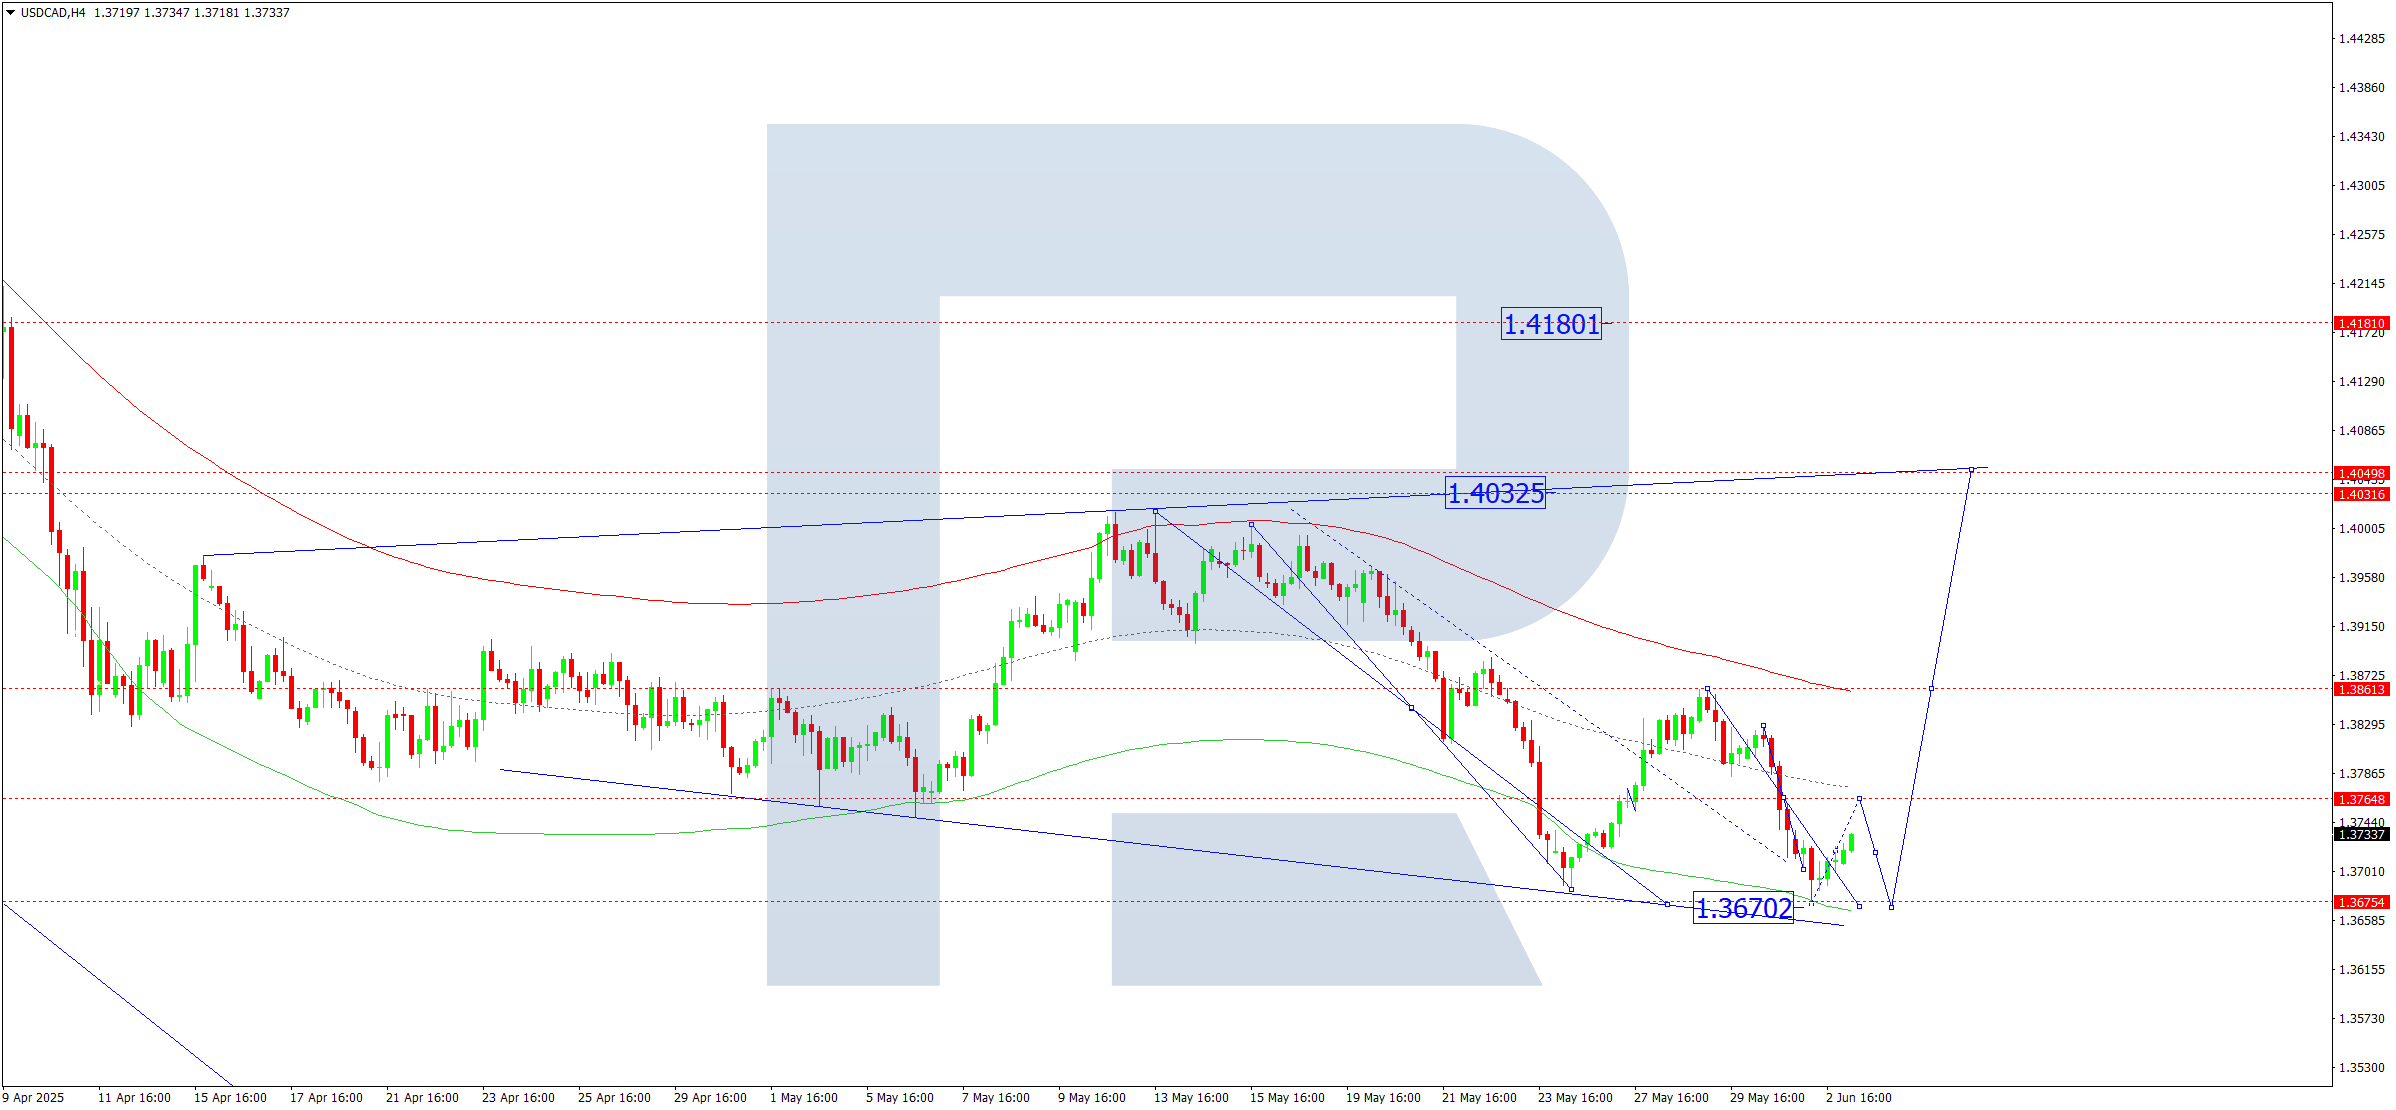
USDCAD forecast
On the H4 chart of USDCAD, the market completed a downward wave to 1.3685. Today, 3 June 2025, a rise to 1.3765 might occur. Afterwards, another leg down to 1.3670 remains possible.
This scenario is supported by the Elliott wave structure and the downward wave matrix with a pivot at 1.3860, considered key in the USDCAD structure. The market is currently forming a fifth downward wave towards the lower boundary of the price Envelope at 1.3670. Upon reaching this level, a new wave of growth to the upper boundary at 1.4040 could begin.
Technical indicators for today’s USDCAD forecast suggest a continuation of the decline to 1.3670.
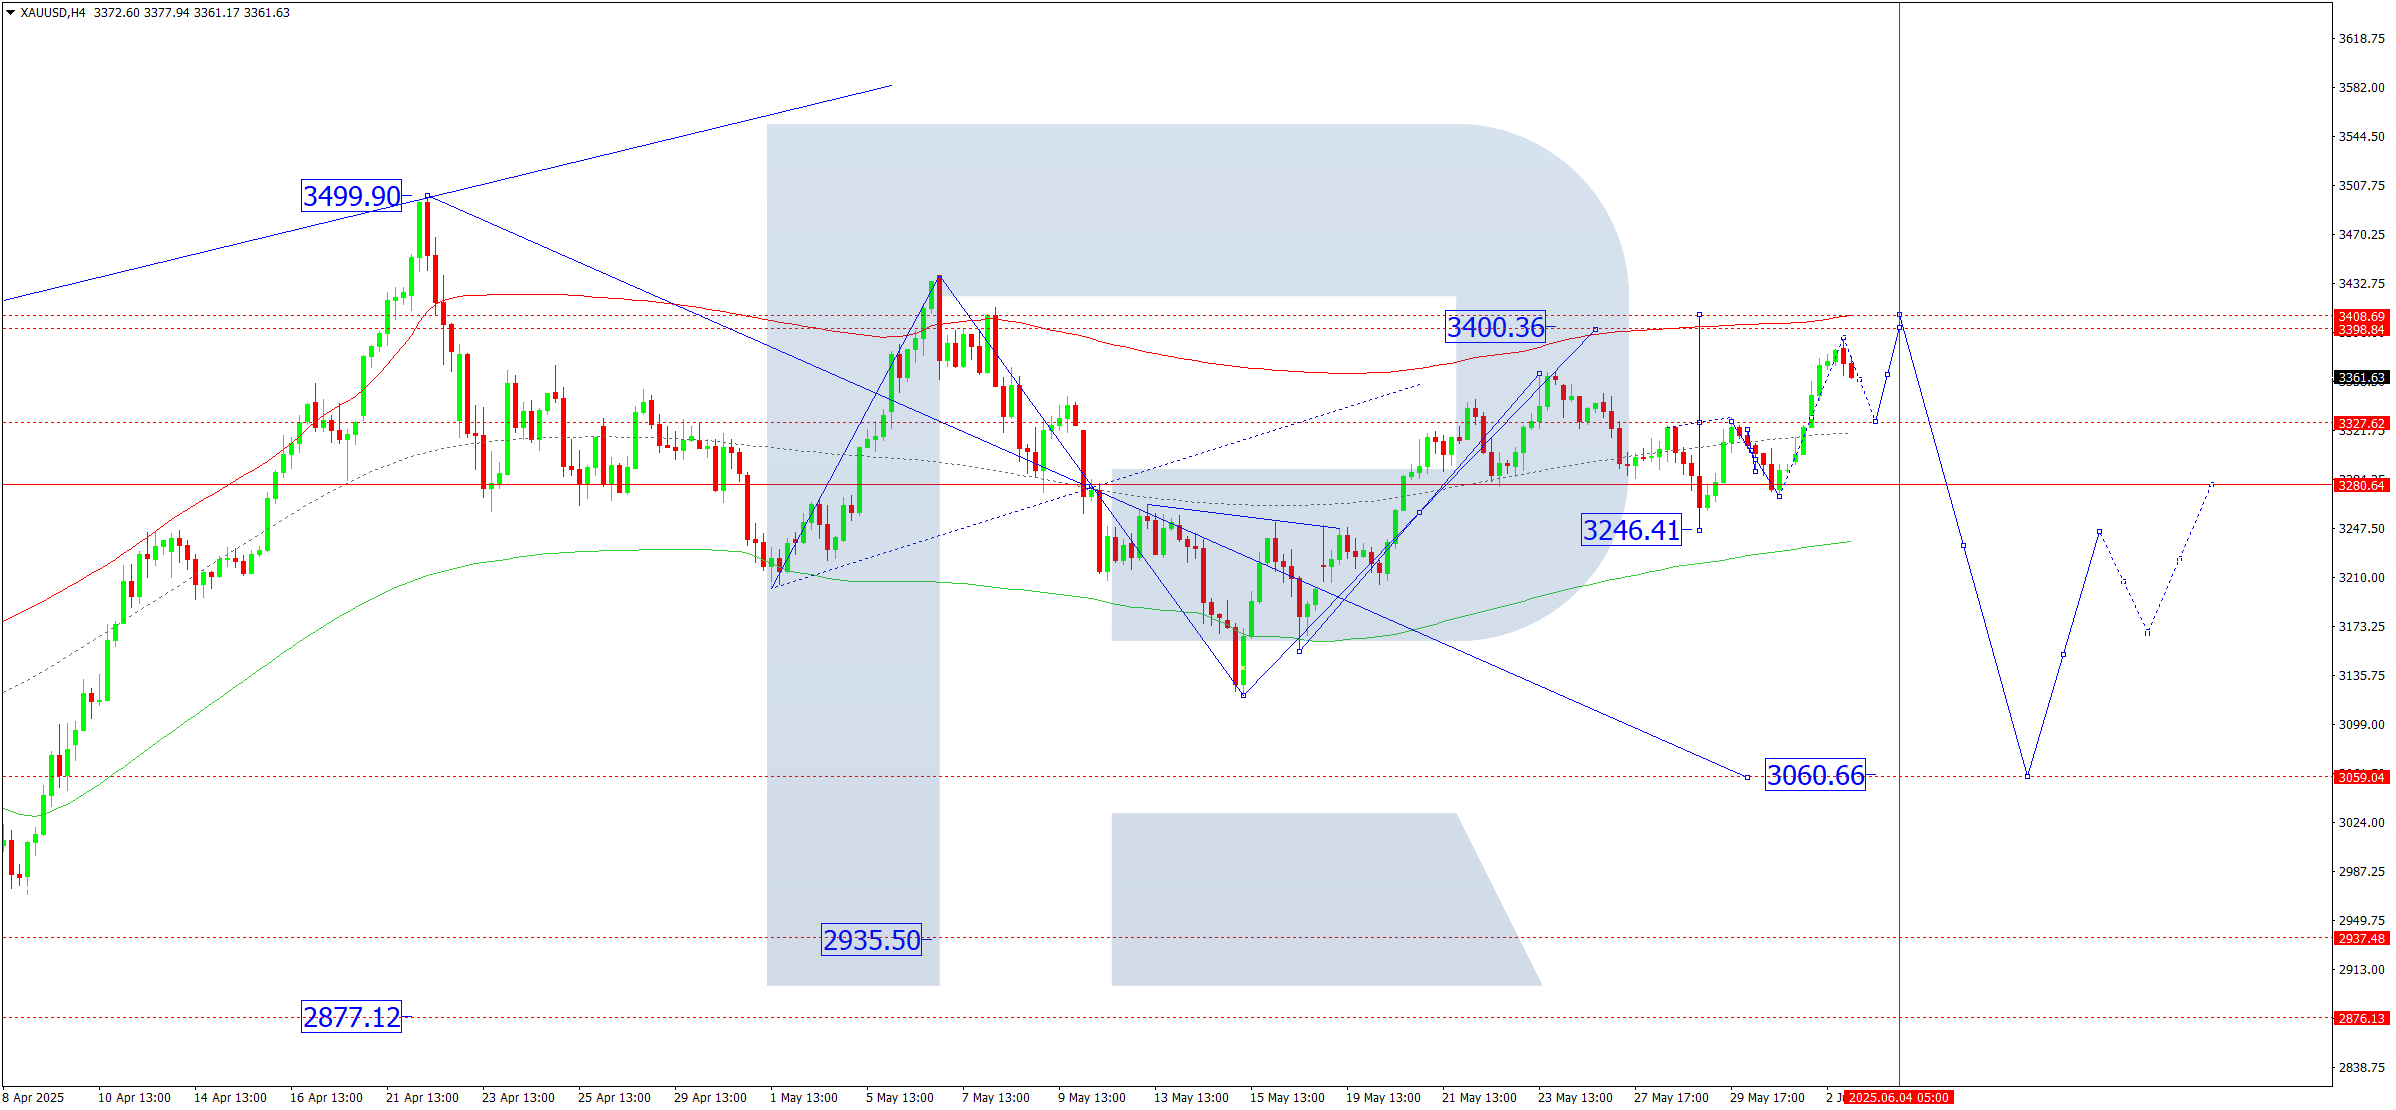
XAUUSD forecast
On the H4 chart of XAUUSD, the market completed a wave up to 3,392. Today, 3 June 2025, a correction to 3,327 (testing from above) is likely. After that, another upward move towards 3,400 remains possible.
This scenario is confirmed by the Elliott wave structure and the downward wave matrix with a pivot at 3,280, seen as key in the XAUUSD structure. The market is currently forming a correction towards the upper boundary of the price Envelope at 3,400. Today, a pullback to 3,327 and further growth to 3,400 are expected.
Technical indicators for today’s XAUUSD forecast suggest a continuation of the upward wave to 3,400.
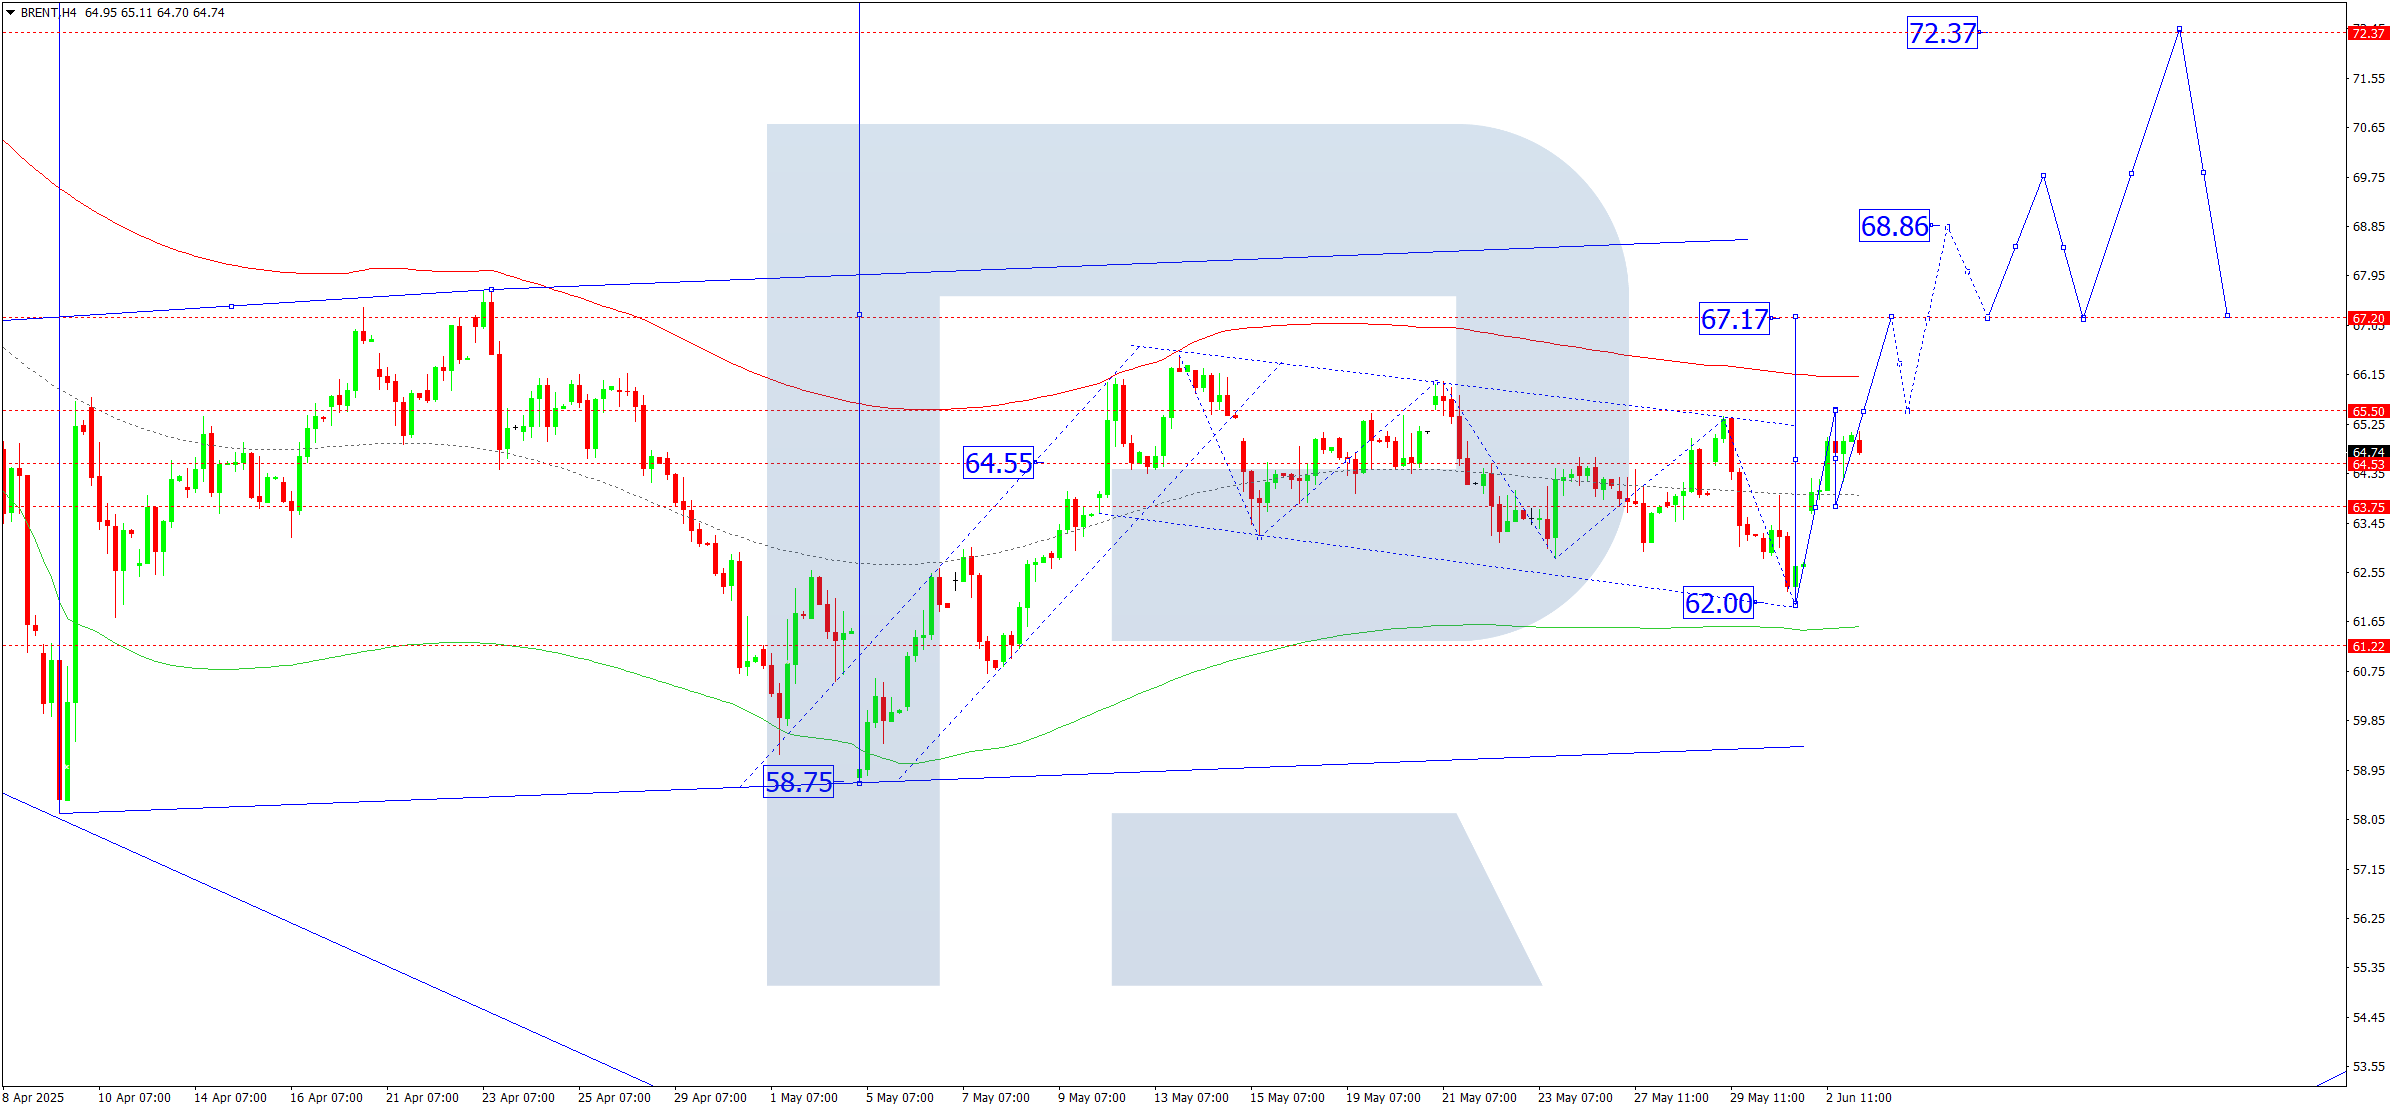
Brent forecast
On the H4 chart of Brent crude, the market completed a wave up to 65.50. Today, 3 June 2025, a correction to 63.75 appears likely. This would outline a broad consolidation range around this level. An upward breakout may trigger a wave to 67.17, the local target.
This scenario is backed by the Elliott wave structure and the downward wave matrix with a pivot at 64.44, considered key in Brent's structure. The market reached the central line of the price Envelope at 65.50. A breakout above this level may continue the trend to the upper boundary at 67.17.
Technical indicators for today’s Brent forecast suggest a correction to 63.75 and a subsequent rise to 67.17.
Forecasts presented in this section only reflect the author’s private opinion and should not be considered as guidance for trading. RoboForex bears no responsibility for trading results based on trading recommendations described in these analytical reviews.