Daily technical analysis and forecast for 2 June 2025
Here is a detailed daily technical analysis and forecast for EURUSD, USDJPY, GBPUSD, AUDUSD, USDCAD, XAUUSD and Brent for 2 June 2025.
EURUSD forecast
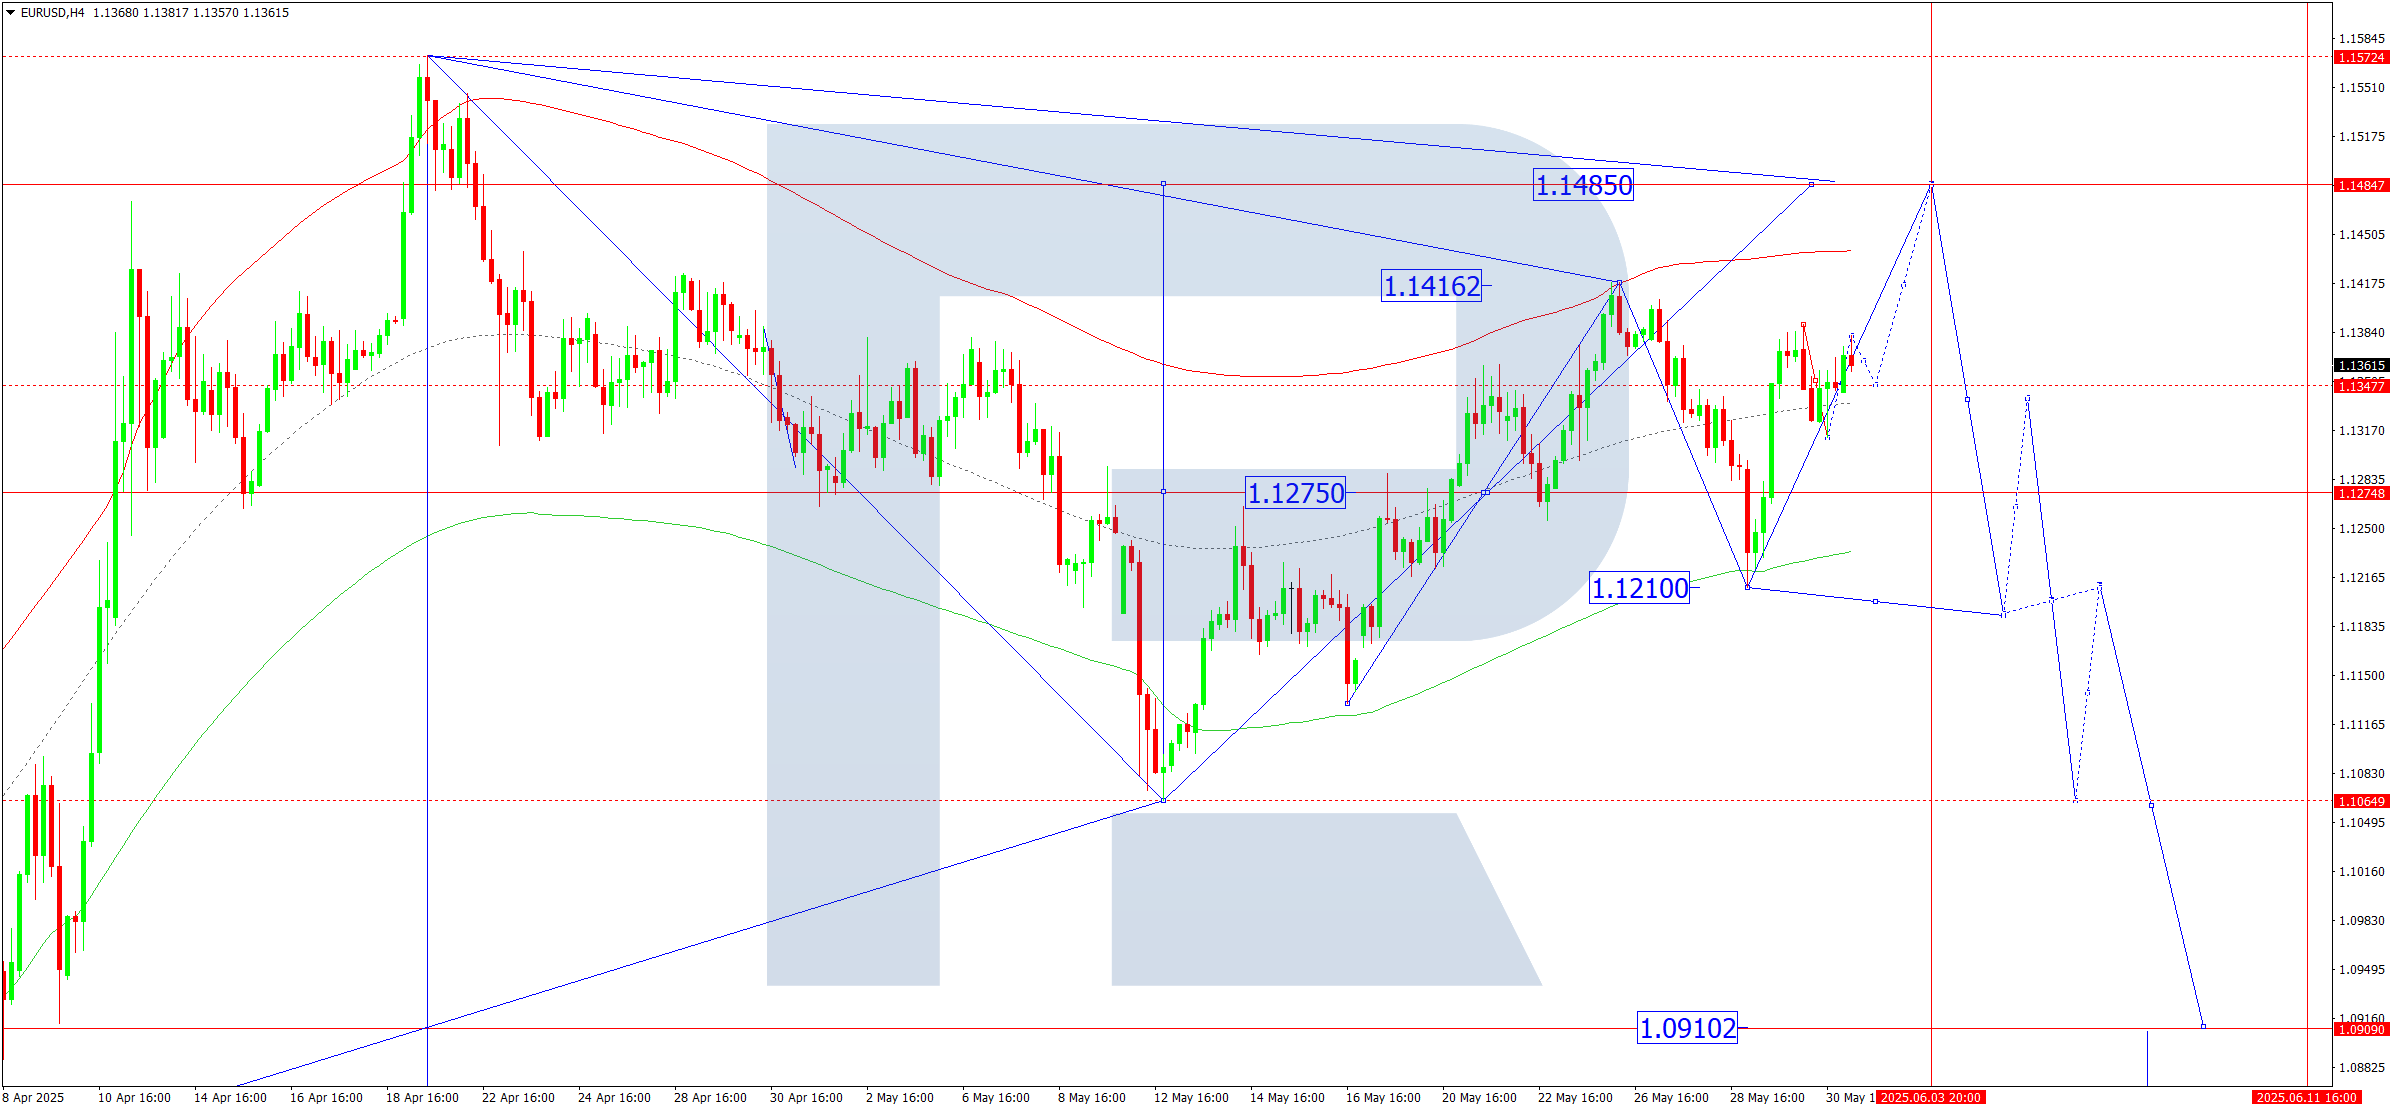
On the H4 chart of EURUSD, the market continues to develop a compact consolidation range around 1.1347. Today, 2 June 2025, a breakout upwards may trigger a wave to 1.1485. A downward breakout might lead to a pullback to 1.1270. A subsequent rise towards 1.1485 remains possible.
This scenario is confirmed by the Elliott wave structure and the growth wave matrix with a pivot at 1.1275, seen as key in the EURUSD structure. The fifth upward wave is unfolding towards the upper boundary of the price Envelope at 1.1485. Today, the market might reach this target level. Afterwards, a new downward wave may begin towards 1.1210, the first target.
Technical indicators for today’s EURUSD forecast suggest a continuation of the upward wave to 1.1485.
USDJPY forecast
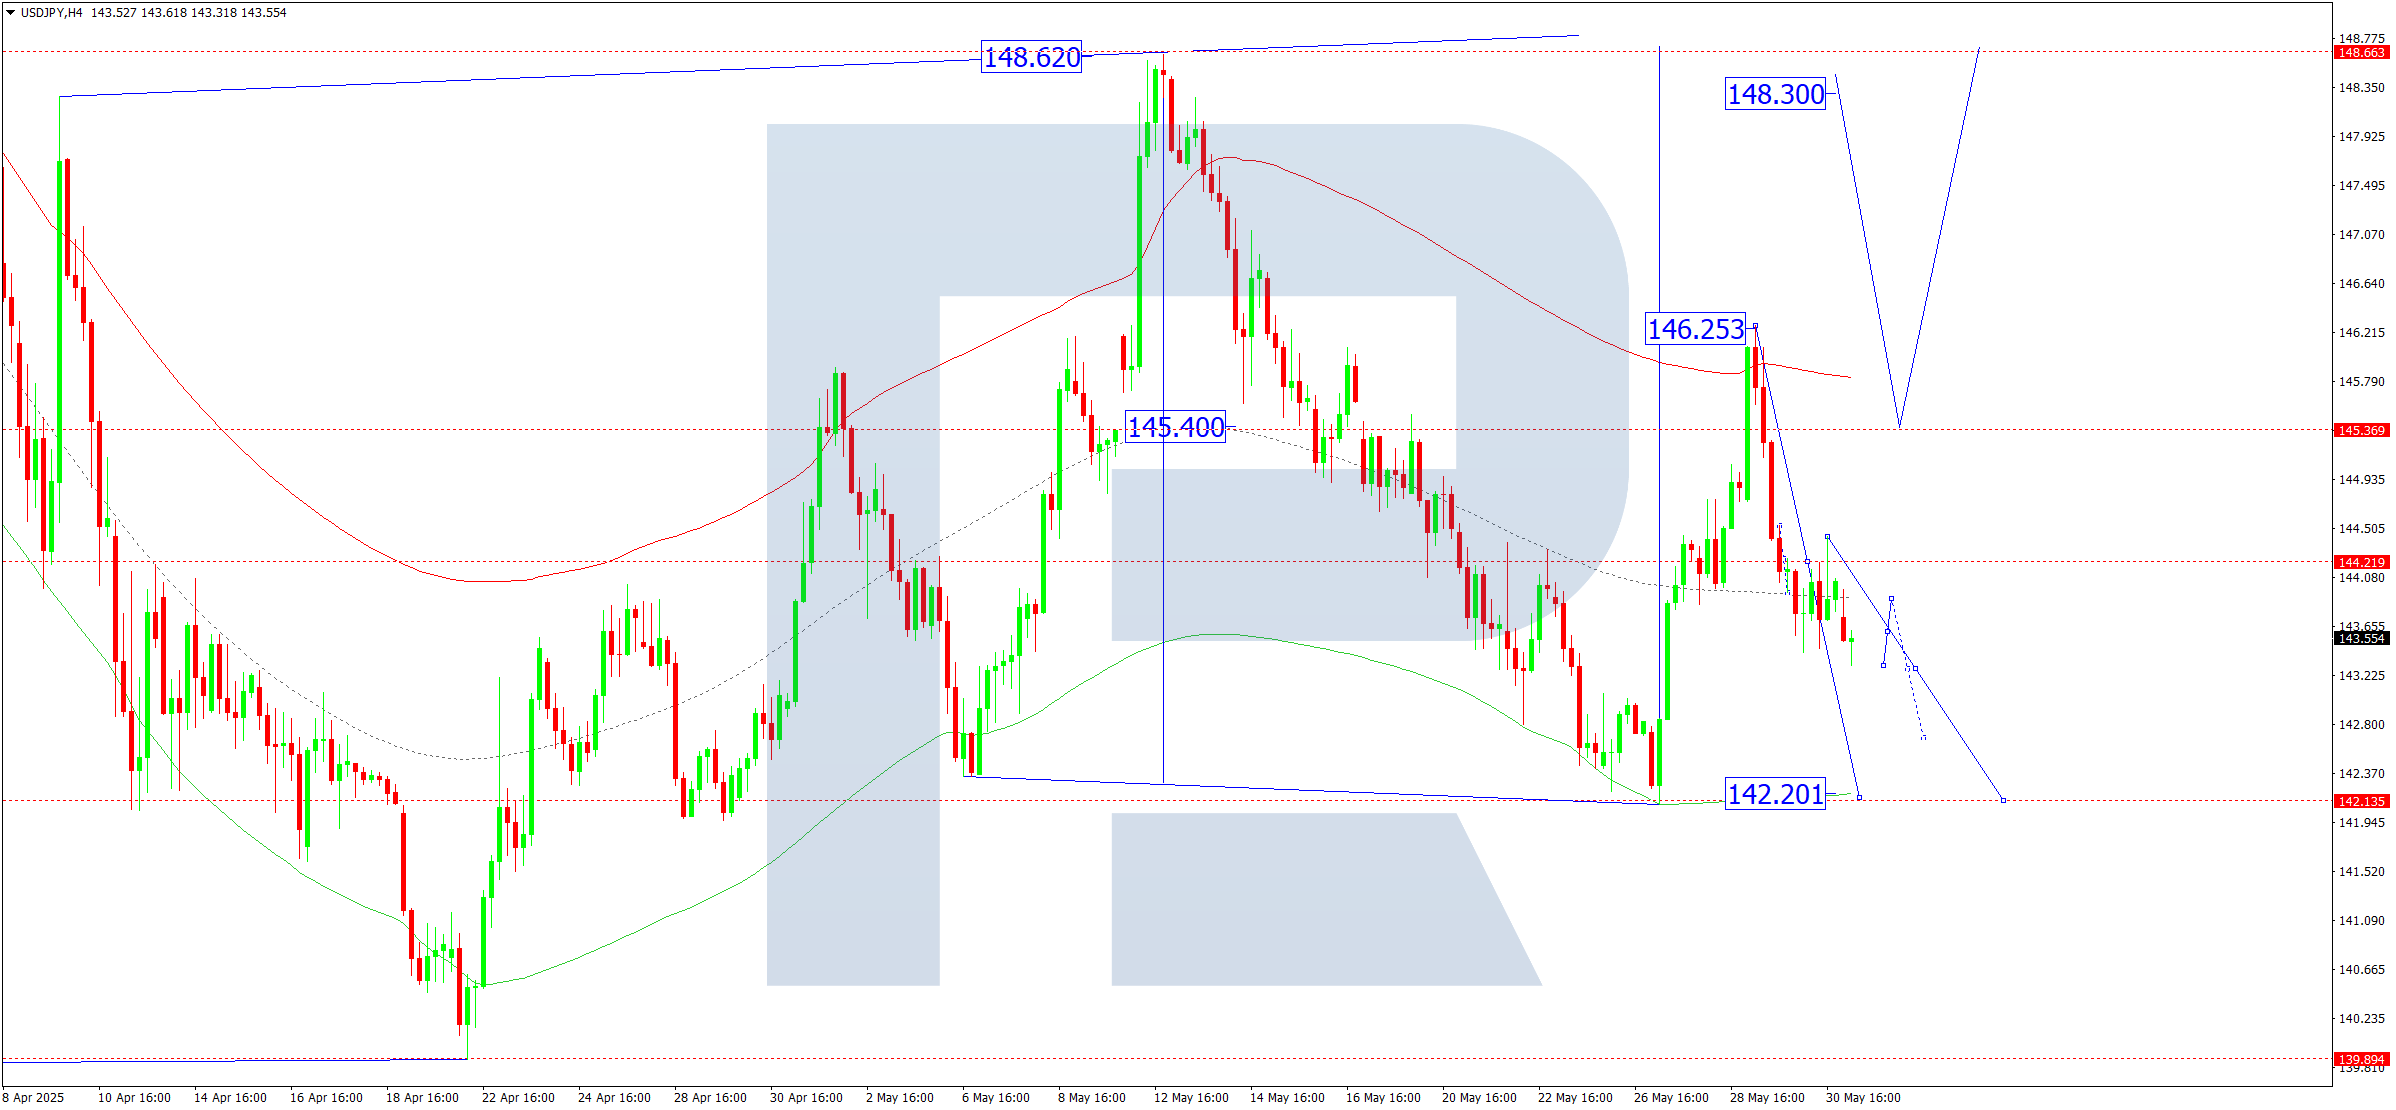
On the H4 chart of USDJPY, the market continues to develop a compact consolidation range around 144.22. Today, 2 June 2025, the market is attempting a downward breakout. The decline might continue to 142.20. Afterwards, a rebound to 144.22 is expected.
This scenario is supported by the Elliott wave structure and the downward wave matrix with a pivot at 144.22, regarded as key in this wave. The market has formed a consolidation range around the central line of the price Envelope and broke downward with potential to reach the lower boundary at 142.20. Today, we expect this target to be hit and a correction to the central line at 144.22 to begin.
Technical indicators for today’s USDJPY forecast suggest a decline to 142.20.
GBPUSD forecast
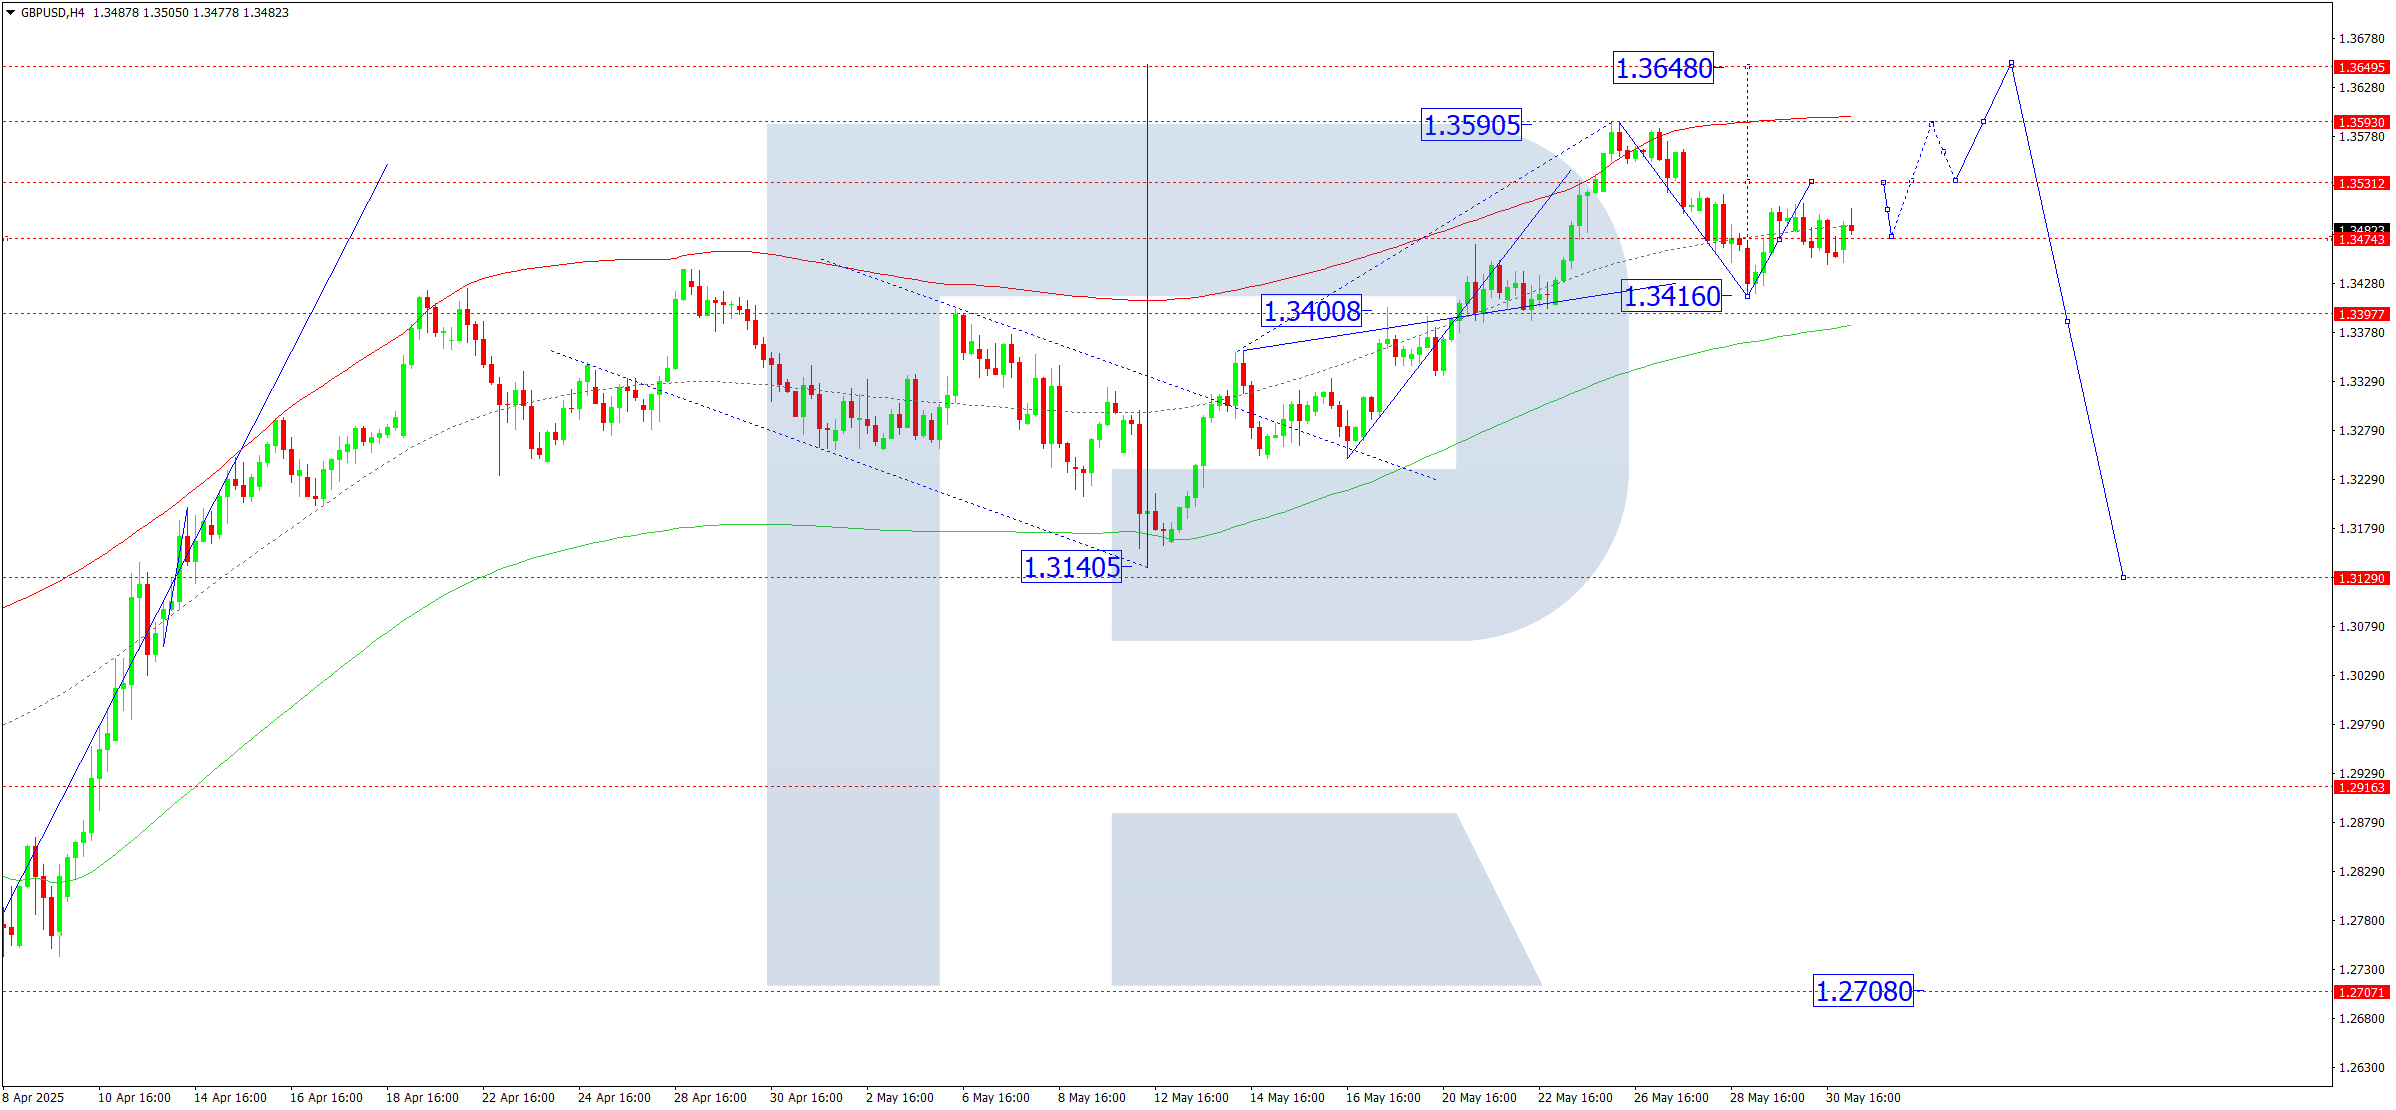
On the H4 chart of GBPUSD, the market is forming a compact consolidation range around 1.3474. Today, 2 June 2025, an upward breakout may extend the range to 1.3523 with potential to continue the wave to 1.3648. If it breaks downward, a move to 1.3400 may follow. After that, a rise to 1.3648 remains possible.
This scenario is confirmed by the Elliott wave structure and the growth wave matrix with a pivot at 1.3400, considered key in the GBPUSD wave. The market is currently near the central line at 1.3474. A correction to the lower boundary at 1.3400 might occur, followed by an upward move to the upper boundary at 1.3648.
Technical indicators for today’s GBPUSD forecast suggest a correction to 1.3400.
AUDUSD forecast
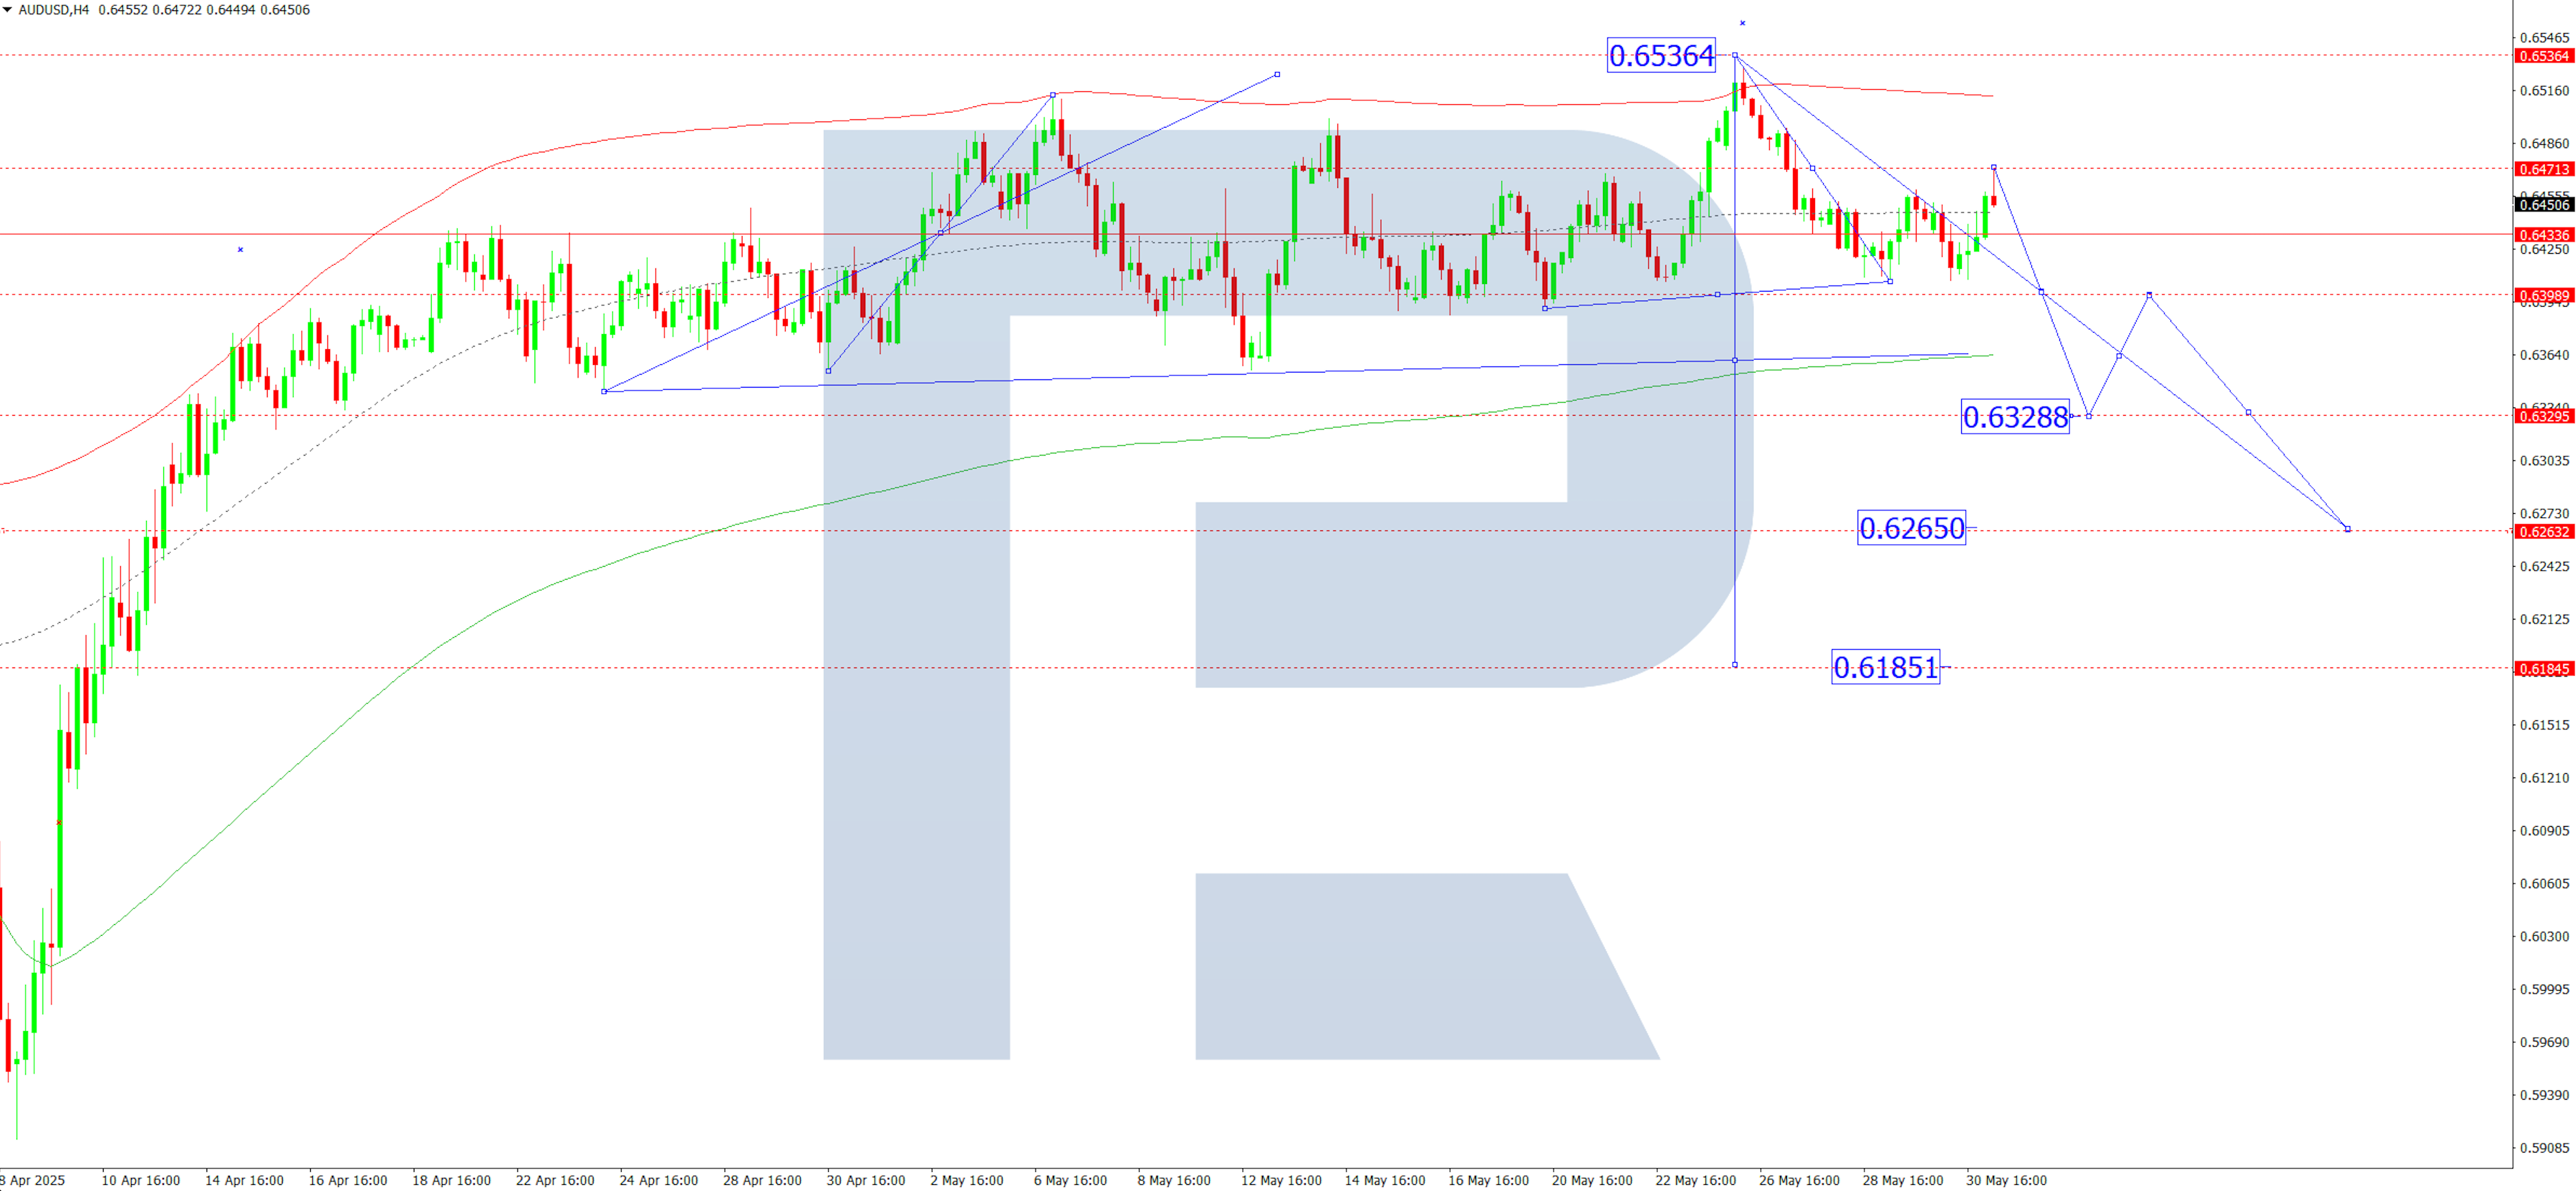
On the H4 chart of AUDUSD, the market completed a wave to 0.6407 and corrected to 0.6471 (testing from below), outlining a compact consolidation range around 0.6434. Today, 2 June 2025, a downward breakout may lead to a continuation of the wave to 0.6328. An upward breakout could trigger a rise to 0.6535. Afterwards, a new downward wave to at least 0.6265 remains possible.
This scenario is backed by the Elliott wave structure and the upward wave matrix with a pivot at 0.6434, seen as key in this wave. The market is currently consolidating around the central line of the price Envelope at 0.6434. Today, we may see a breakout downwards, with a wave continuing to the lower boundary at 0.6328.
Technical indicators for today’s AUDUSD forecast suggest a continuation of the downward wave to 0.6328.
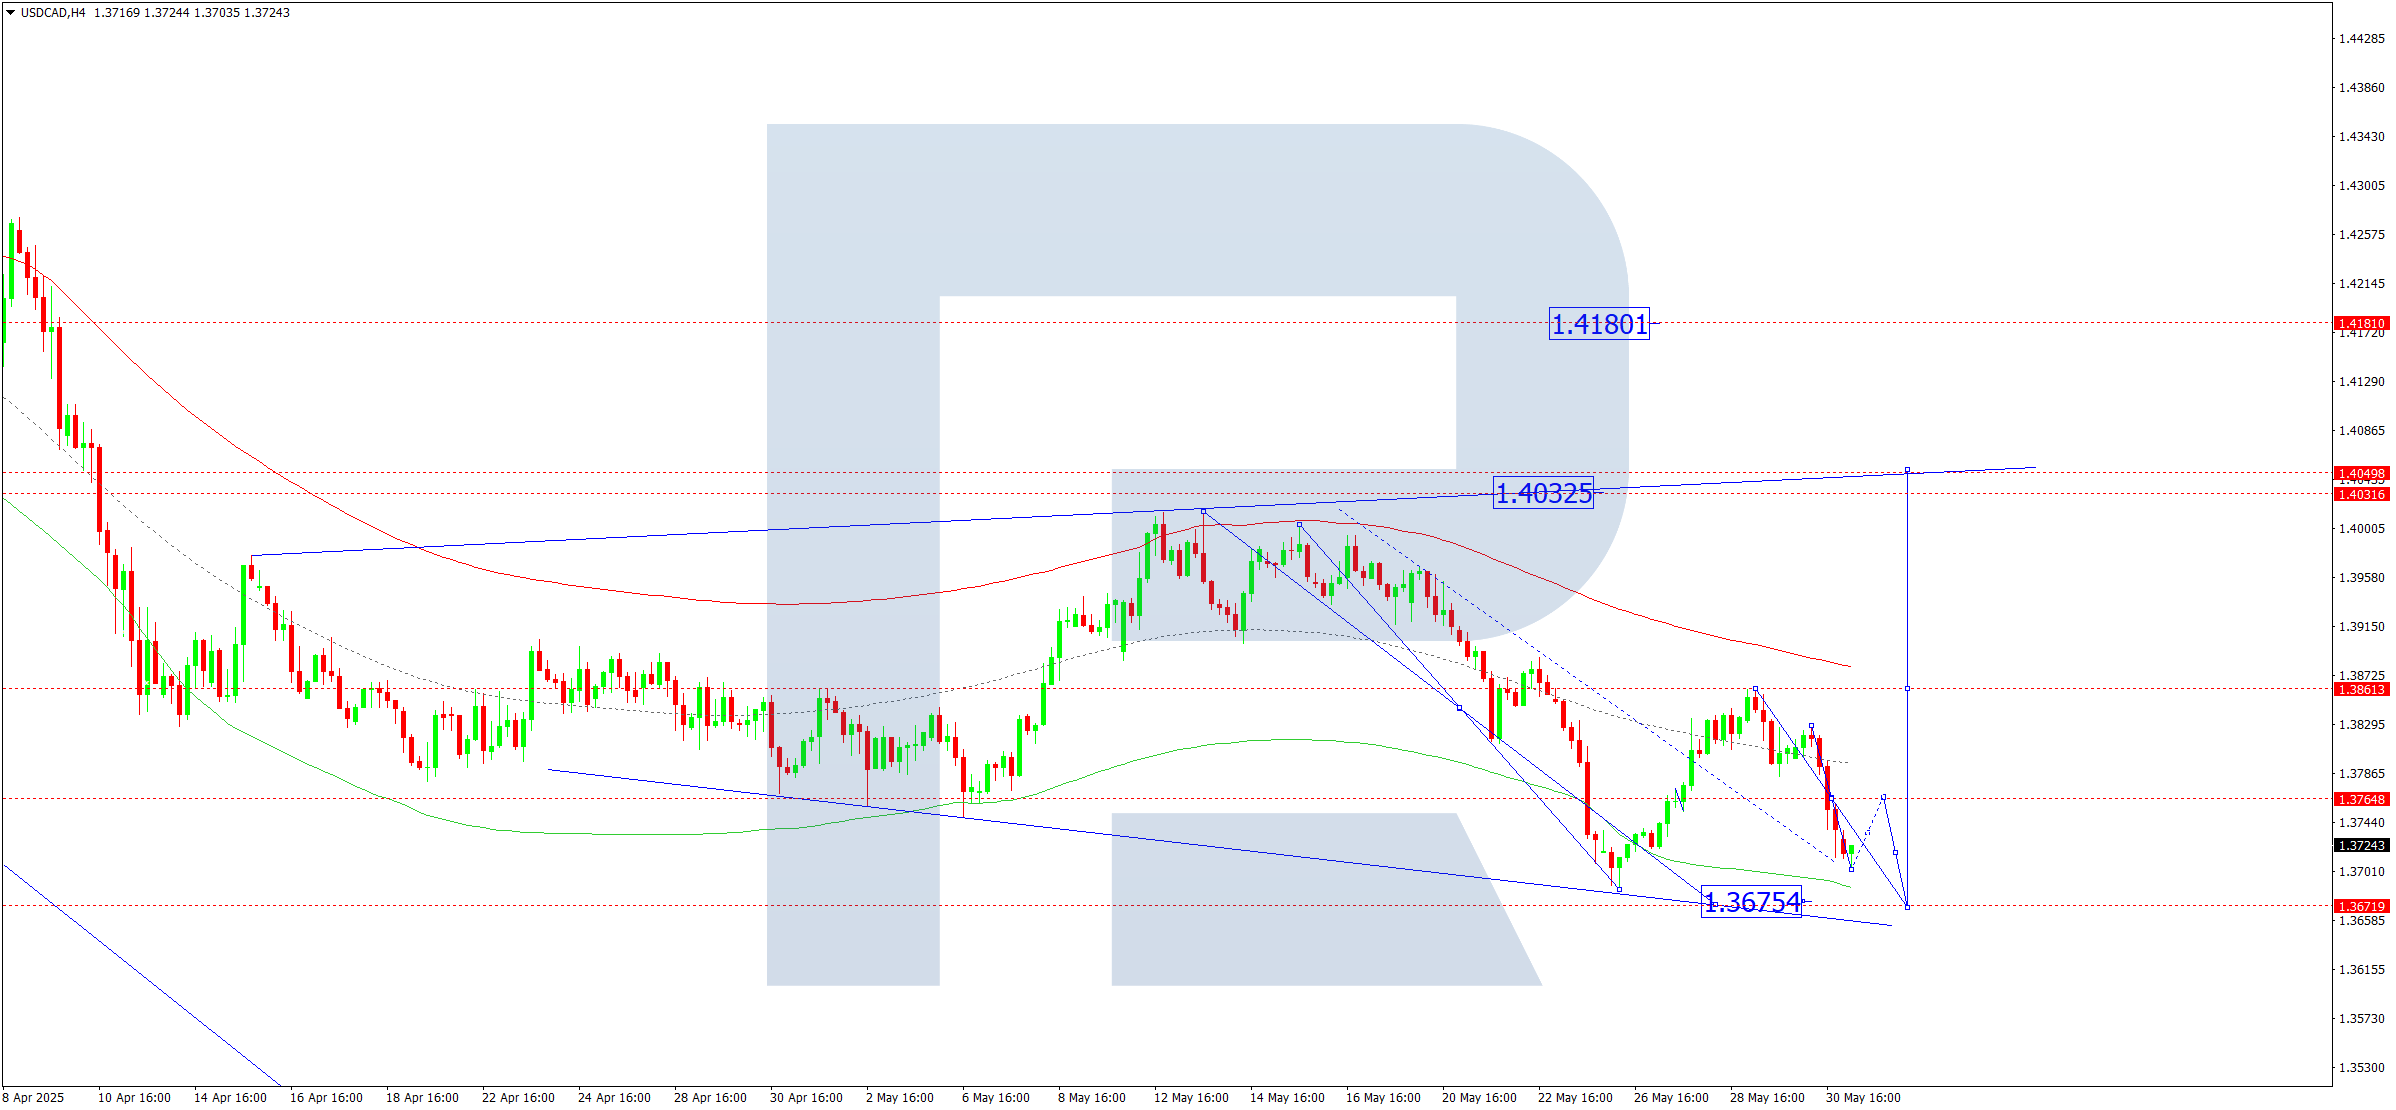
USDCAD forecast
On the H4 chart of USDCAD, the market is forming a downward wave towards 1.3675. Today, 2 June 2025, the market may reach this target. Afterwards, a new upward wave to 1.3860 may begin, potentially extending to 1.4040, the first target.
This scenario is confirmed by the Elliott wave structure and the downward wave matrix with a pivot at 1.3860, viewed as key in the USDCAD structure. The market is currently heading towards the lower boundary of the price Envelope at 1.3675. After reaching this level, we expect a new upward wave to the upper boundary at 1.4040.
Technical indicators for today’s USDCAD forecast suggest a continuation of the downward wave to 1.3675.
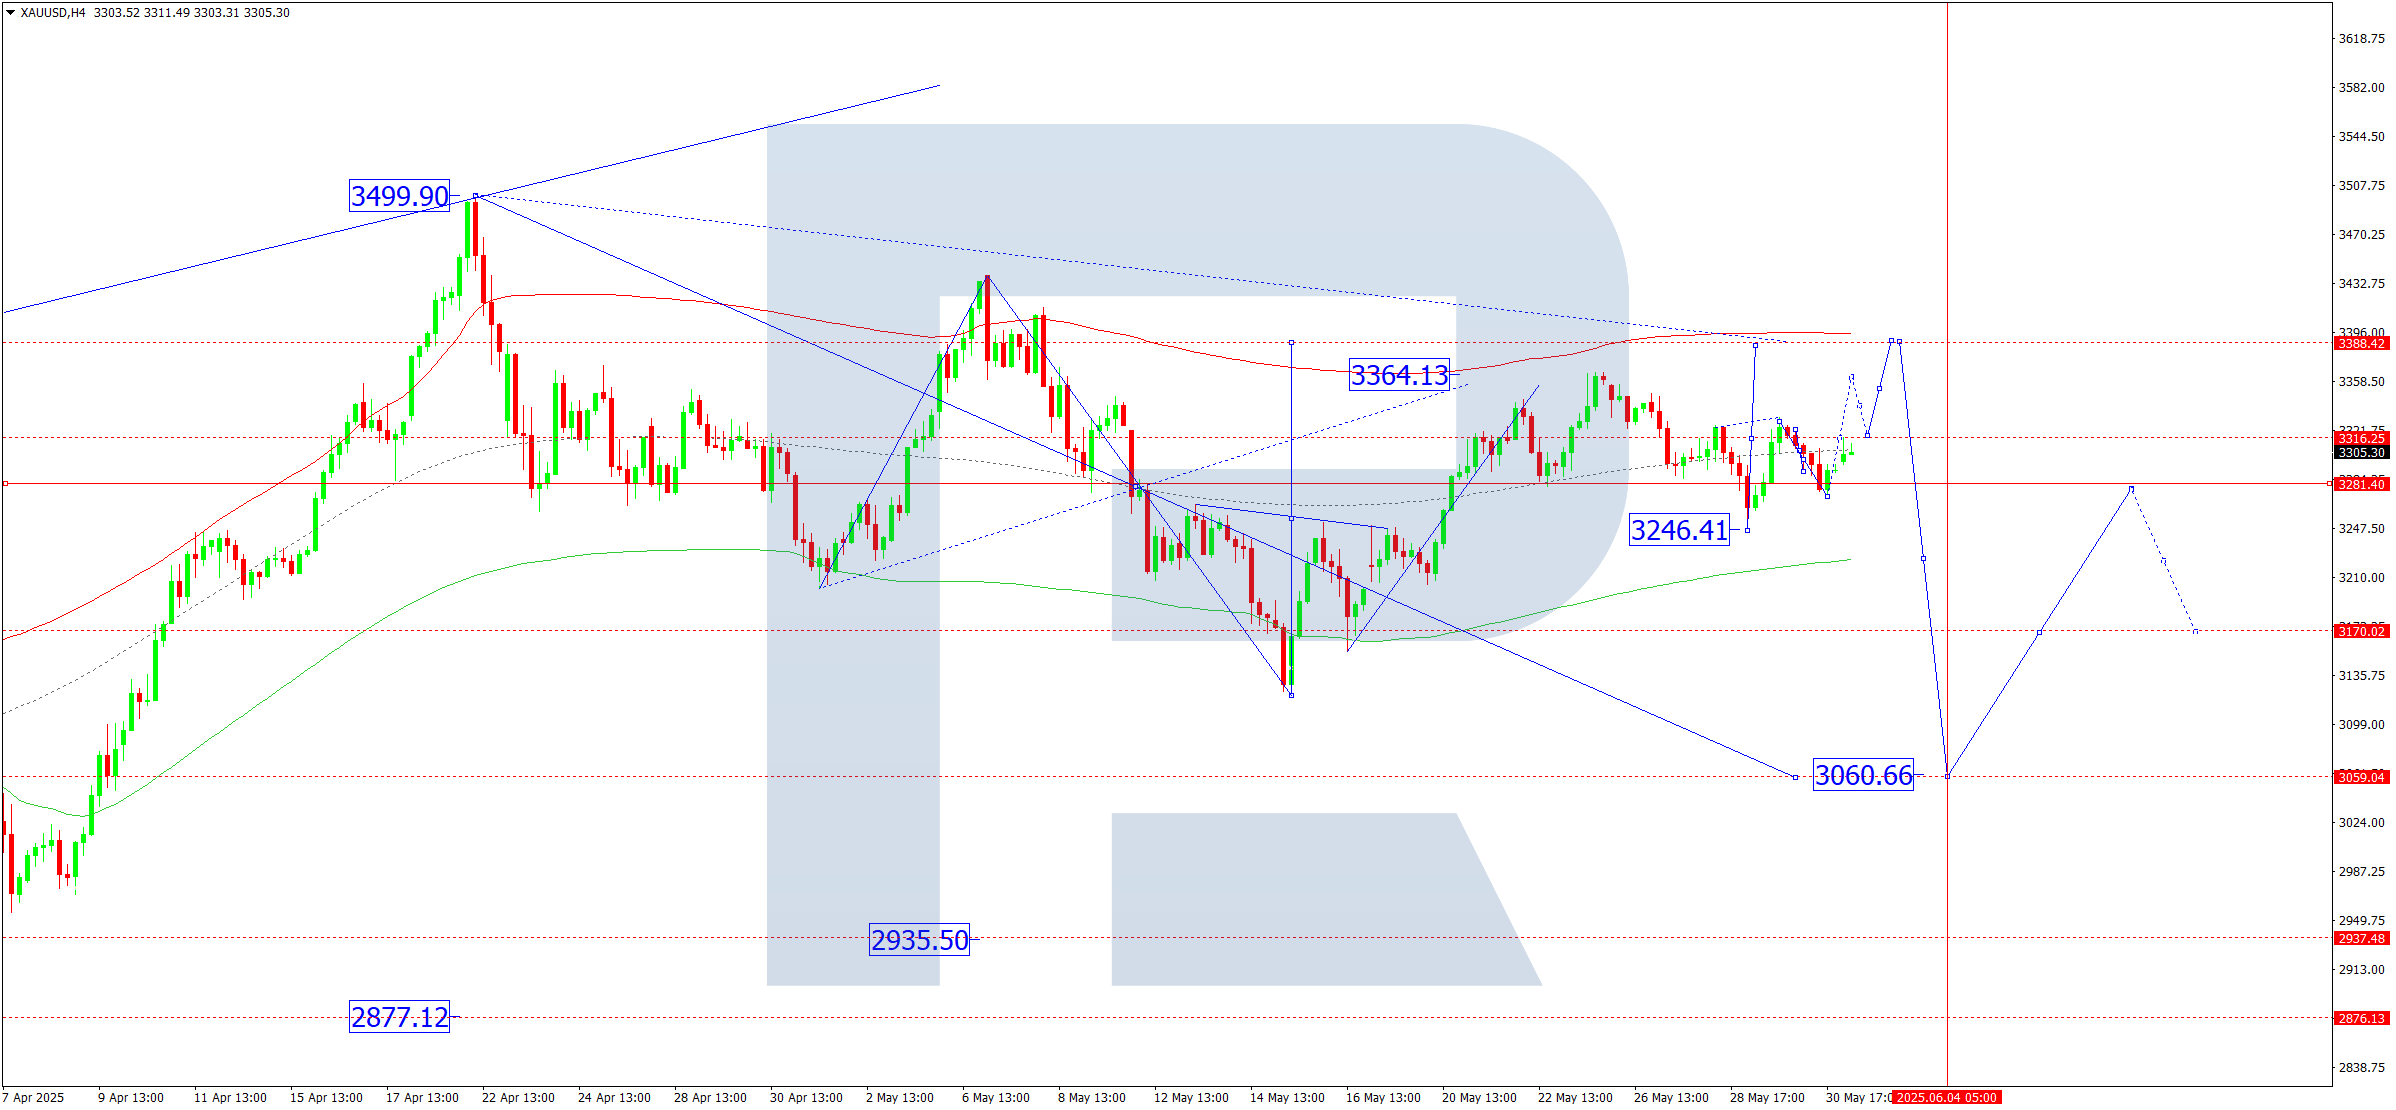
XAUUSD forecast
On the H4 chart of XAUUSD, the market completed an upward wave to 3,330 and corrected to 3,272. Today, 2 June 2025, the wave may continue rising to 3,388. After reaching this level, a fifth downward wave to 3,060 might begin.
This scenario is confirmed by the Elliott wave structure and the downward wave matrix with a pivot at 3,280, considered key in the current wave. The market corrected to the central line of the price Envelope at 3,280. Today, a rise to the upper boundary at 3,388 is expected.
Technical indicators for today’s XAUUSD forecast suggest a continuation of the upward wave to 3,388.
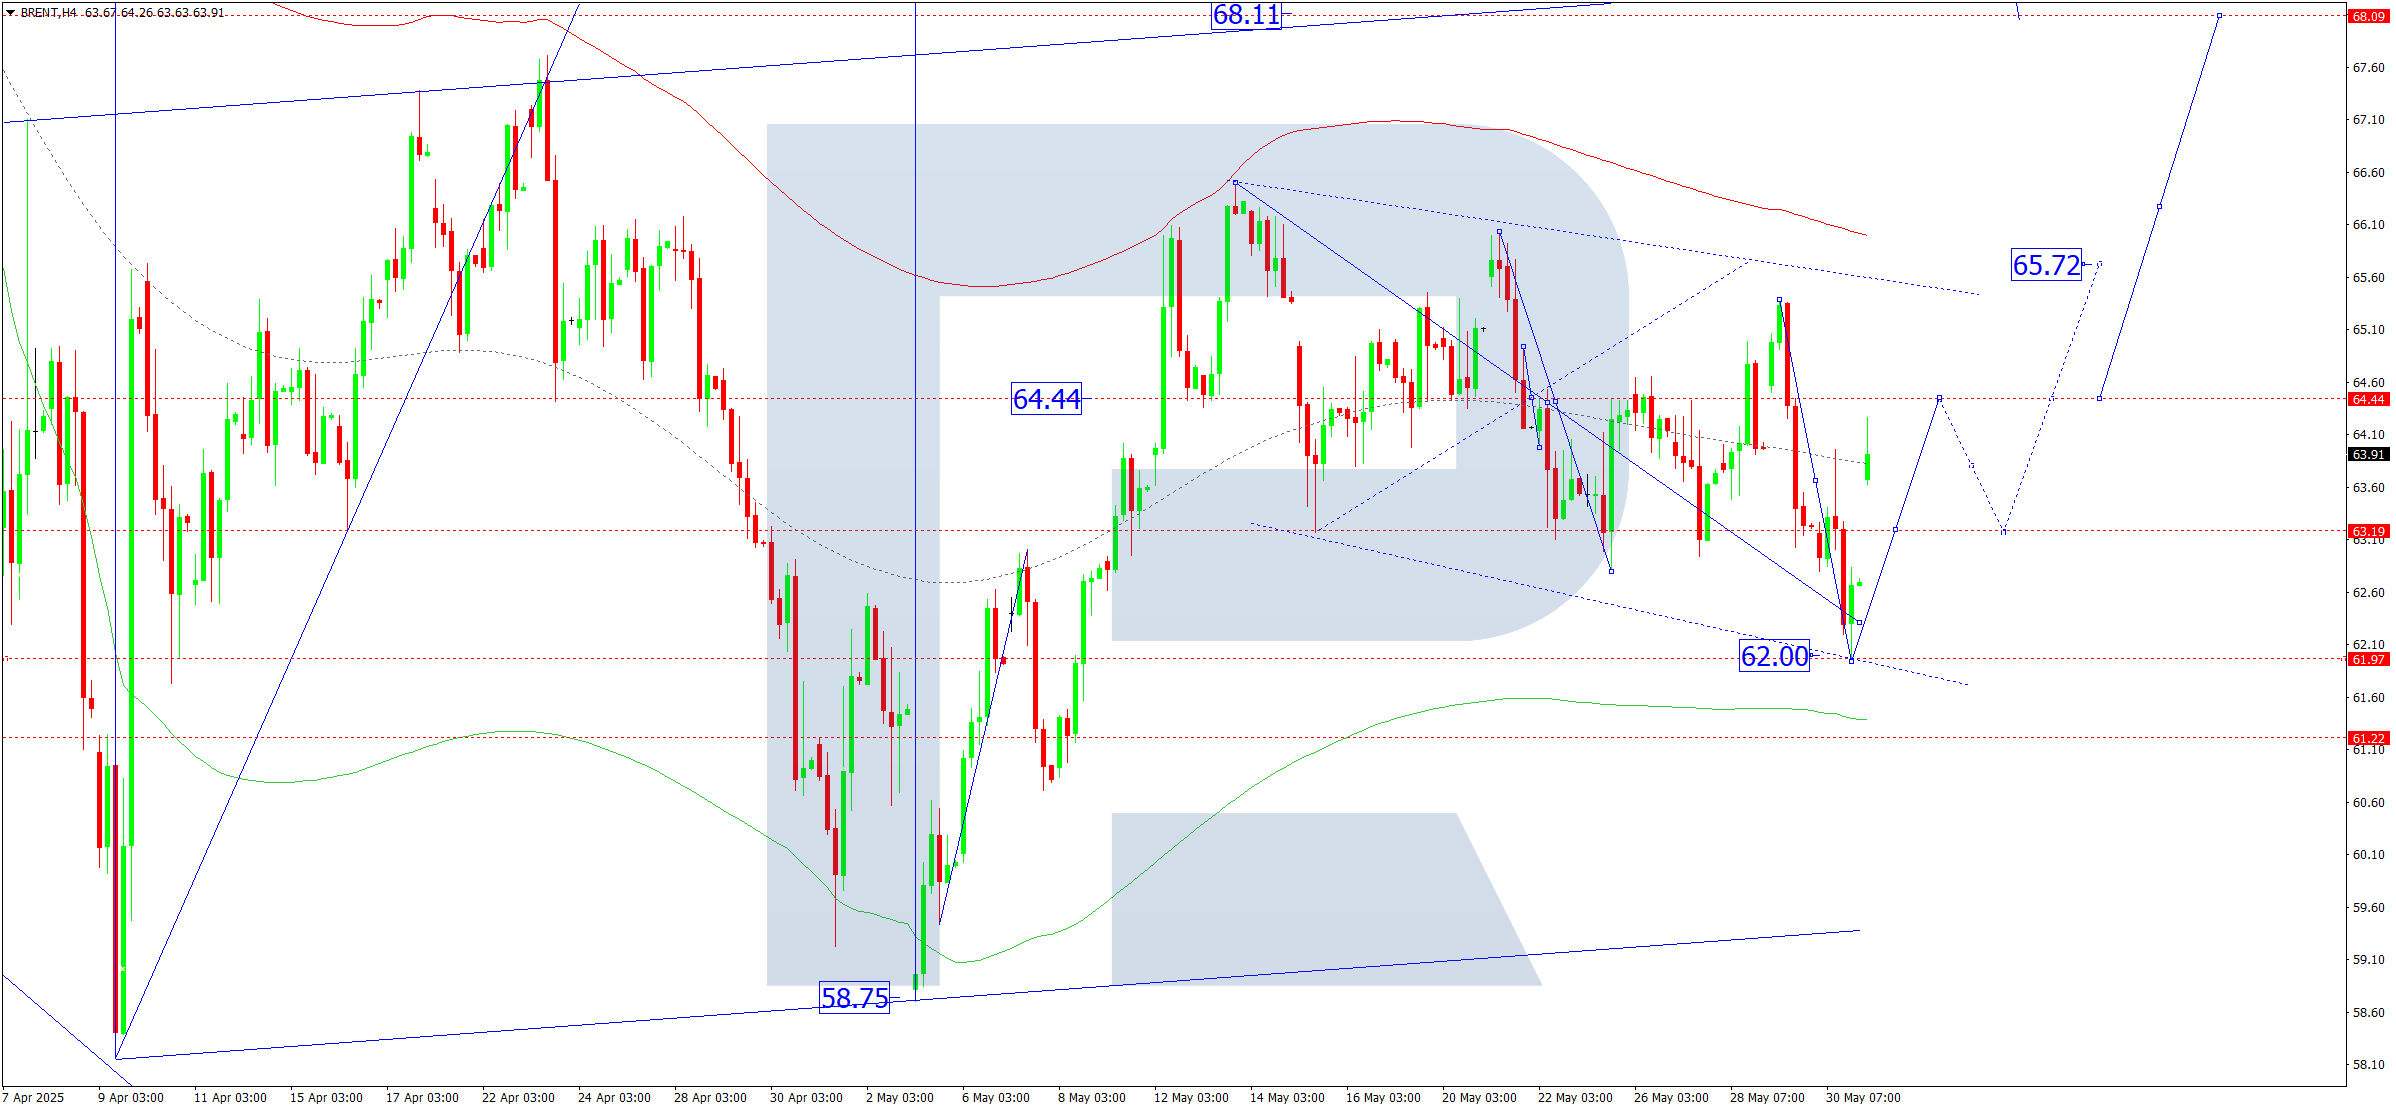
Brent forecast
On the H4 chart of Brent crude, the market completed a correction to 62.00. Today, 2 June 2025, a wave may rise to 64.44. A breakout above this level could trigger a continued wave to 65.75, the local target.
This scenario is confirmed by the Elliott wave structure and the downward wave matrix with a pivot at 64.44, seen as key for Brent. The market recently dropped to the lower boundary of the price Envelope at 62.00 and is now forming a structure to rise to the central line at 64.44. A breakout upwards could extend the trend to the upper boundary at 65.75.
Technical indicators for today’s Brent forecast suggest continued growth to 65.75.
Forecasts presented in this section only reflect the author’s private opinion and should not be considered as guidance for trading. RoboForex bears no responsibility for trading results based on trading recommendations described in these analytical reviews.