Daily technical analysis and forecast for 26 May 2025
Here is a detailed daily technical analysis and forecast for EURUSD, USDJPY, GBPUSD, AUDUSD, USDCAD, XAUUSD and Brent for 26 May 2025.
EURUSD forecast
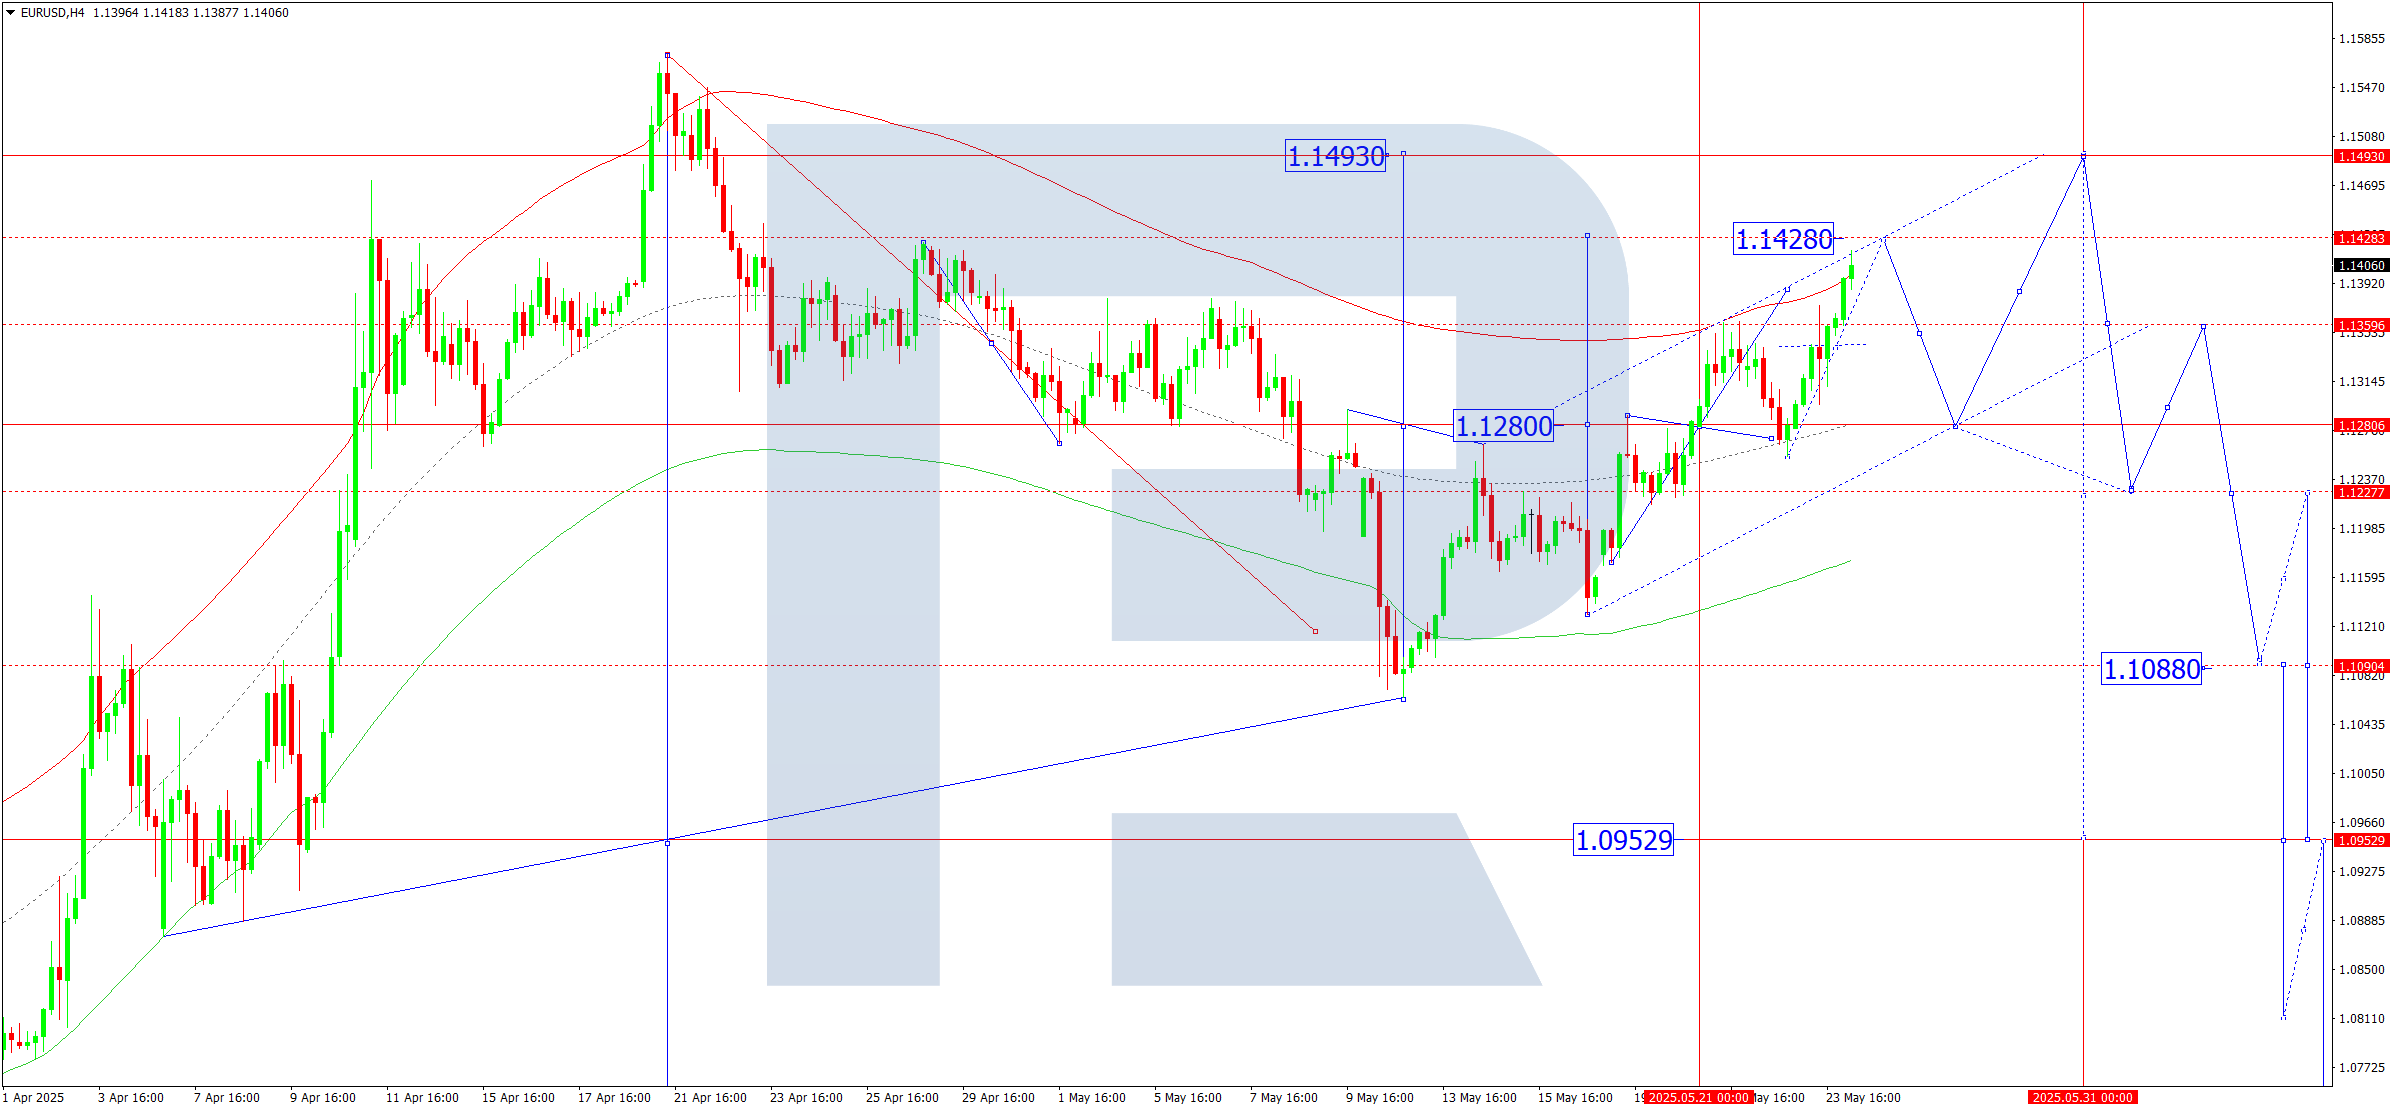
On the H4 chart of EURUSD, the market formed a consolidation range around 1.1280 and broke upwards, suggesting a possible continuation of the correction towards 1.1428. Today, 26 May 2025, the price is expected to reach this target. Afterwards, a decline to 1.1280 may follow.
This scenario is technically confirmed by the Elliott wave structure and the upward wave matrix with a pivot at 1.1280, seen as key in the EURUSD wave. Currently, the correction is developing towards the upper boundary of the price Envelope at 1.1428. The price is expected to reach this level today before correcting towards the central line at 1.1280.
Technical indicators for today’s EURUSD forecast suggest a downward wave towards 1.1280.
USDJPY forecast
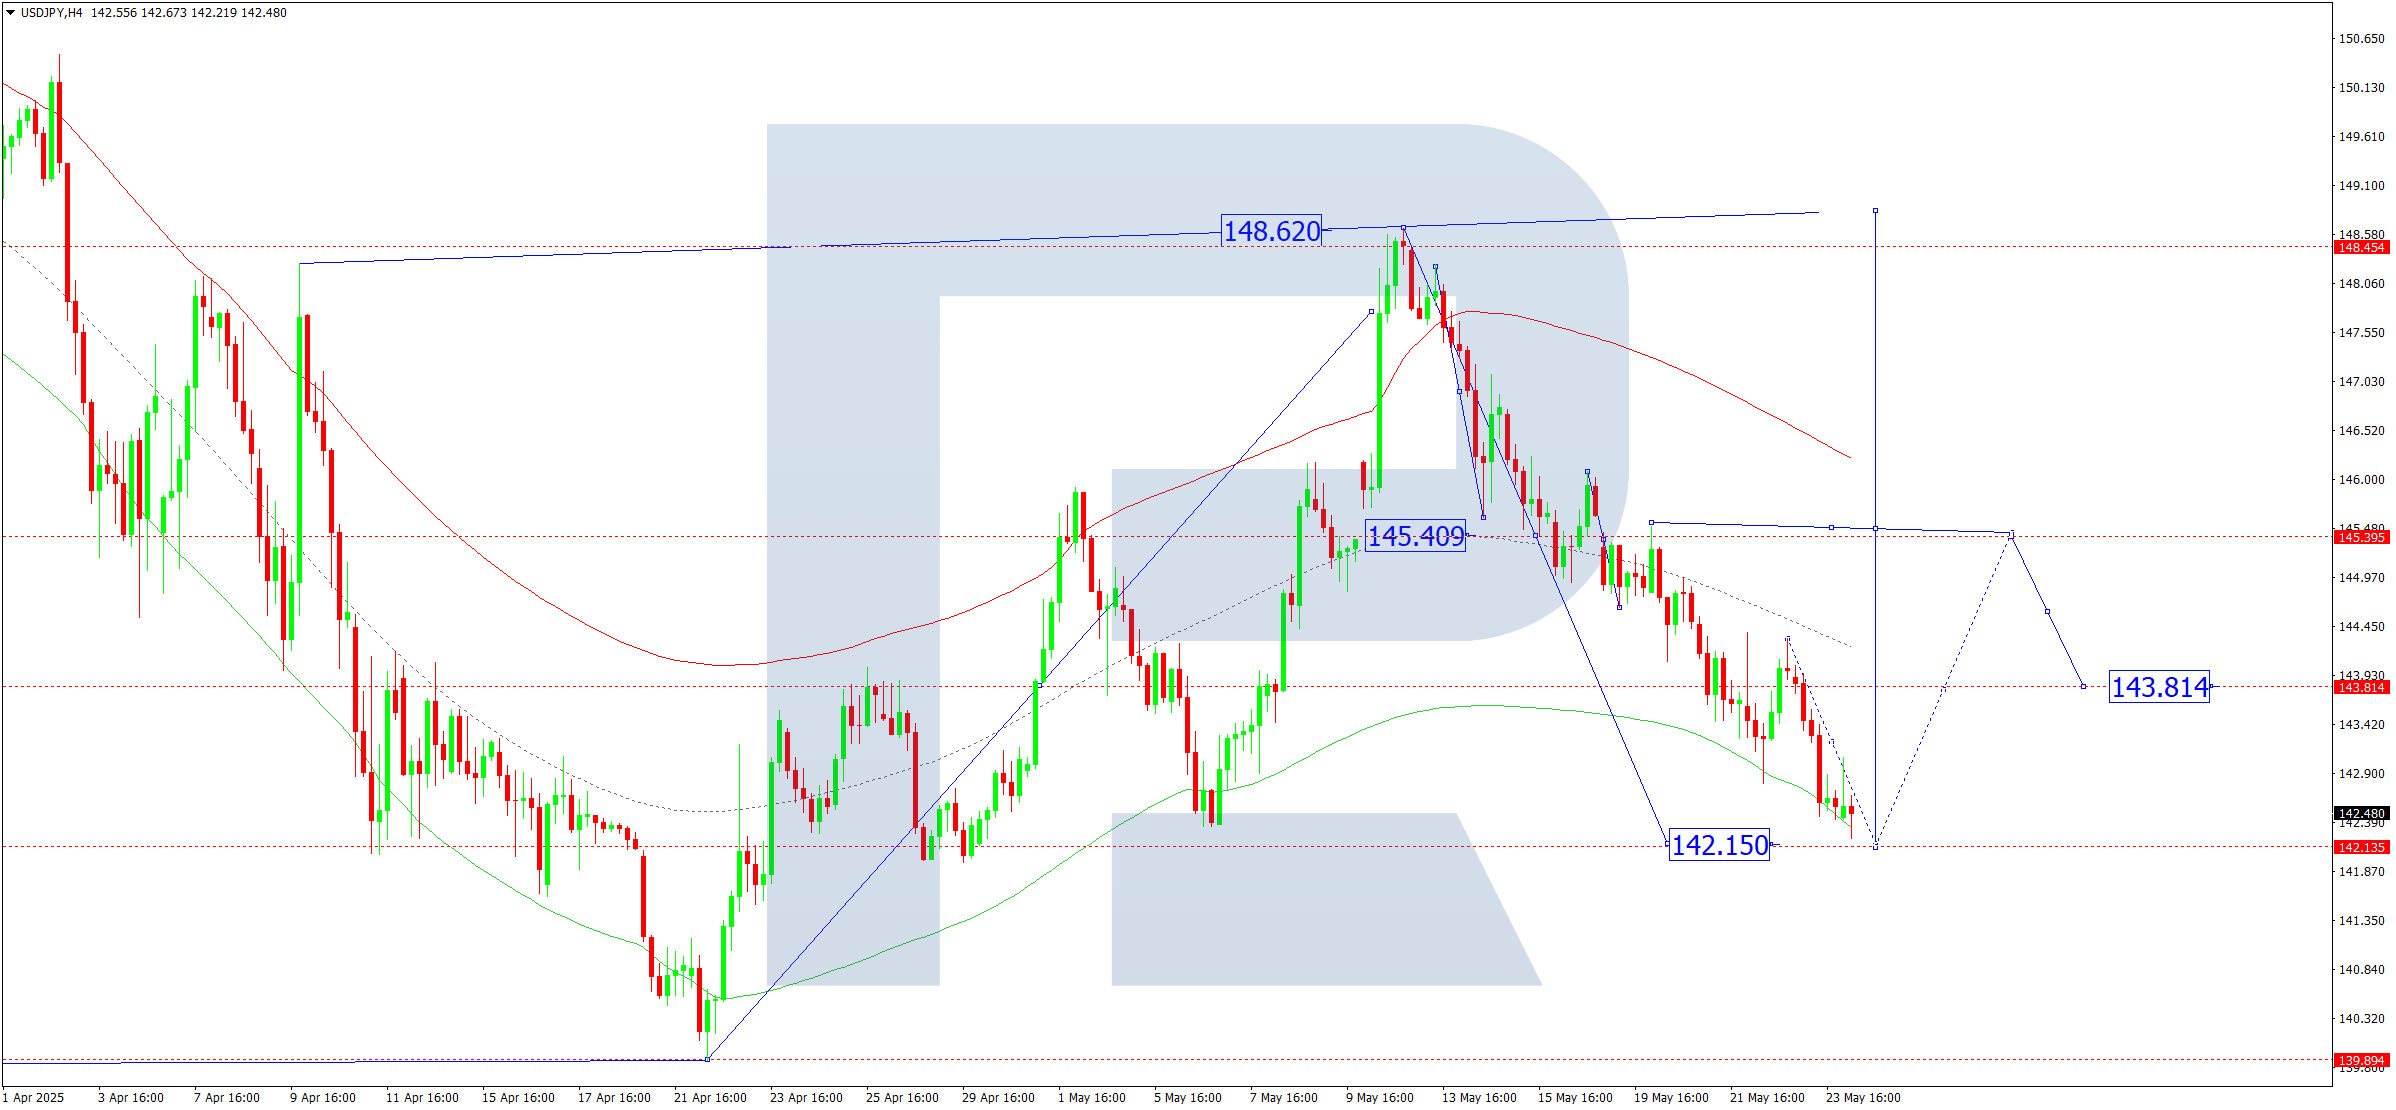
On the H4 chart of USDJPY, the market formed a consolidation range around 145.40 and broke downwards, continuing the downward wave to 142.15. Today, 26 May 2025, the price is expected to reach this level. Then, a new upward wave towards 145.40 may begin, potentially continuing the trend to 148.60, the local target.
This scenario is supported by the Elliott wave structure and the upward wave matrix with a pivot at 143.38, viewed as key in this structure. Currently, the market is forming a correction towards the lower boundary of the price Envelope at 142.15. Today, a bounce from this level and the development of an upward wave towards the upper boundary at 148.60 remains relevant.
Technical indicators for today’s USDJPY forecast suggest a rise to 145.40.
GBPUSD forecast
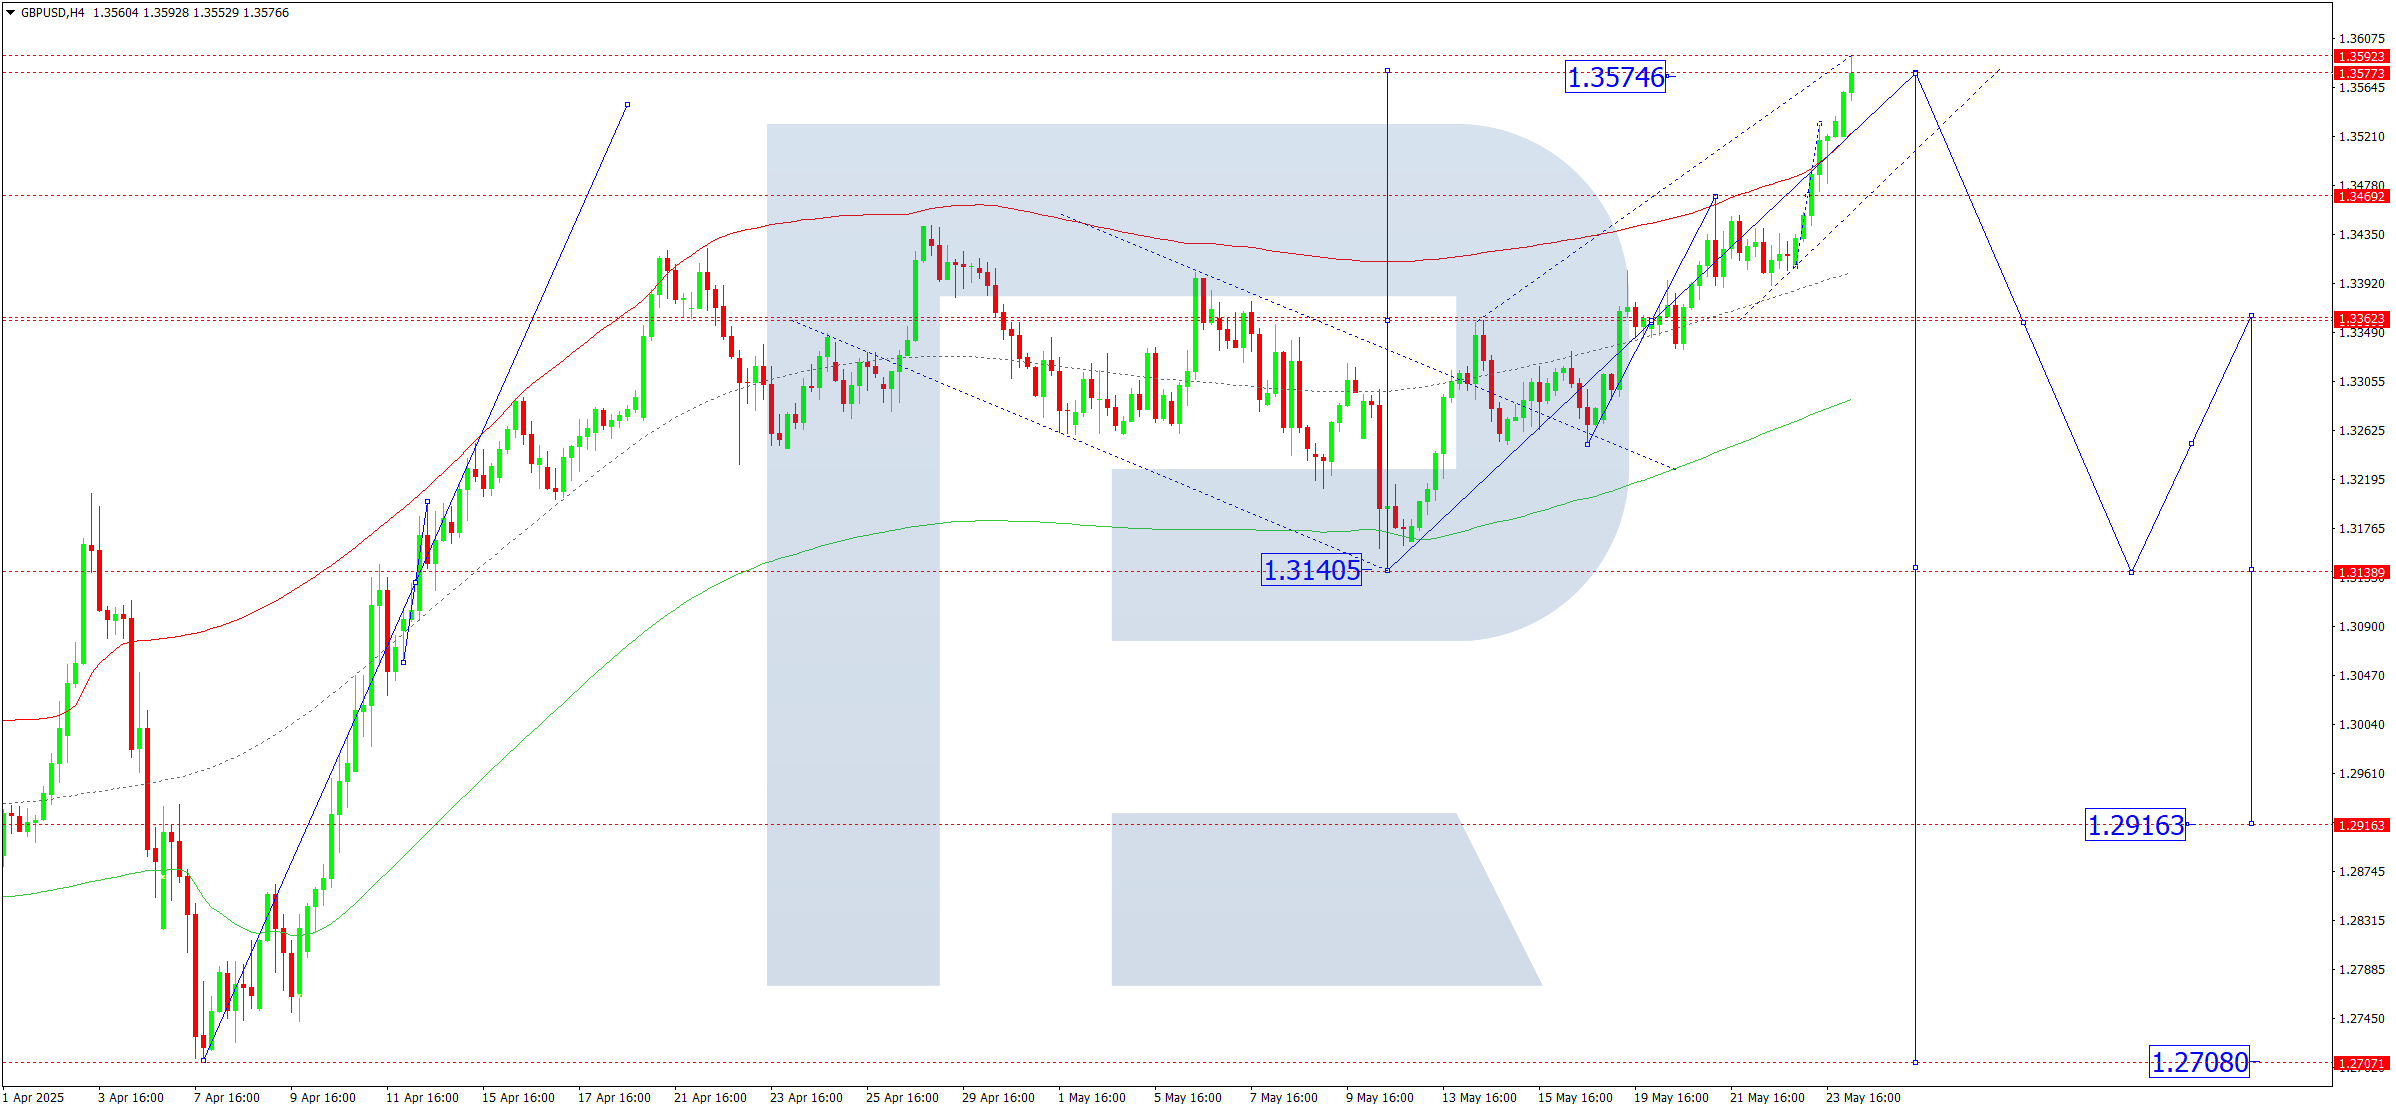
On the H4 chart of GBPUSD, the market formed a consolidation range around 1.3363 and broke upwards, continuing the upward wave to 1.3590. Today, 26 May 2025, the first downward wave is expected to begin, aiming for 1.3363. A breakout below this level would open potential for a continuation of the trend towards 1.3140, the first target.
This scenario is confirmed by the Elliott wave structure and the upward wave matrix with a pivot at 1.3280, seen as key in GBPUSD’s wave formation. The market has extended to the upper boundary of the price Envelope at 1.3590. Today, a move to the central line at 1.3363 is possible, followed by a continuation of the downward wave to 1.3140.
Technical indicators for today’s GBPUSD forecast suggest the beginning of a downward wave to 1.3363.
AUDUSD forecast
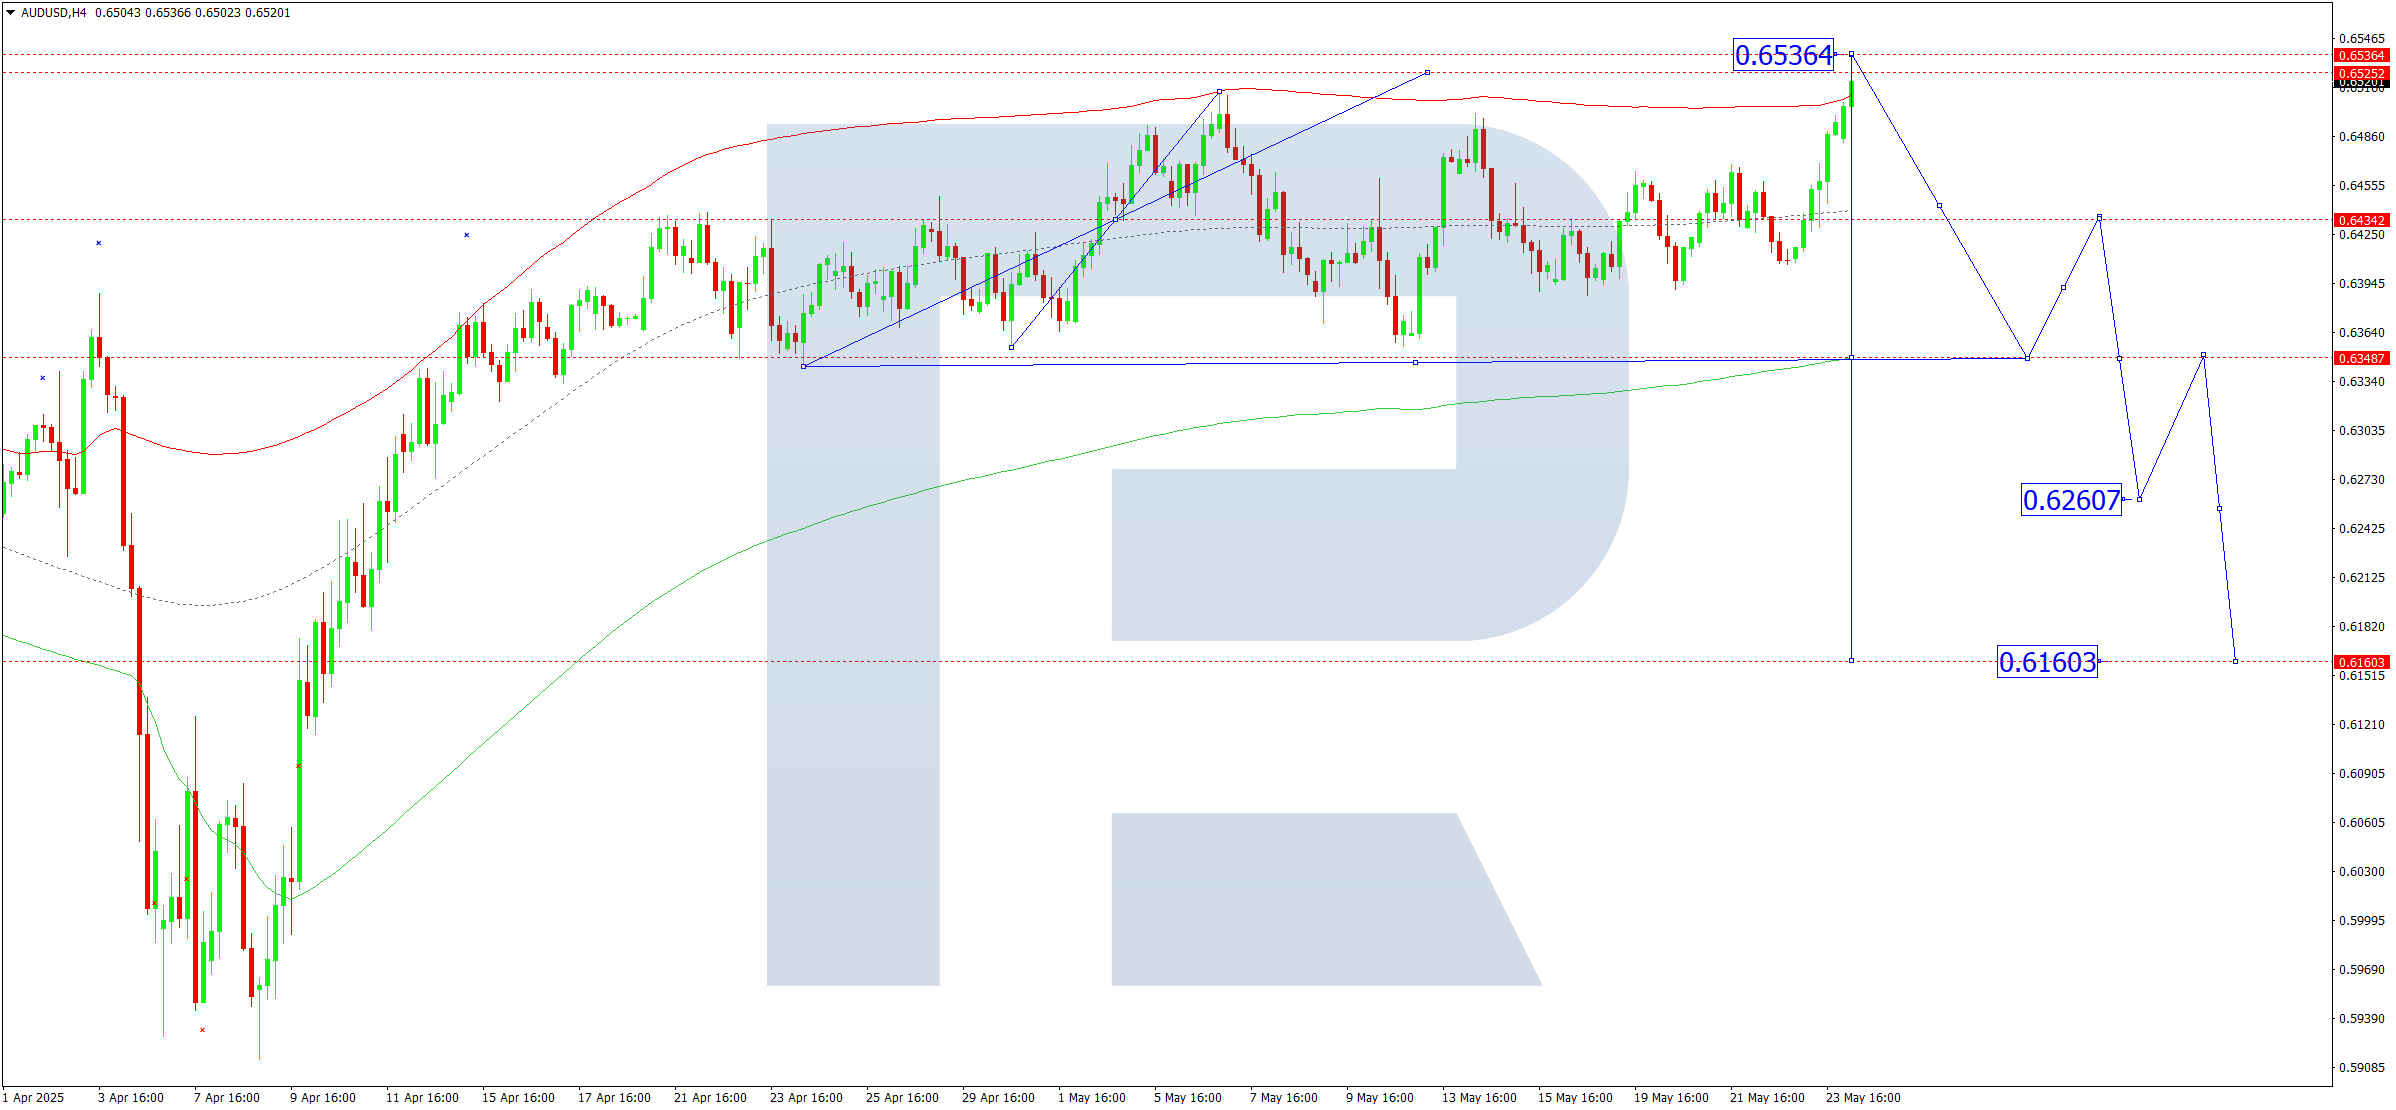
On the H4 chart of AUDUSD, the market formed a wide consolidation range around 0.6434 and expanded it upwards to 0.6536. Today, 26 May 2025, a decline towards 0.6430 is possible. A breakout below this level may open the path for a trend continuation to 0.6350.
This scenario is confirmed by the Elliott wave structure and the upward wave matrix with a pivot at 0.6430, considered key in this wave formation. The market has completed a structure to the upper boundary of the price Envelope at 0.6536. Today, a downward wave towards the lower boundary at 0.6333 remains relevant.
Technical indicators for today’s AUDUSD forecast suggest a likely decline to 0.6350.
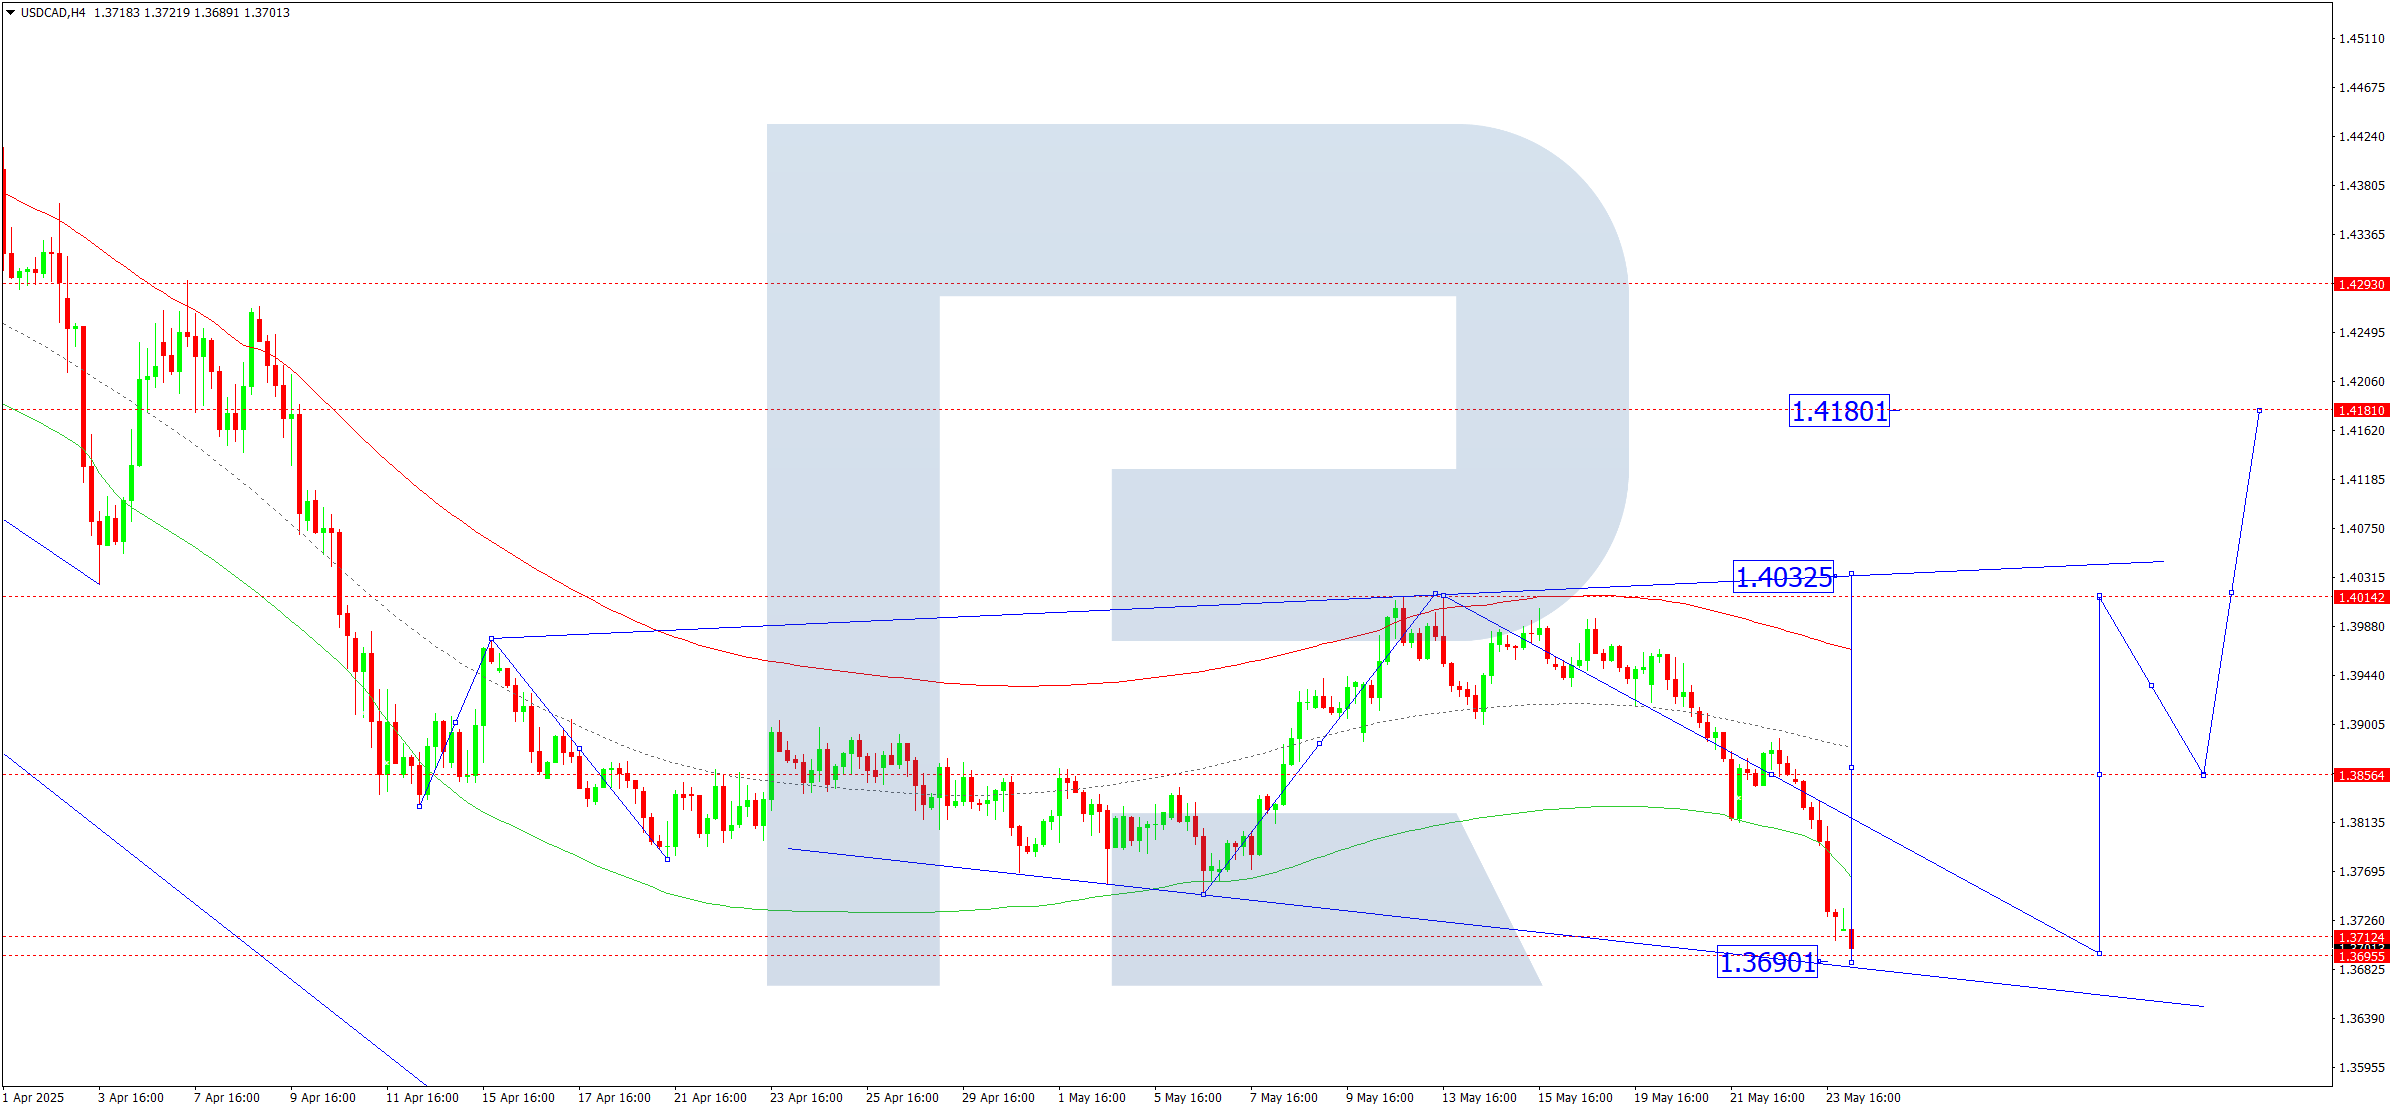
USDCAD forecast
On the H4 chart of USDCAD, the market continues to develop a consolidation range around 1.3880. Today, 26 May 2025, the range expanded down to 1.3690. A new upward wave is expected to begin, aiming for the upper boundary of this range at 1.4033.
This scenario is supported by the Elliott wave structure and the downward wave matrix with a pivot at 1.3880, seen as key in USDCAD's structure. The market completed a downward wave to the lower boundary of the price Envelope at 1.3690. Today, a rise to the central line at 1.3880 and then to the upper boundary at 1.4033 is possible.
Technical indicators for today’s USDCAD forecast suggest a rise to 1.4033.
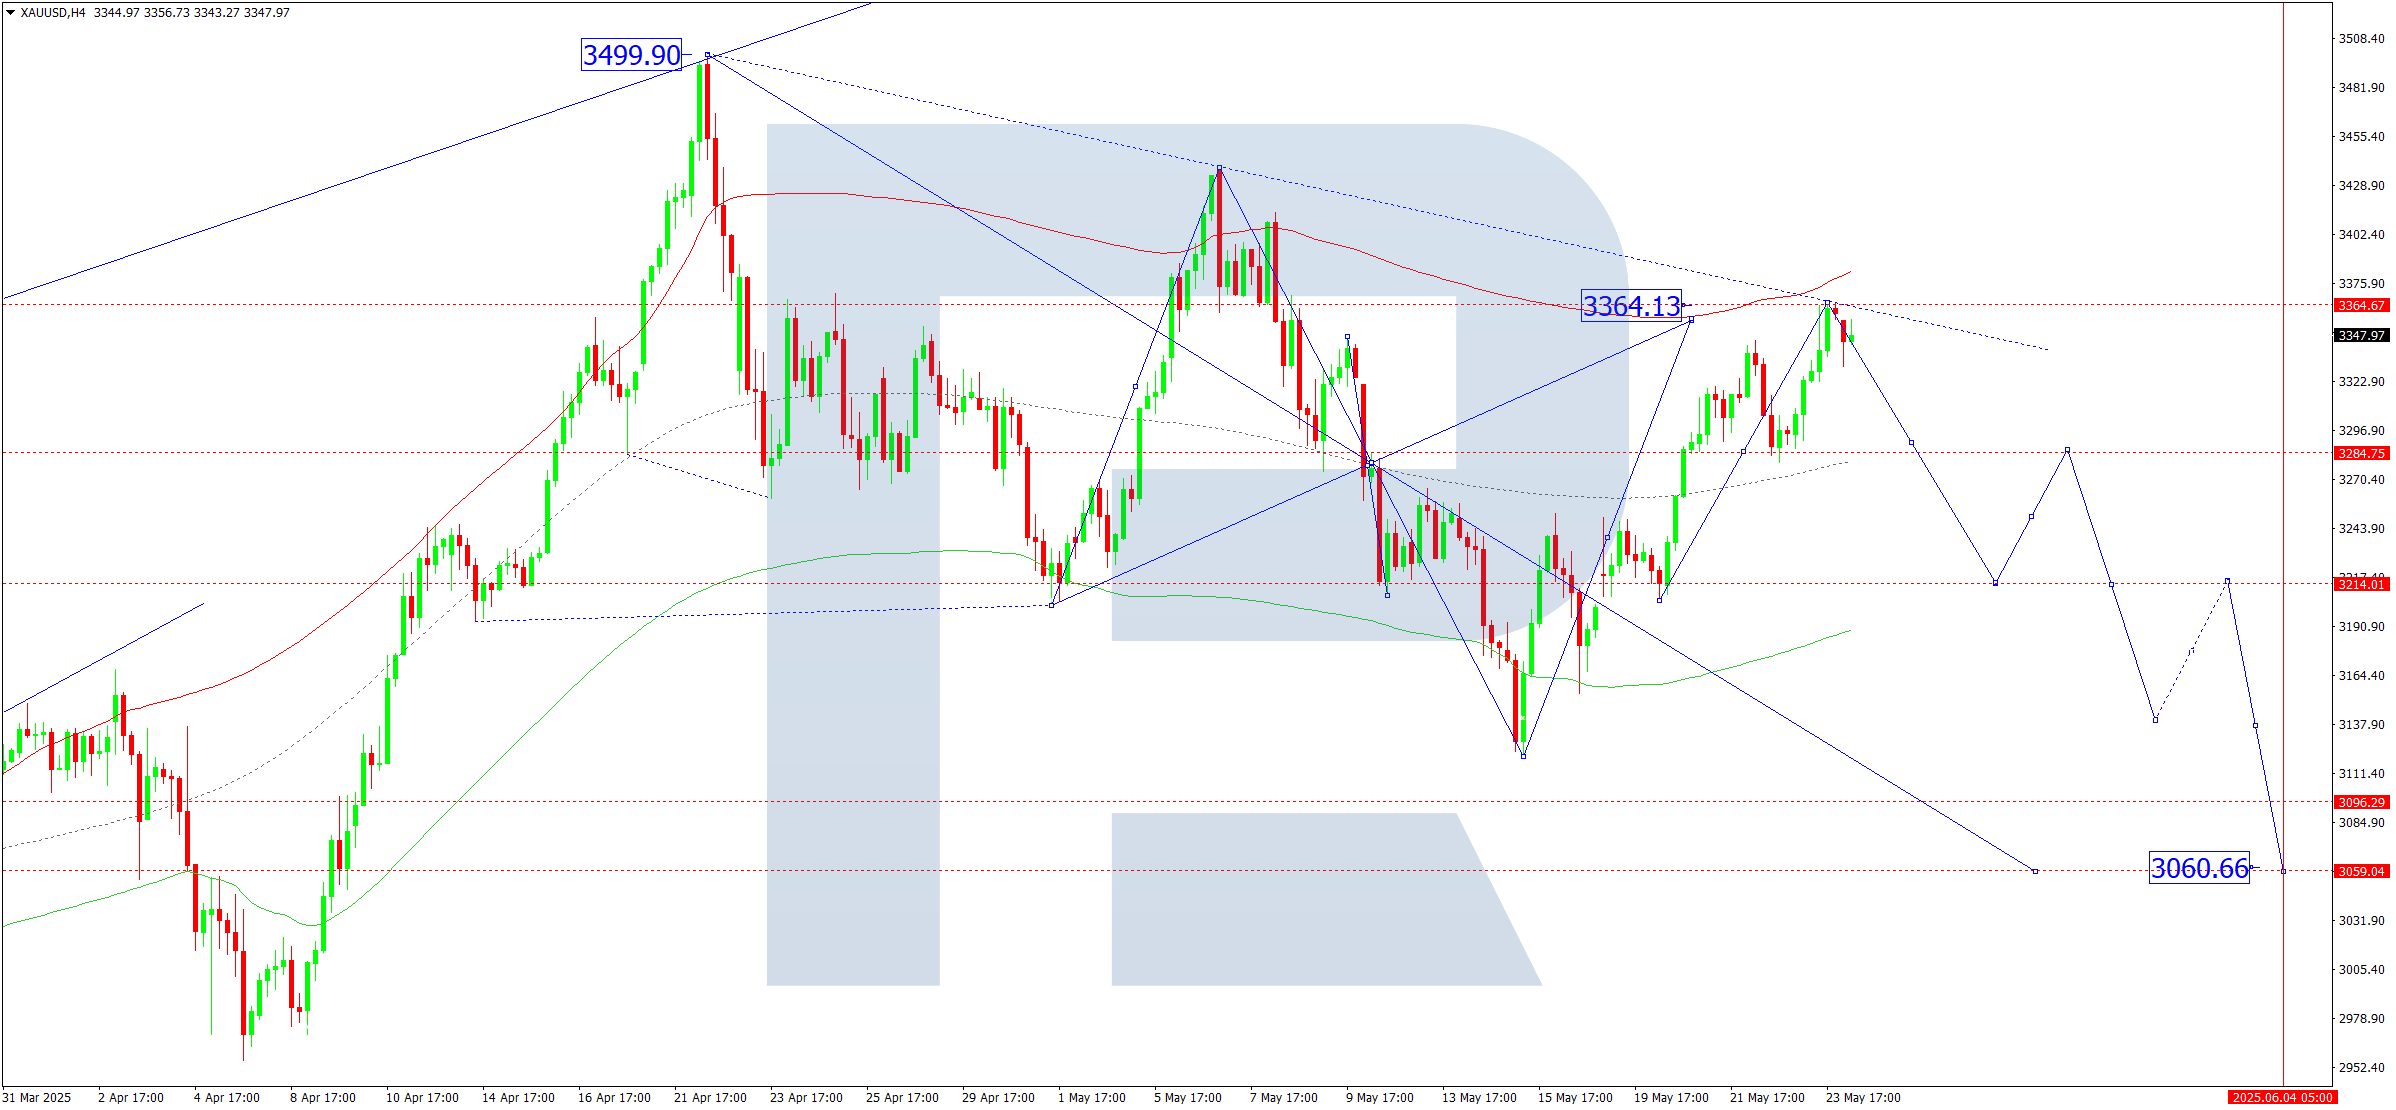
XAUUSD forecast
On the H4 chart of XAUUSD, the market found support at 3,280 and expanded the consolidation range upwards to 3,364. Today, 26 May 2025, we consider the possibility of a new decline towards 3,280. A breakout below this level could open potential for a continued trend to 3,060, the first target.
This scenario is supported by the Elliott wave structure and the downward wave matrix with a pivot at 3,280, regarded as key in this wave for XAUUSD. The market completed a correction to the upper boundary of the price Envelope at 3,364. Today, a new downward wave to the lower boundary at 3,060 is possible.
Technical indicators for today’s XAUUSD forecast point to the beginning of a downward wave to 3,060.
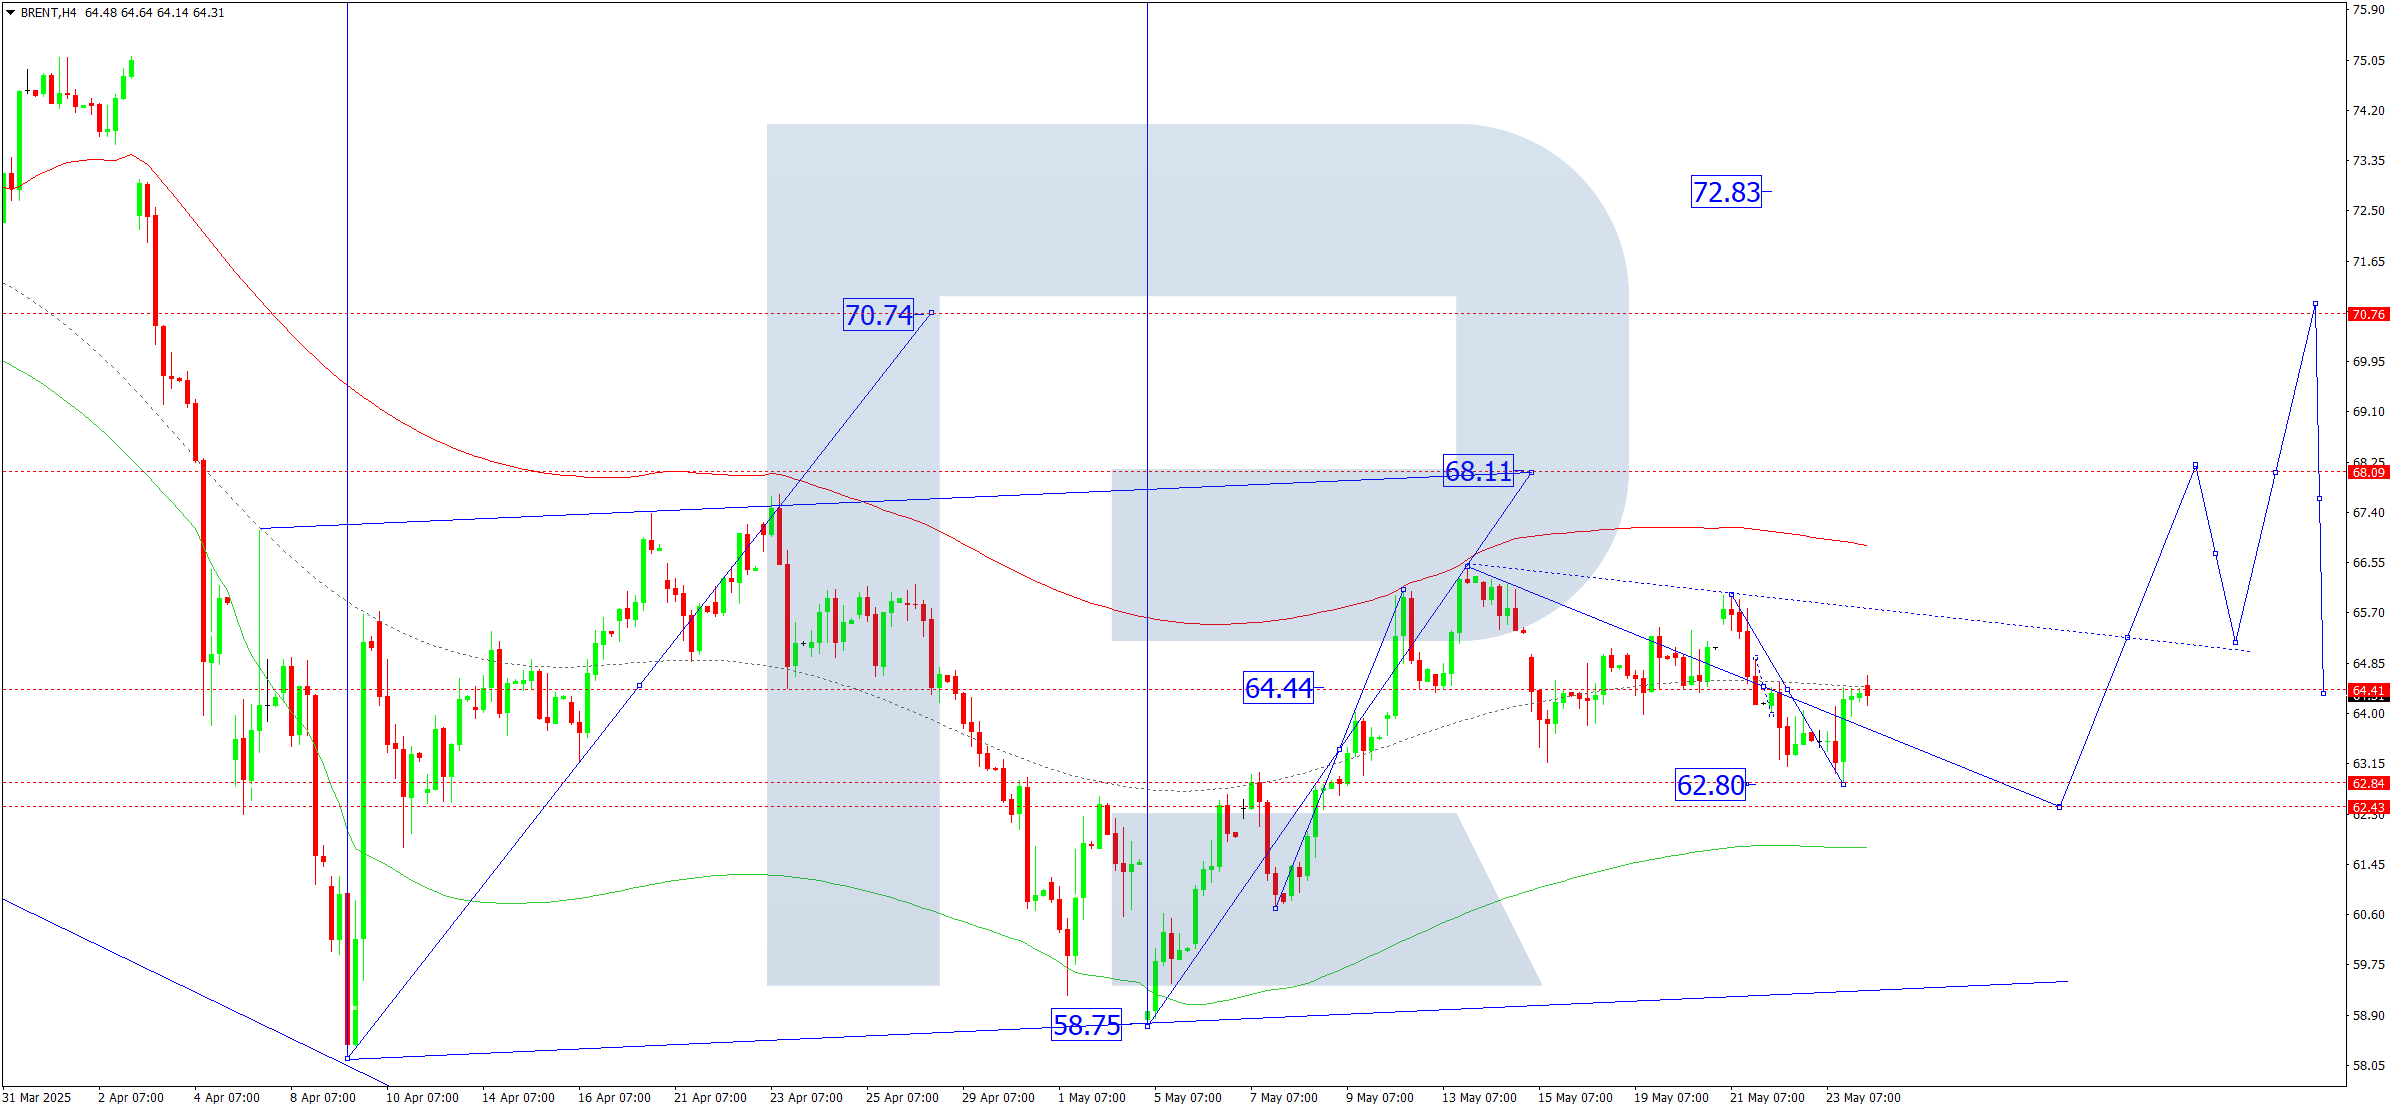
Brent forecast
On the H4 chart of Brent crude, the market continues developing a consolidation range around 64.44. Today, 26 May 2025, a downward expansion to 62.50 is possible, with the correction potentially extending to 62.22. Then, a new upward wave to 68.11 may follow. This is the initial target.
This scenario is confirmed by the Elliott wave structure and the upward wave matrix with a pivot at 63.33, seen as key in Brent’s wave structure. Currently, the market is forming a correction towards the lower boundary of the price Envelope at 62.22.
Technical indicators for today’s Brent forecast suggest a continued correction to 62.22.
Forecasts presented in this section only reflect the author’s private opinion and should not be considered as guidance for trading. RoboForex bears no responsibility for trading results based on trading recommendations described in these analytical reviews.