Daily technical analysis and forecast for 23 May 2025
Here is a detailed daily technical analysis and forecast for EURUSD, USDJPY, GBPUSD, AUDUSD, USDCAD, XAUUSD and Brent for 23 May 2025.
EURUSD forecast
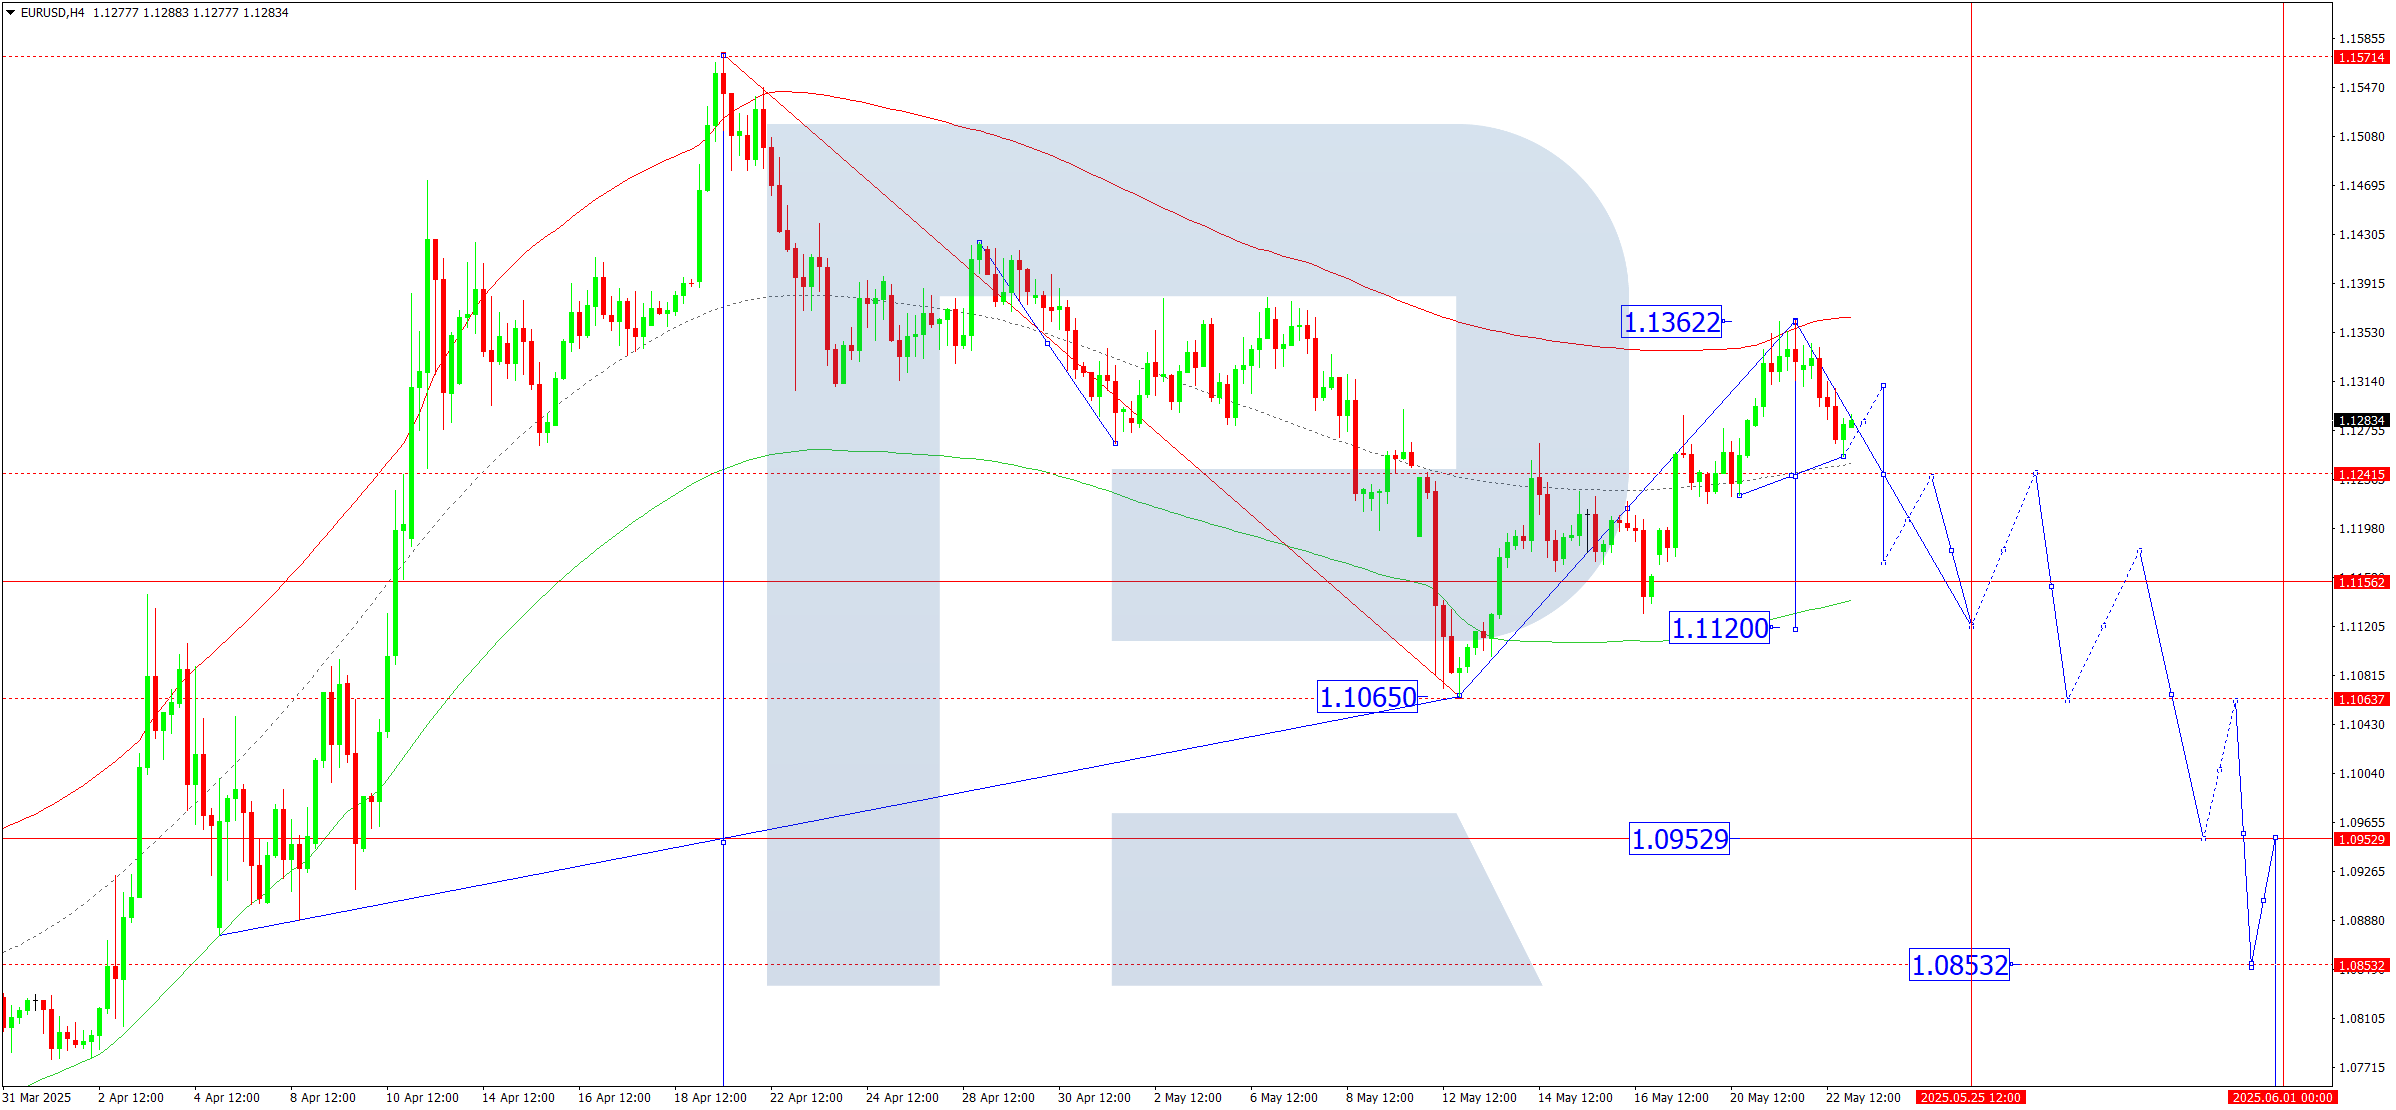
On the H4 chart of EURUSD, the market formed a consolidation range around 1.1311 and, after breaking down, completed a decline to 1.1255. Today, 23 May 2025, a corrective move to 1.1311 (testing from below) is expected. Subsequently, another downward wave could follow, aiming for 1.1170, the local target.
This scenario is supported by the Elliott wave structure and the downward wave matrix with a pivot at 1.1300, considered key in EURUSD's wave structure. The correction to the upper boundary of the price Envelope at 1.1362 has been completed. Today, the market is expected to develop a consolidation range around the central line at 1.1240. A breakout to the downside could extend the wave towards the lower boundary at 1.1120 at minimum.
Technical indicators for today’s EURUSD forecast suggest a new downward wave towards 1.1170.
USDJPY forecast
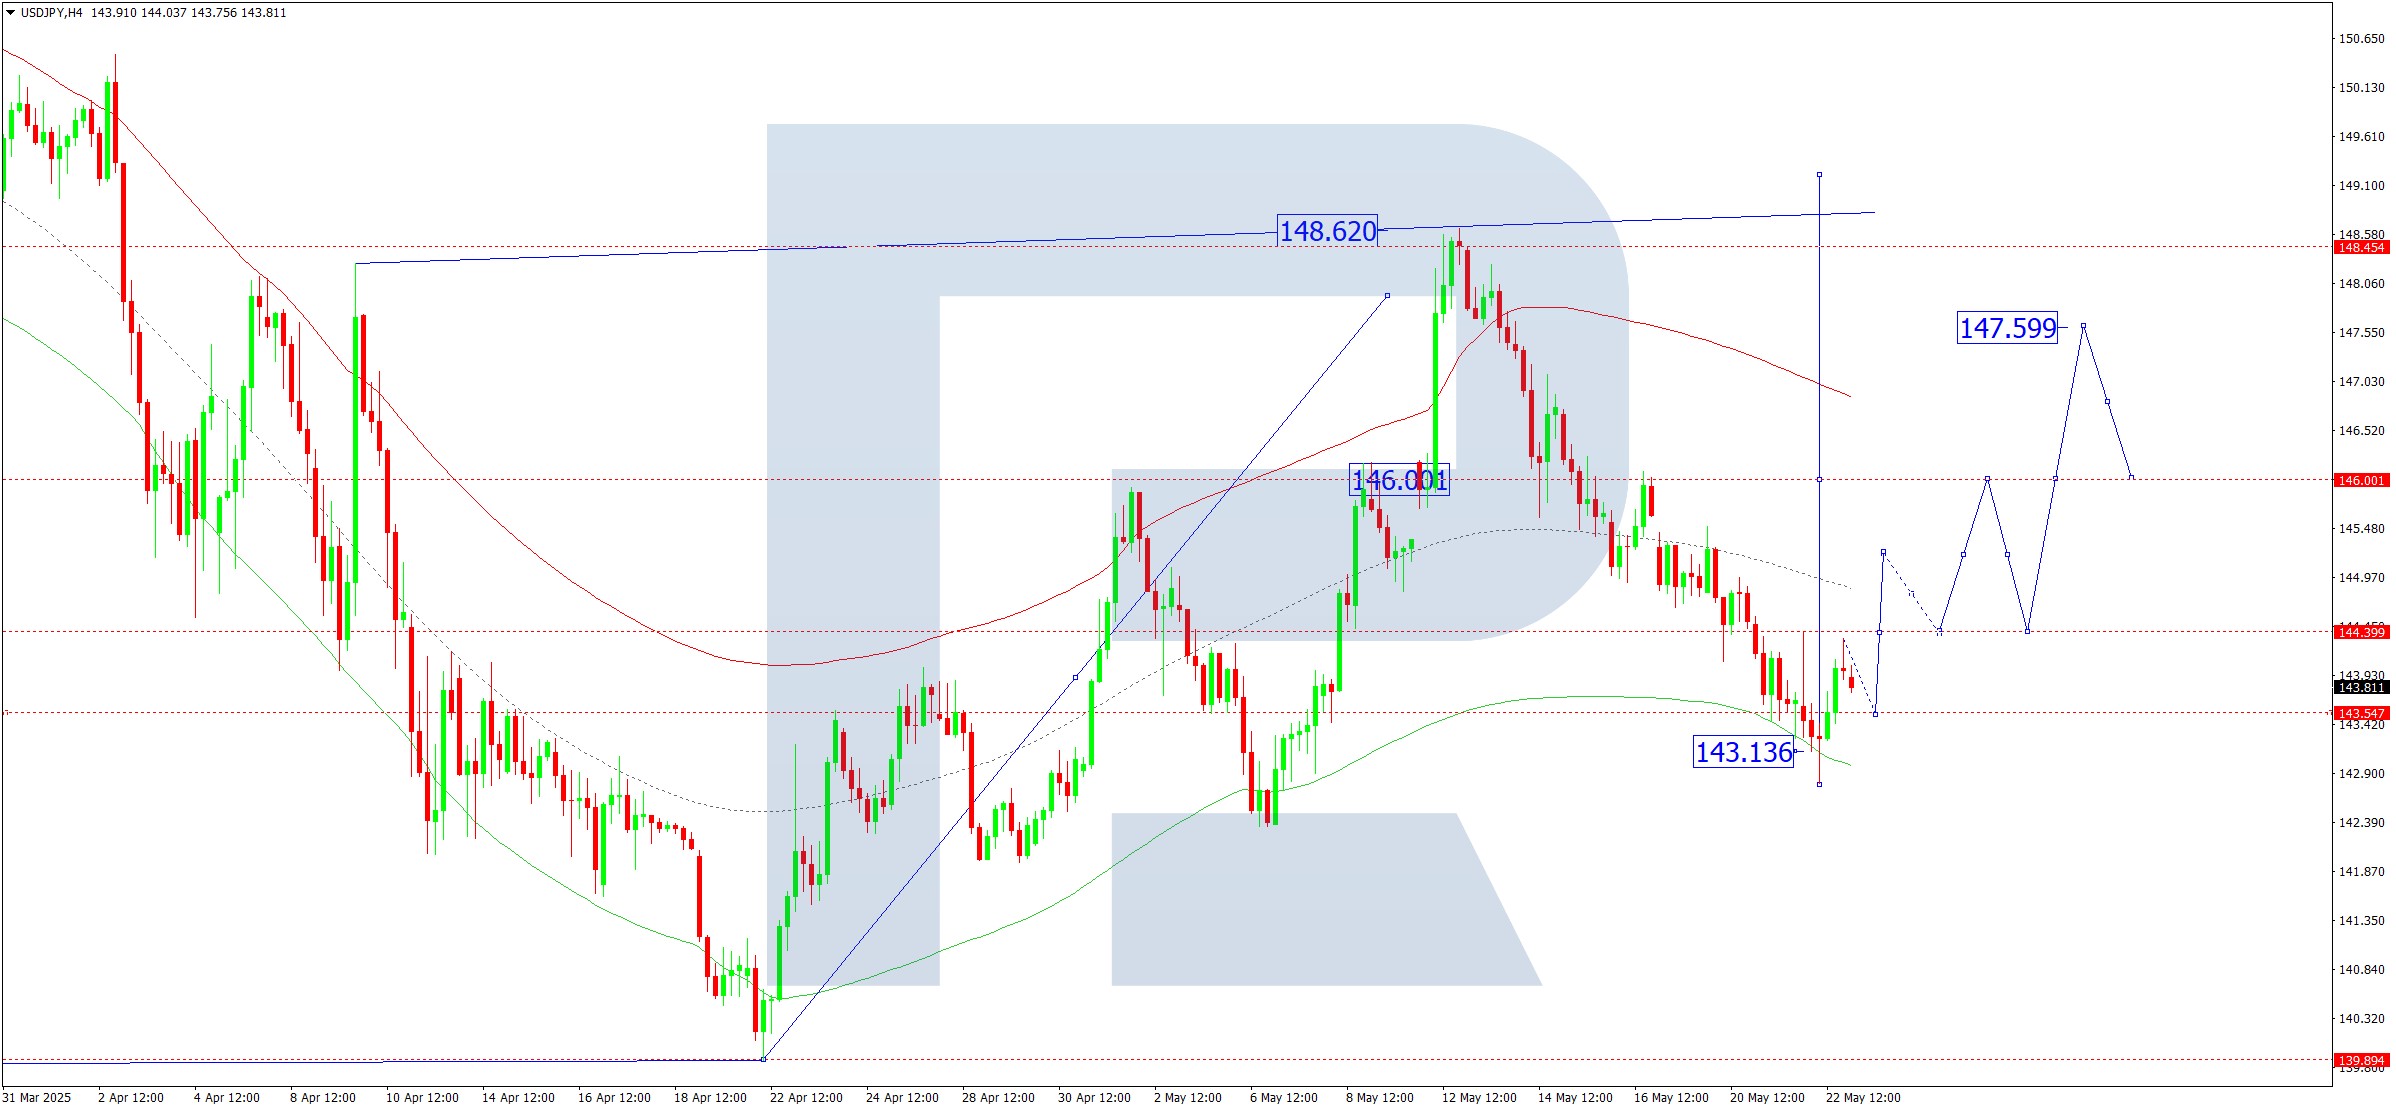
On the H4 chart of USDJPY, the market completed an upward impulse to 144.32. Today, 23 May 2025, the price is expected to correct towards 143.54 (testing from above). Afterwards, a new upward wave to 146.00 may begin, with the trend potentially extending to 147.60, the local target.
This scenario is supported by the Elliott wave structure and the upward wave matrix with a pivot at 143.38, viewed as key in this wave. The market previously completed a correction to the lower boundary of the price Envelope at 142.80 and formed the first growth impulse. Today, a consolidation range could form around the central line at 144.44. A breakout to the upside could trigger a wave to the upper boundary at 148.60.
Technical indicators for today’s USDJPY forecast suggest a rise towards 146.00.
GBPUSD forecast
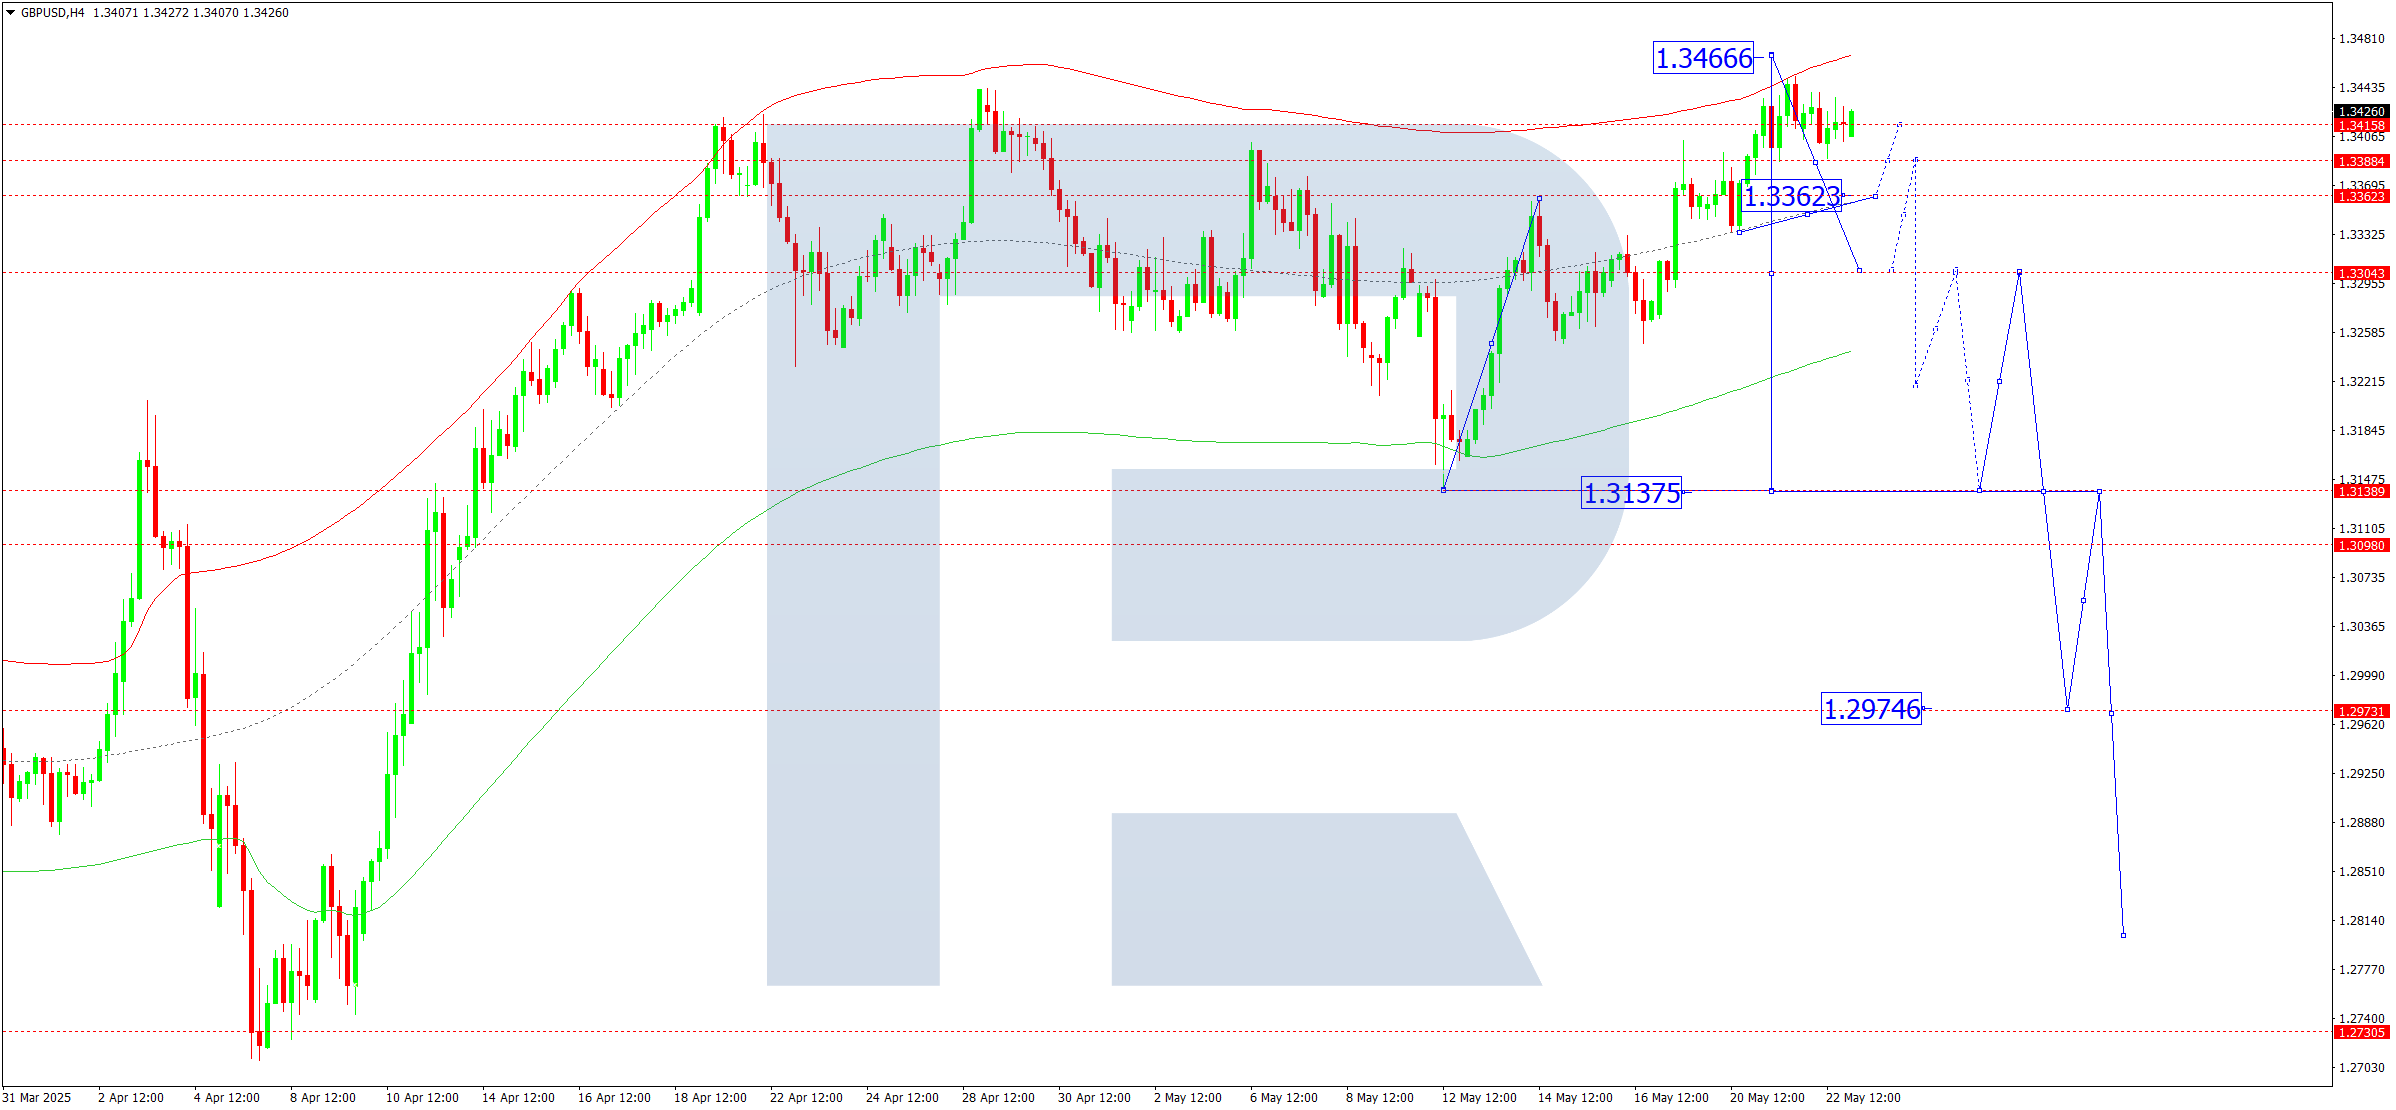
On the H4 chart of GBPUSD, the market continues forming a consolidation range around 1.3414. Today, 23 May 2025, the range may expand down to 1.3363, followed by a correction to 1.3414 (testing from below). Then, a decline towards the local target of 1.3222 is possible.
This scenario is supported by the Elliott wave structure and the downward wave matrix with a pivot at 1.3280, seen as key in the GBPUSD wave structure. The market extended the range to the upper boundary of the price Envelope at 1.3466. Today, a consolidation range could develop around its central line at 1.3363, followed by a downward wave towards the lower boundary at 1.3222.
Technical indicators for today’s GBPUSD forecast suggest a new downward wave to 1.3222.
AUDUSD forecast
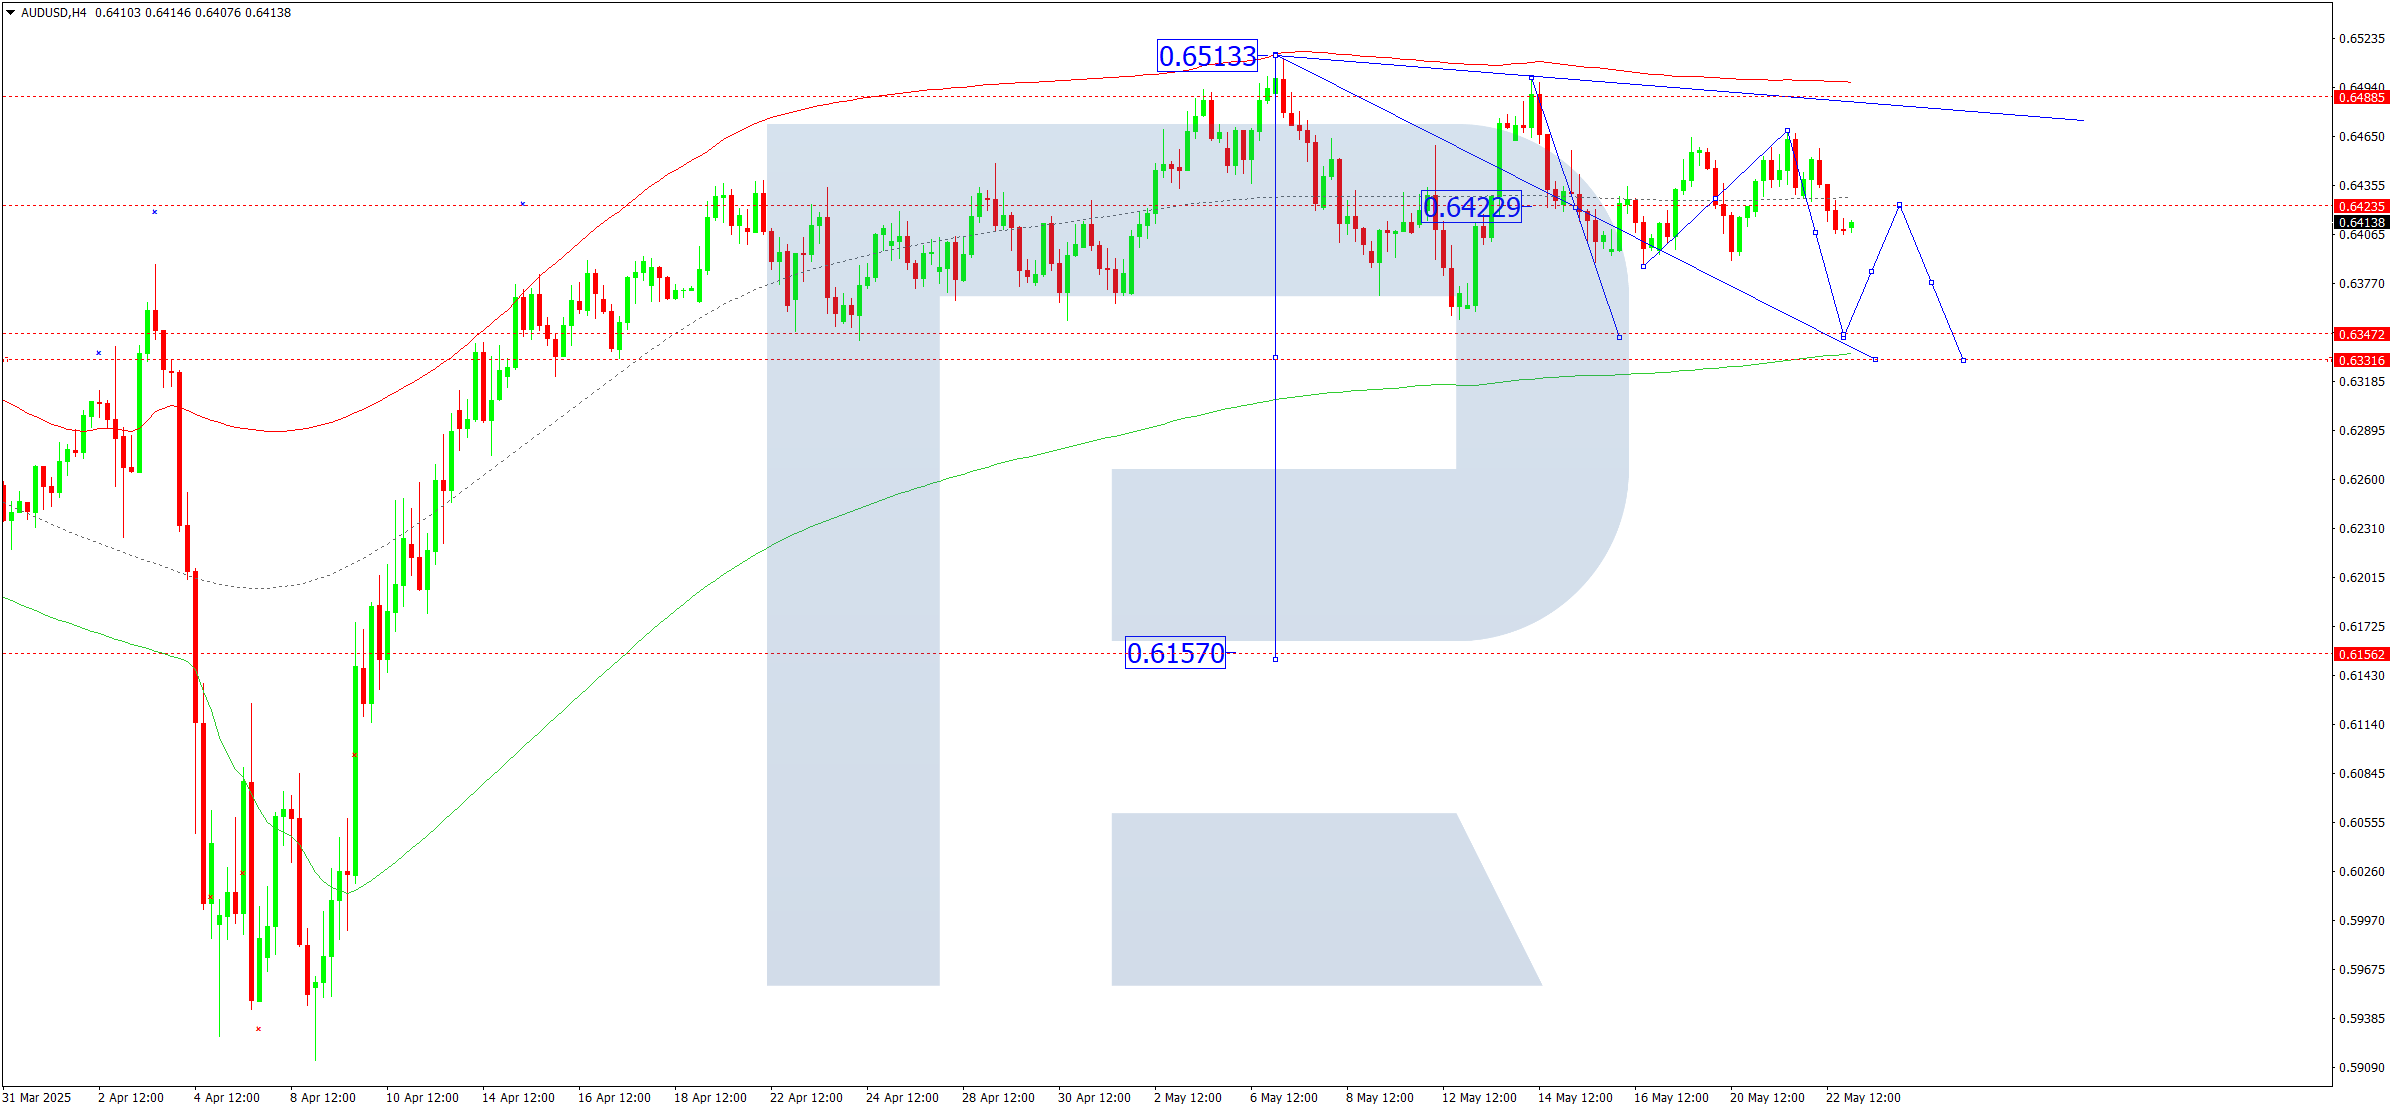
On the H4 chart of AUDUSD, the market continues to move within a wide consolidation range around 0.6422 with no clear trend. Today, 23 May 2025, a decline towards 0.6333 is possible, followed by a correction to 0.6422 (testing from below).
This scenario is supported by the Elliott wave structure and the downward wave matrix with a pivot at 0.6422, regarded as key in AUDUSD’s wave structure. The market is currently consolidating around the central line of the price Envelope at 0.6422. A downward wave to the lower boundary at 0.6333 remains likely.
Technical indicators for today’s AUDUSD forecast suggest a downward wave to 0.6333.
USDCAD forecast
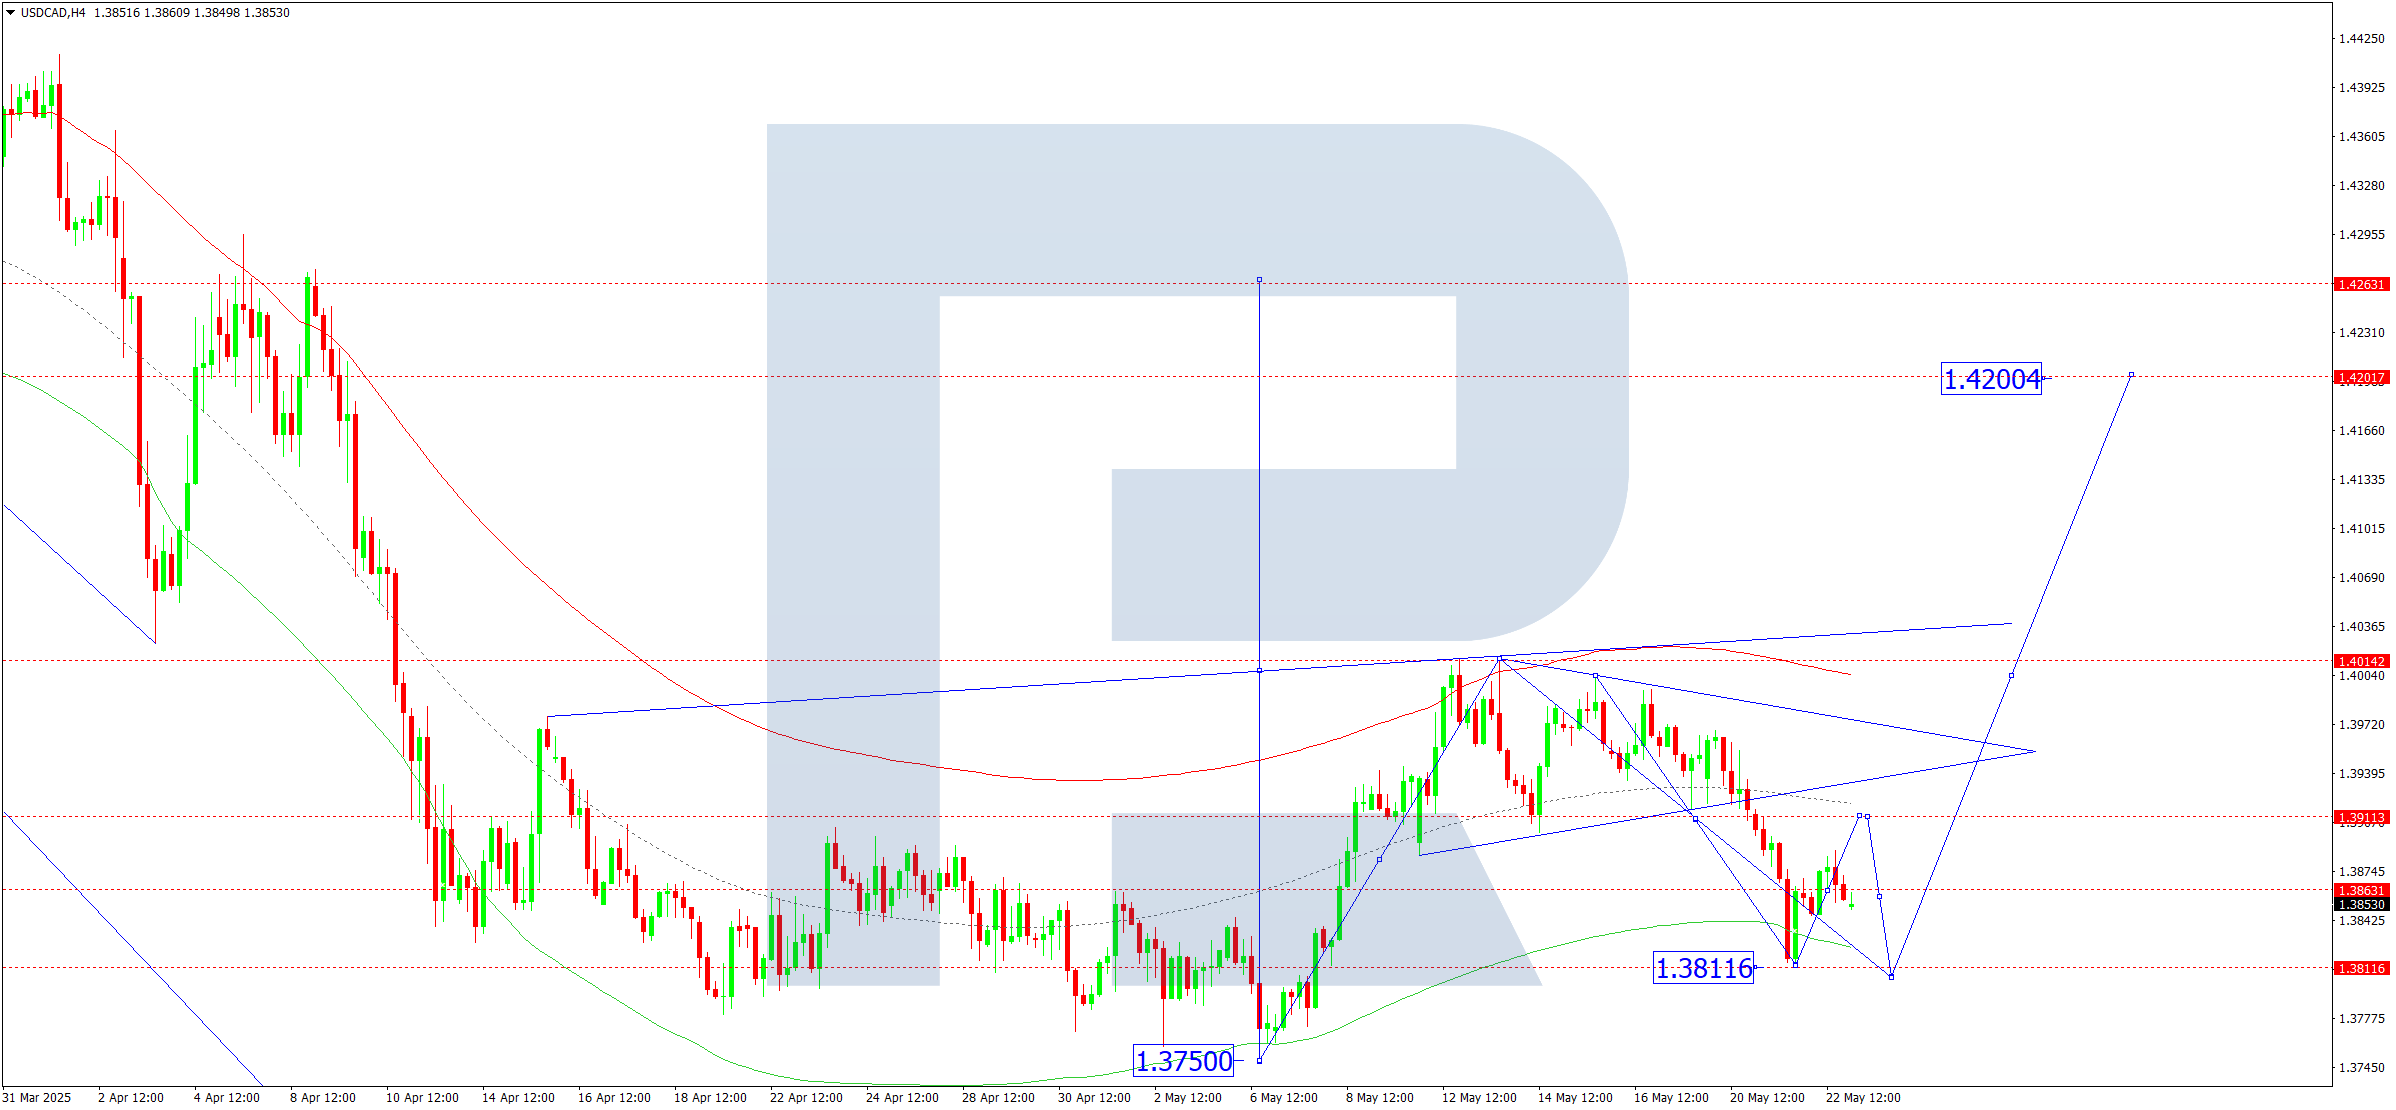
On the H4 chart of USDCAD, the market is forming a narrow consolidation range around 1.3863. Today, 23 May 2025, a breakout to the upside towards 1.3911 is possible. A breakout to the downside could extend the range to 1.3800. Afterwards, an upward wave to 1.4040 may begin.
This scenario is confirmed by the Elliott wave structure and the wave matrix with a pivot at 1.3911, viewed as key for USDCAD in this wave. The market completed a downward wave to the lower boundary of the price Envelope at 1.3812. Today, a wave to the central line at 1.3911 is likely.
Technical indicators for today’s USDCAD forecast suggest a rise to 1.3911.
XAUUSD forecast
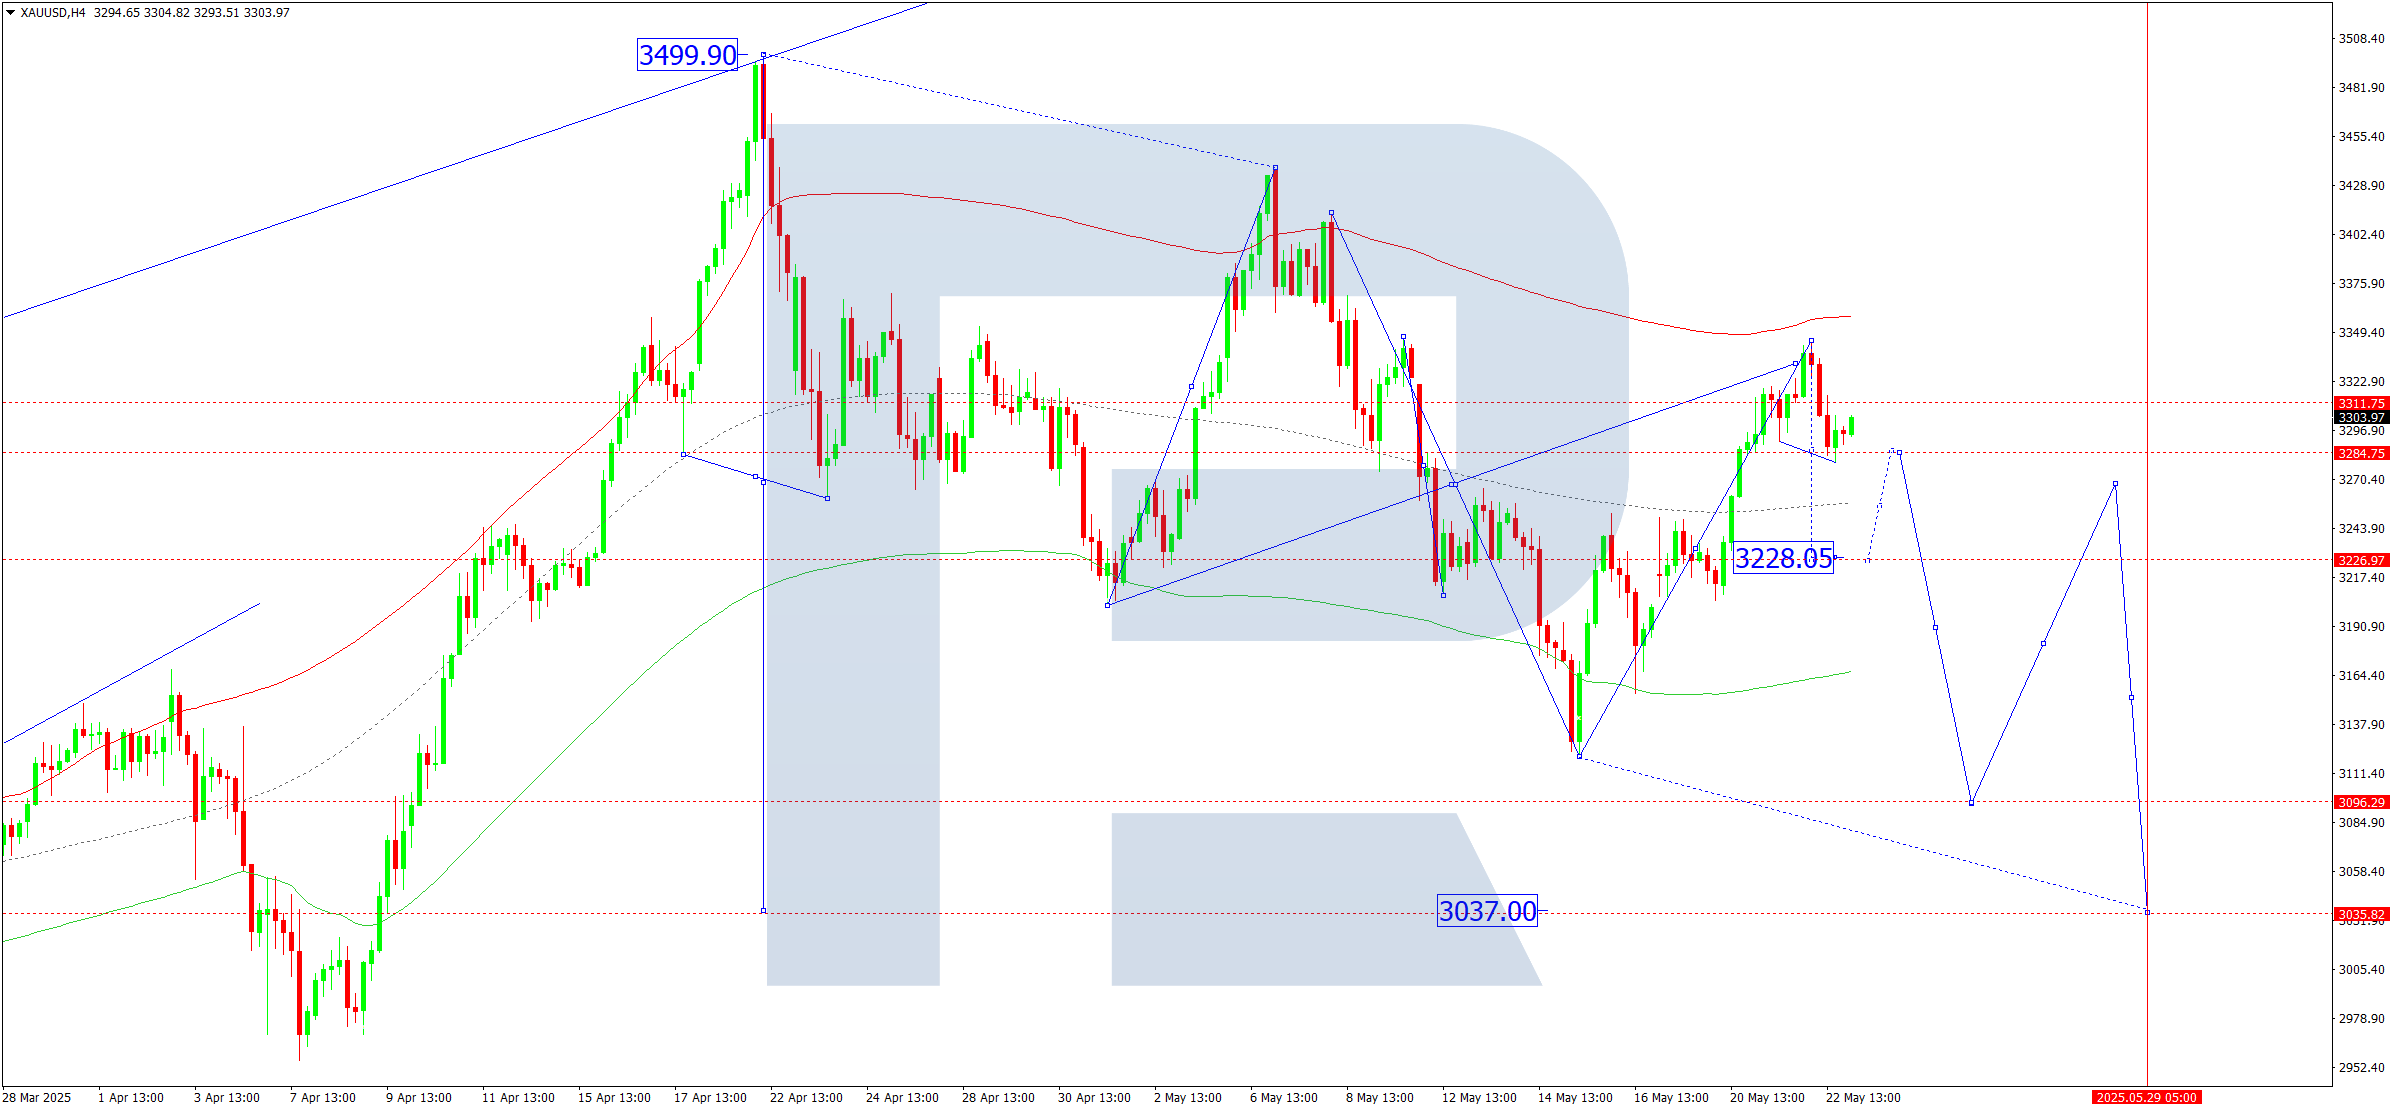
On the H4 chart of XAUUSD, the market completed a downward impulse to 3,280. Today, 23 May 2025, the price is expected to correct towards 3,311 (testing from below) and develop a consolidation range around this level. A breakout downwards may initiate a new decline to 3,100, the local target.
This scenario is supported by the Elliott wave structure and the downward wave matrix with a pivot at 3,267, regarded as key for XAUUSD. The market previously completed a correction to the upper boundary of the price Envelope at 3,345. Today, the market is expected to consolidate around 3,311, with a downward breakout possibly extending the wave to 3,100.
Technical indicators for today’s XAUUSD forecast suggest a continued decline to 3,100.
Brent forecast
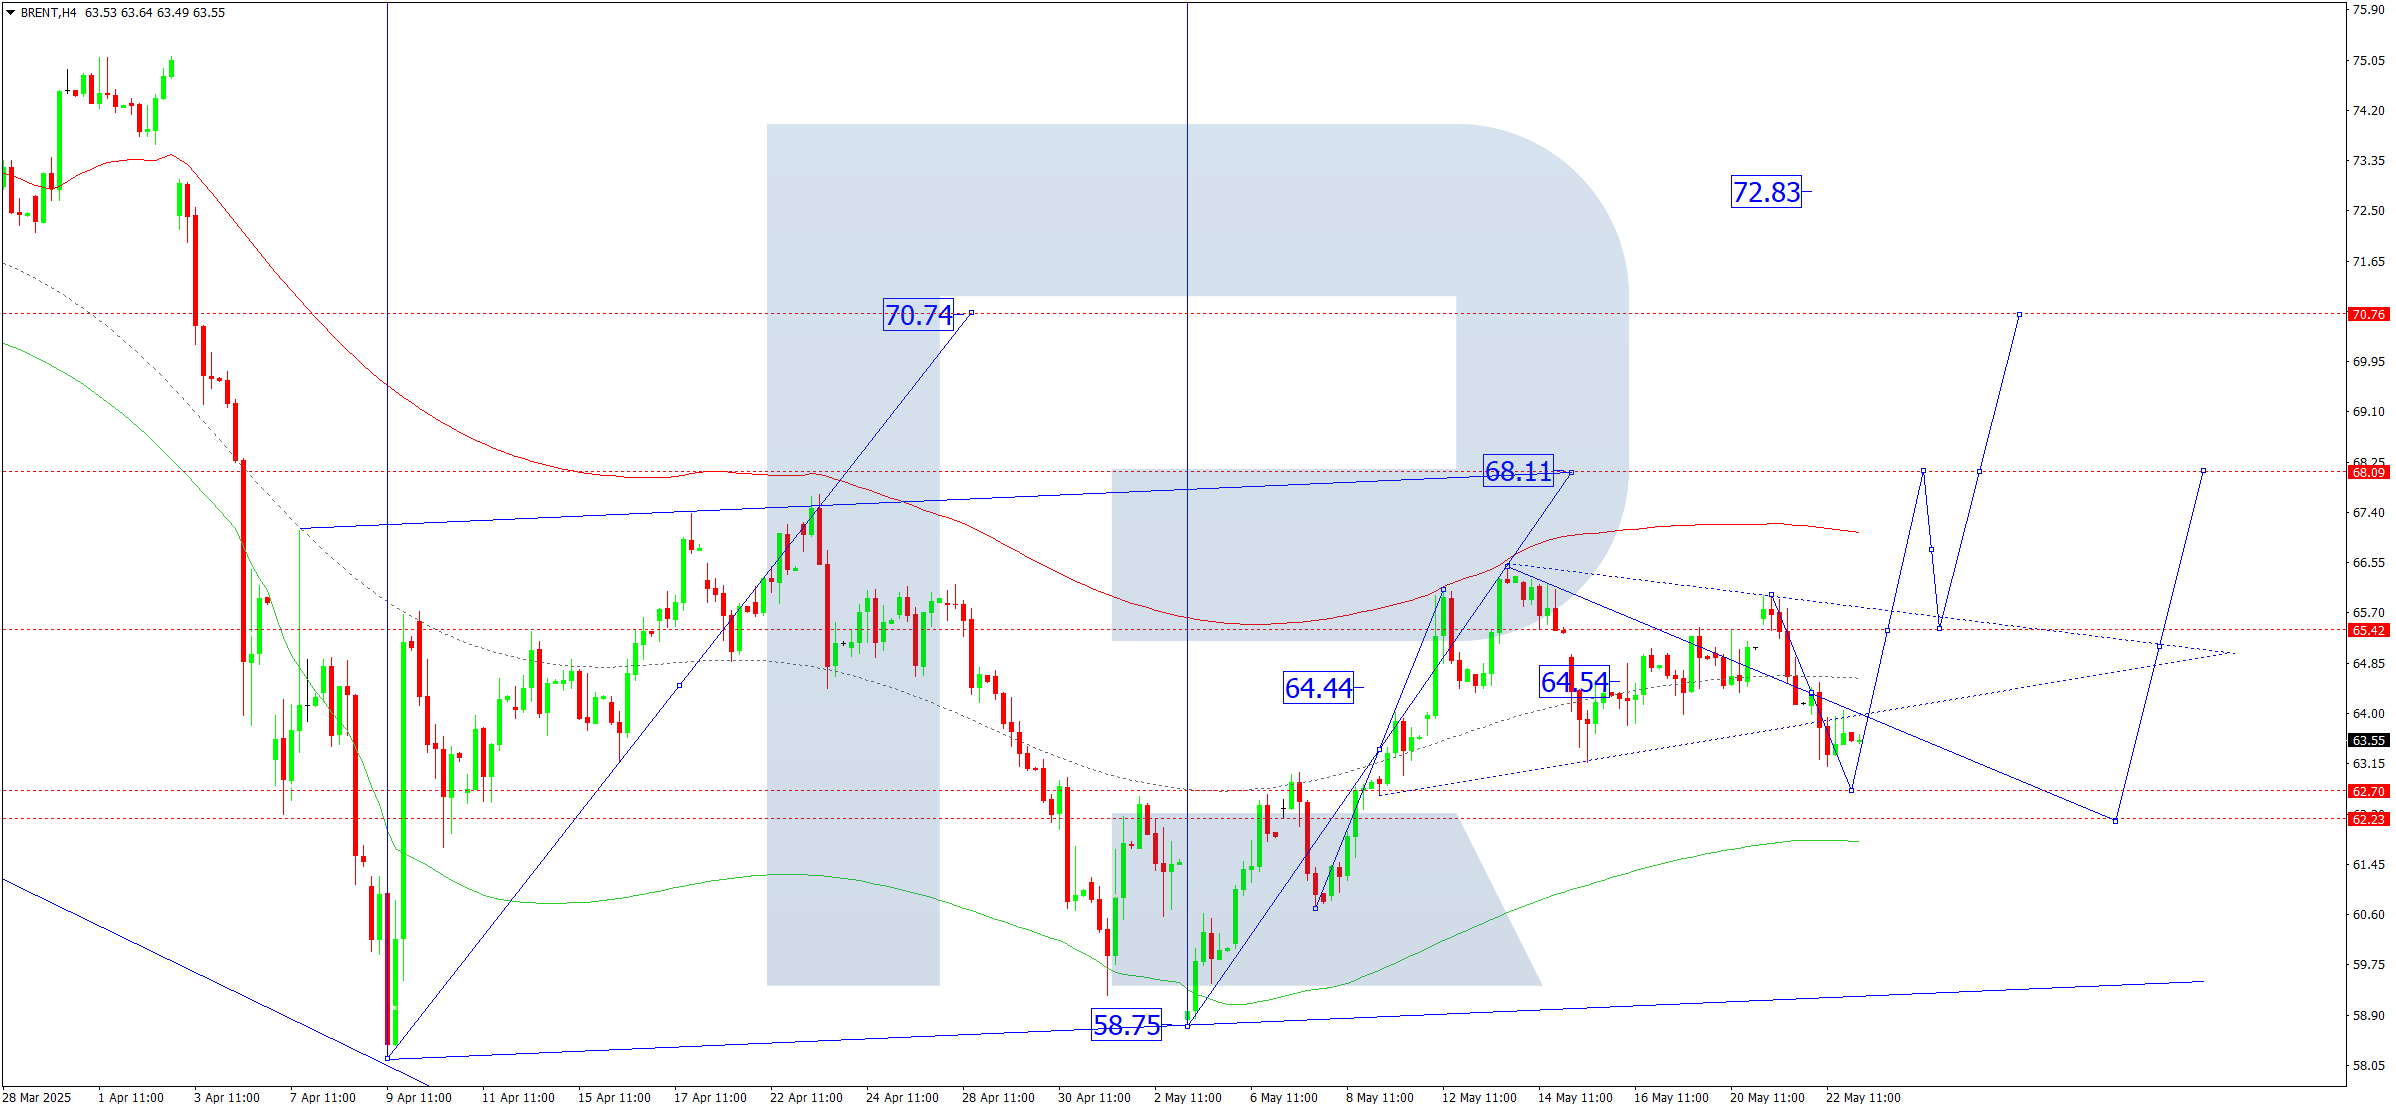
On the H4 chart of Brent crude, the market continues consolidating around 64.54. Today, 23 May 2025, a downward expansion to 62.70 is possible, followed by a further correction to 62.22. Afterwards, an upward wave to 68.11 may develop. This is the initial target.
This scenario is confirmed by the Elliott wave structure and the upward wave matrix with a pivot at 63.33, viewed as key in Brent's structure. The market is currently forming a correction towards the lower boundary of the price Envelope at 62.22.
Technical indicators for today’s Brent forecast suggest a continued correction to 62.22.
Forecasts presented in this section only reflect the author’s private opinion and should not be considered as guidance for trading. RoboForex bears no responsibility for trading results based on trading recommendations described in these analytical reviews.