Weekly technical analysis and forecast (23–27 February 2026)
This weekly technical analysis highlights the key chart patterns and levels for EURUSD, USDJPY, GBPUSD, AUDUSD, USDCAD, gold (XAUUSD), and Brent crude oil to forecast market moves for the upcoming week (23–27 February 2026).
Major technical levels to watch this week
- EURUSD: Support: 1.1715, 1.1645. Resistance: 1.1825, 1.1965
- USDJPY: Support: 153.95, 152.25. Resistance: 155.85, 157.45
- GBPUSD: Support: 1.3435, 1.3325. Resistance: 1.3595, 1.3695
- AUDUSD: Support: 0.6945, 0.6865. Resistance: 0.7125, 0.7275
- USDCAD: Support: 1.3605, 1.3485. Resistance: 1.3725, 1.3835
- Gold: Support: 4,815, 4,565. Resistance: 5,105, 5,285
- Brent: Support: 70.05, 66.85. Resistance: 72.95, 74.95
EURUSD forecast
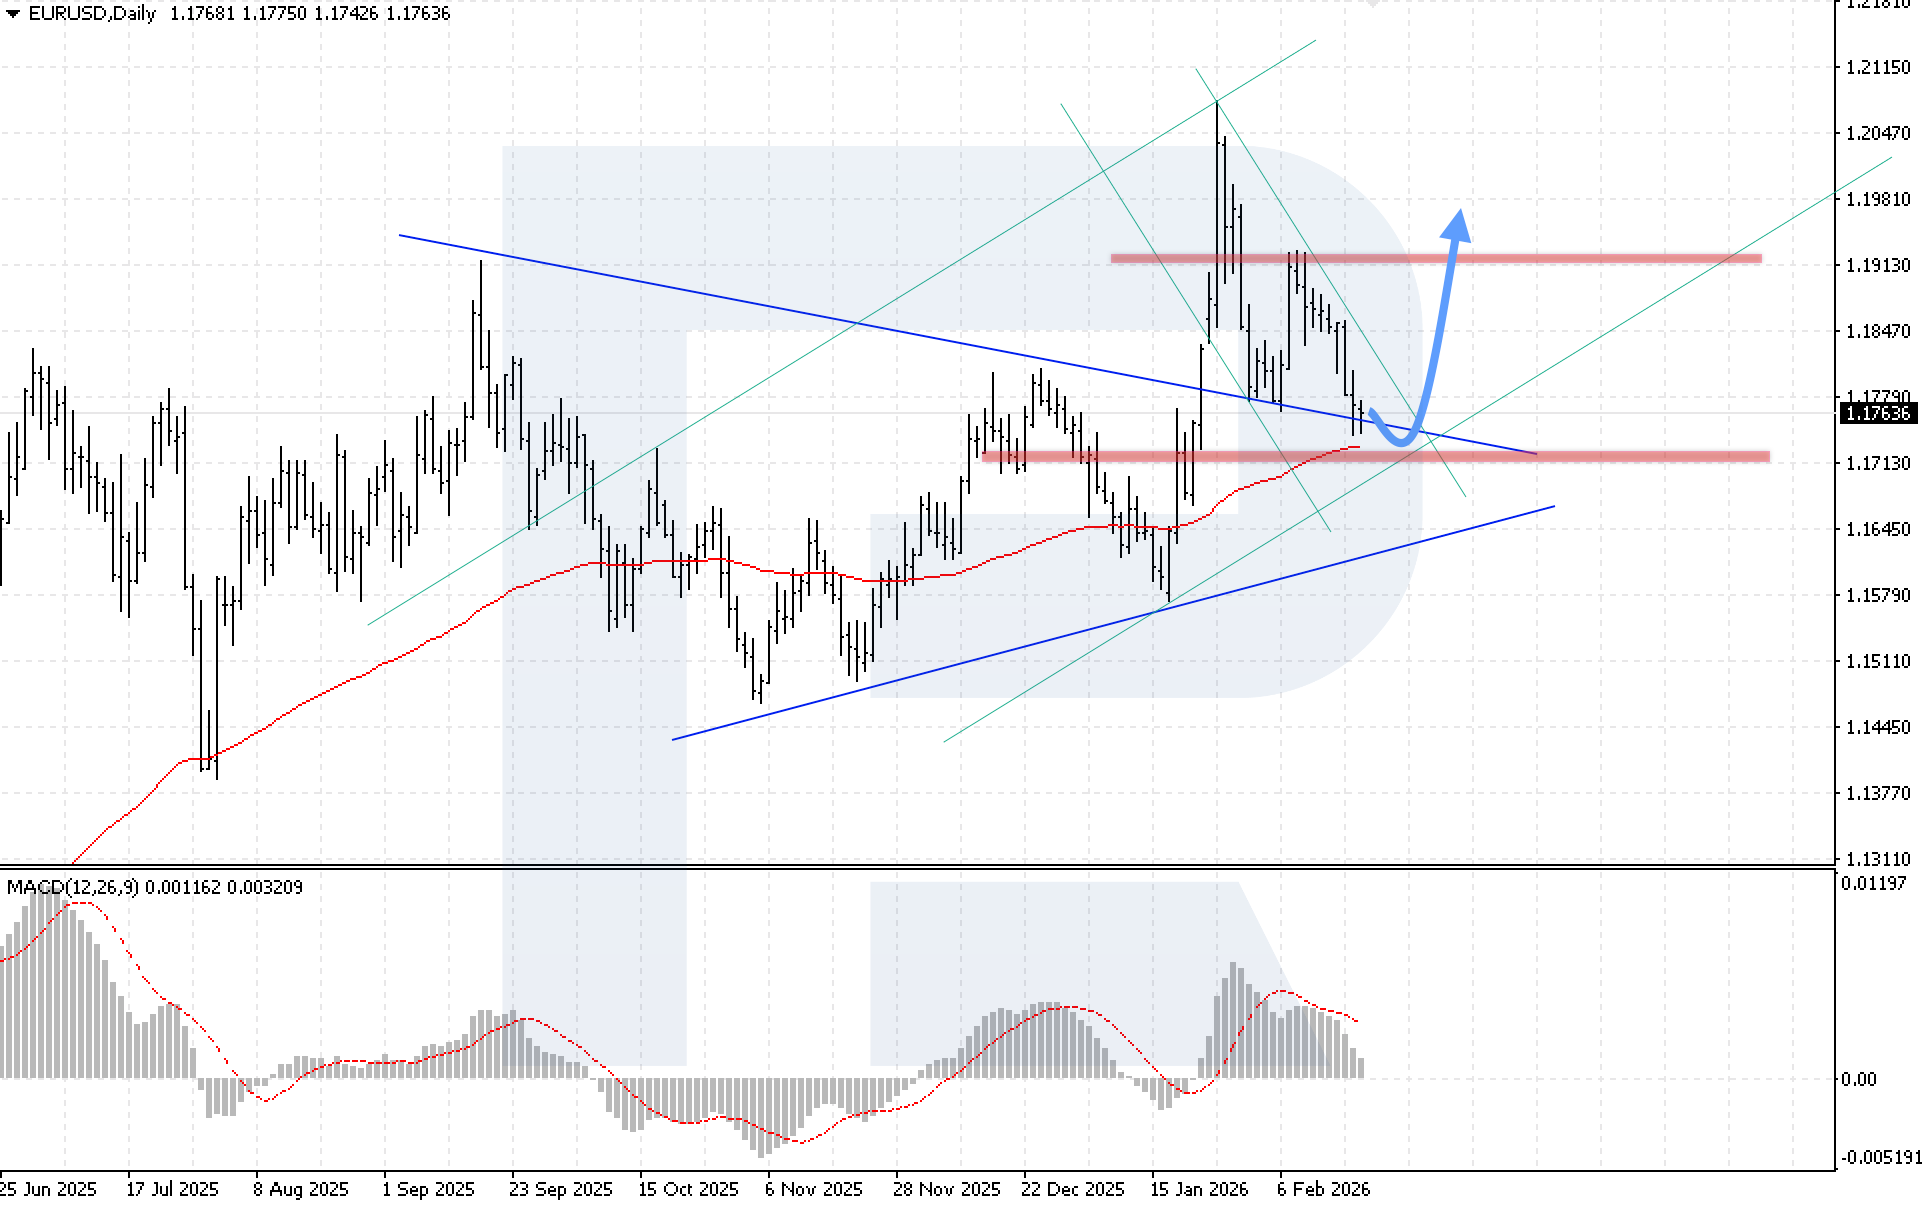
The EURUSD pair ended the week lower, with prices currently testing the upper boundary of the previously broken Triangle pattern. This technical setup suggests an attempt at recovery and a corrective rise at the start of the trading week if the level is confirmed as support.
The US dollar remains resilient thanks to the Fed’s hawkish commentary and strong US macroeconomic data. The latest meeting minutes showed that disagreements persist within the Federal Reserve regarding the future interest rate path. This increased uncertainty about the timing of any potential policy easing and further bolstered the US dollar.
In the eurozone, by contrast, macroeconomic data improved. Private sector business activity accelerated at the fastest pace since November, industrial production posted the strongest increase since August 2025, and the service sector strengthened its expansion momentum.
EURUSD technical analysis
On the daily EURUSD chart, quotes have moved very close to the EMA-85, increasing the importance of the current resistance area. Despite the recent correction, the current price structure retains upside potential towards 1.1985 as the Triangle pattern begins to play out.
MACD points to a consolidation phase. The histogram continues to decline, reflecting slowing momentum and has nearly approached the zero line, suggesting a balance of power between buyers and sellers. A key condition for the bullish scenario this week is consolidation above 1.1825. This would confirm a breakout above the upper boundary of the descending corrective channel and open the door for further recovery.
The alternative scenario will activate if the 1.1695 support level is broken. In this case, selling pressure will intensify, and prices will return to the Triangle pattern, creating prerequisites for a decline towards 1.1545 and a resumption of a full-fledged downtrend.
EURUSD forecast scenarios
Bullish scenario (baseline): renewed bullish momentum is expected if there is a confident rebound from the upper boundary of the Triangle pattern, followed by growth towards 1.1985.
Bearish scenario (alternative): a breakout below the 1.1695 support level would signal a return to the Triangle pattern and indicate a downward correction, with a target near 1.1545.
USDJPY forecast
The USDJPY pair posted a sharp and aggressive rise last week after rebounding from the key support level at 152.25. Pressure on the yen intensified amid expectations of Federal Reserve actions, as well as a slowdown in both headline and core inflation in Japan in January, creating favourable conditions for the dollar to strengthen. Headline inflation fell from 2.1% to 1.5%, the lowest since March 2022, while core inflation remained at the Bank of Japan’s 2% target, showing the slowest growth in two years.
These figures give the Bank of Japan more room to manoeuvre and reduce pressure to accelerate rate hikes. Overall, the fundamental backdrop remains bearish for the yen, which continues to support the USDJPY pair in the short term.
USDJPY technical analysis
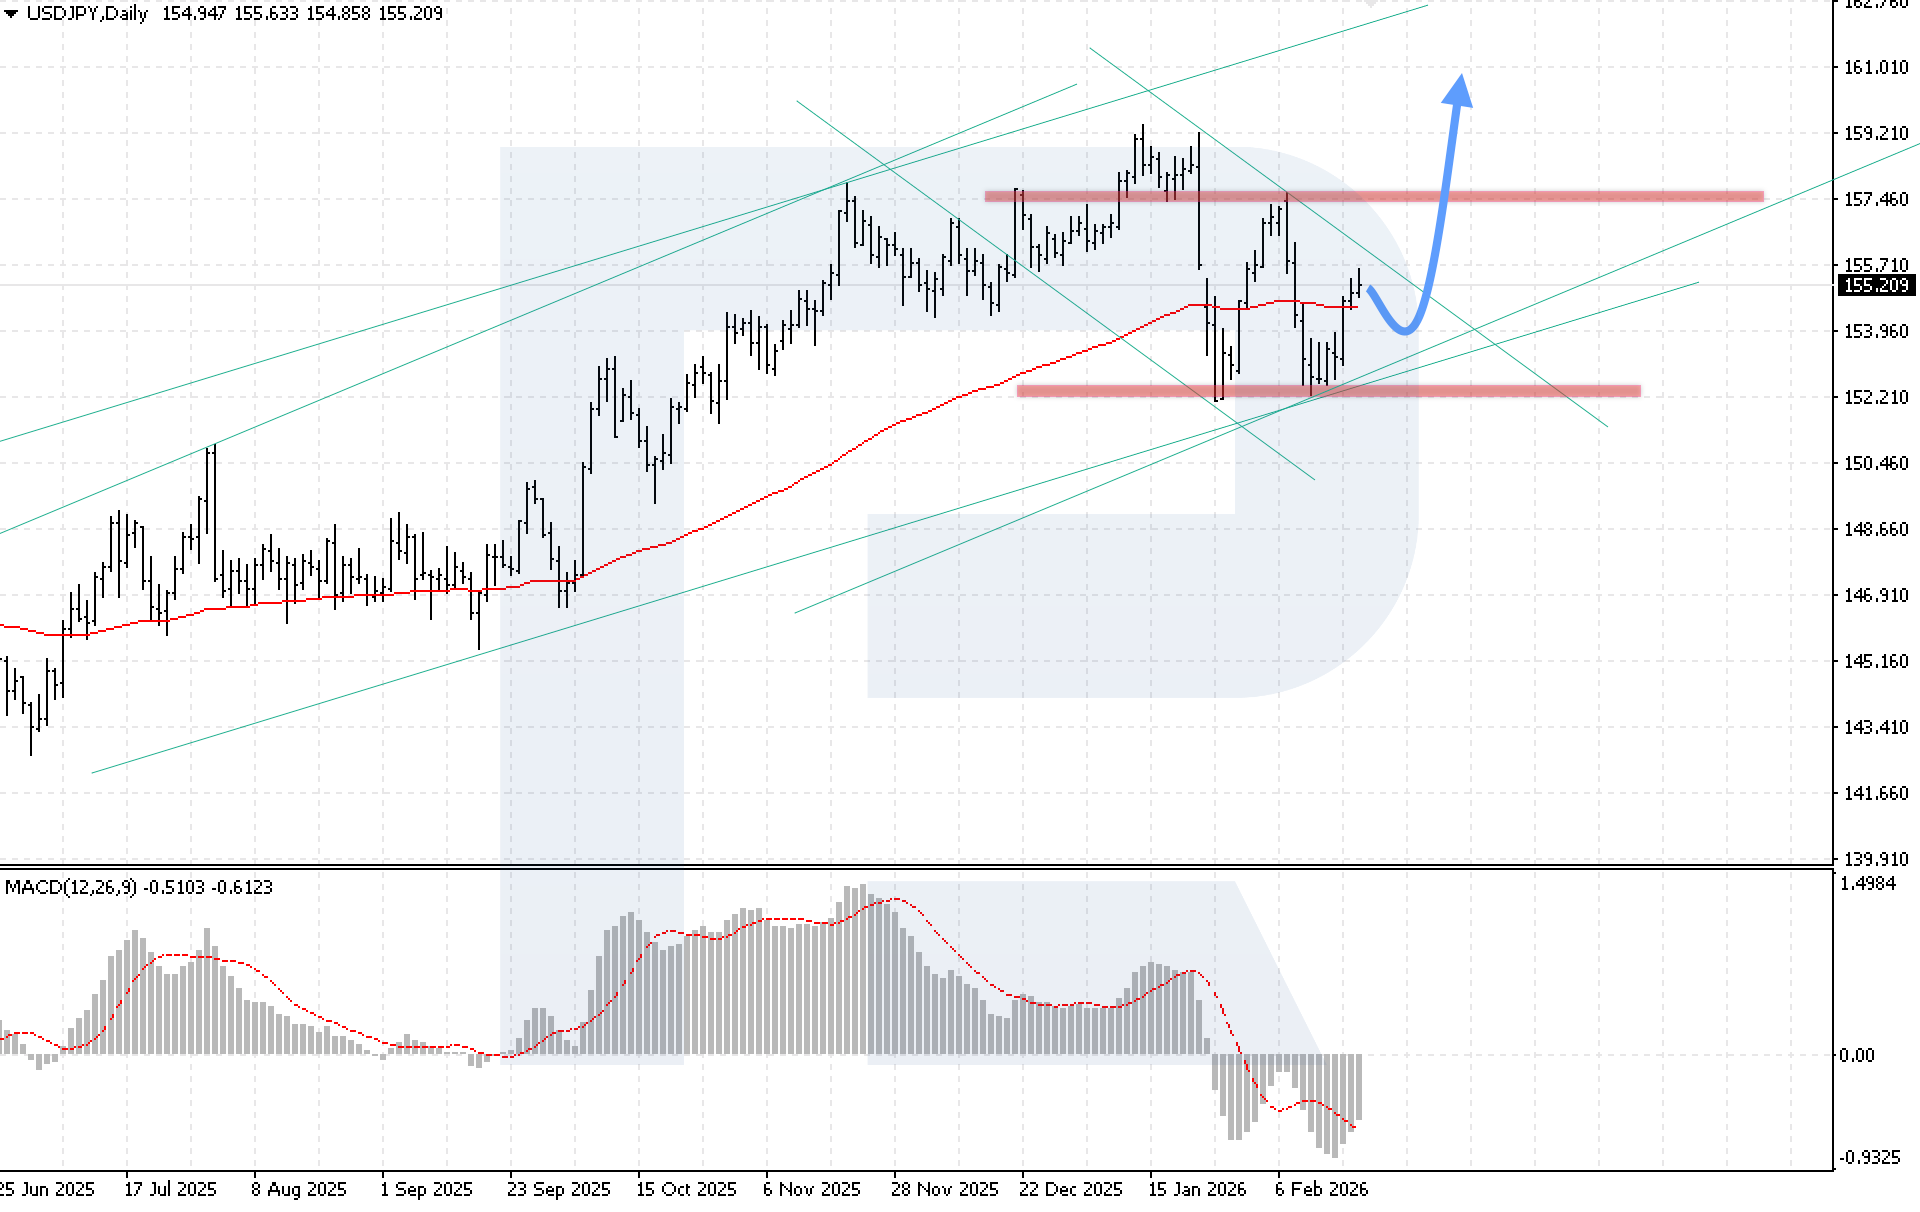
On the daily USDJPY chart, prices continue to rise, increasing the likelihood of completing a Double Bottom reversal pattern. Buyers have already gained a foothold above the EMA-85, strengthening bullish pressure. If the upward move continues, the advance may develop within the Double Bottom pattern, with a potential target near the key resistance level at 161.05 and above.
MACD confirms reversal signs: the histogram is rising actively, and the signal line has moved out of the histogram area, indicating renewed bullish momentum. A key condition to confirm the bullish scenario this week is consolidation above the 156.15 resistance level, which would signal a breakout above the upper boundary of the descending channel.
The alternative scenario will activate if the 151.65 support level is broken. In this case, prices would move below the lower boundary of the bullish channel, creating conditions for a more aggressive decline.
USDJPY forecast scenarios
Bullish scenario (main): a breakout above the upper boundary of the descending corrective channel would open the way for further growth towards 161.05.
Bearish scenario (alternative): if prices fall and break below the lower boundary of the reversal pattern with consolidation below 152.05, the likelihood of a deeper decline increases.
GBPUSD forecast
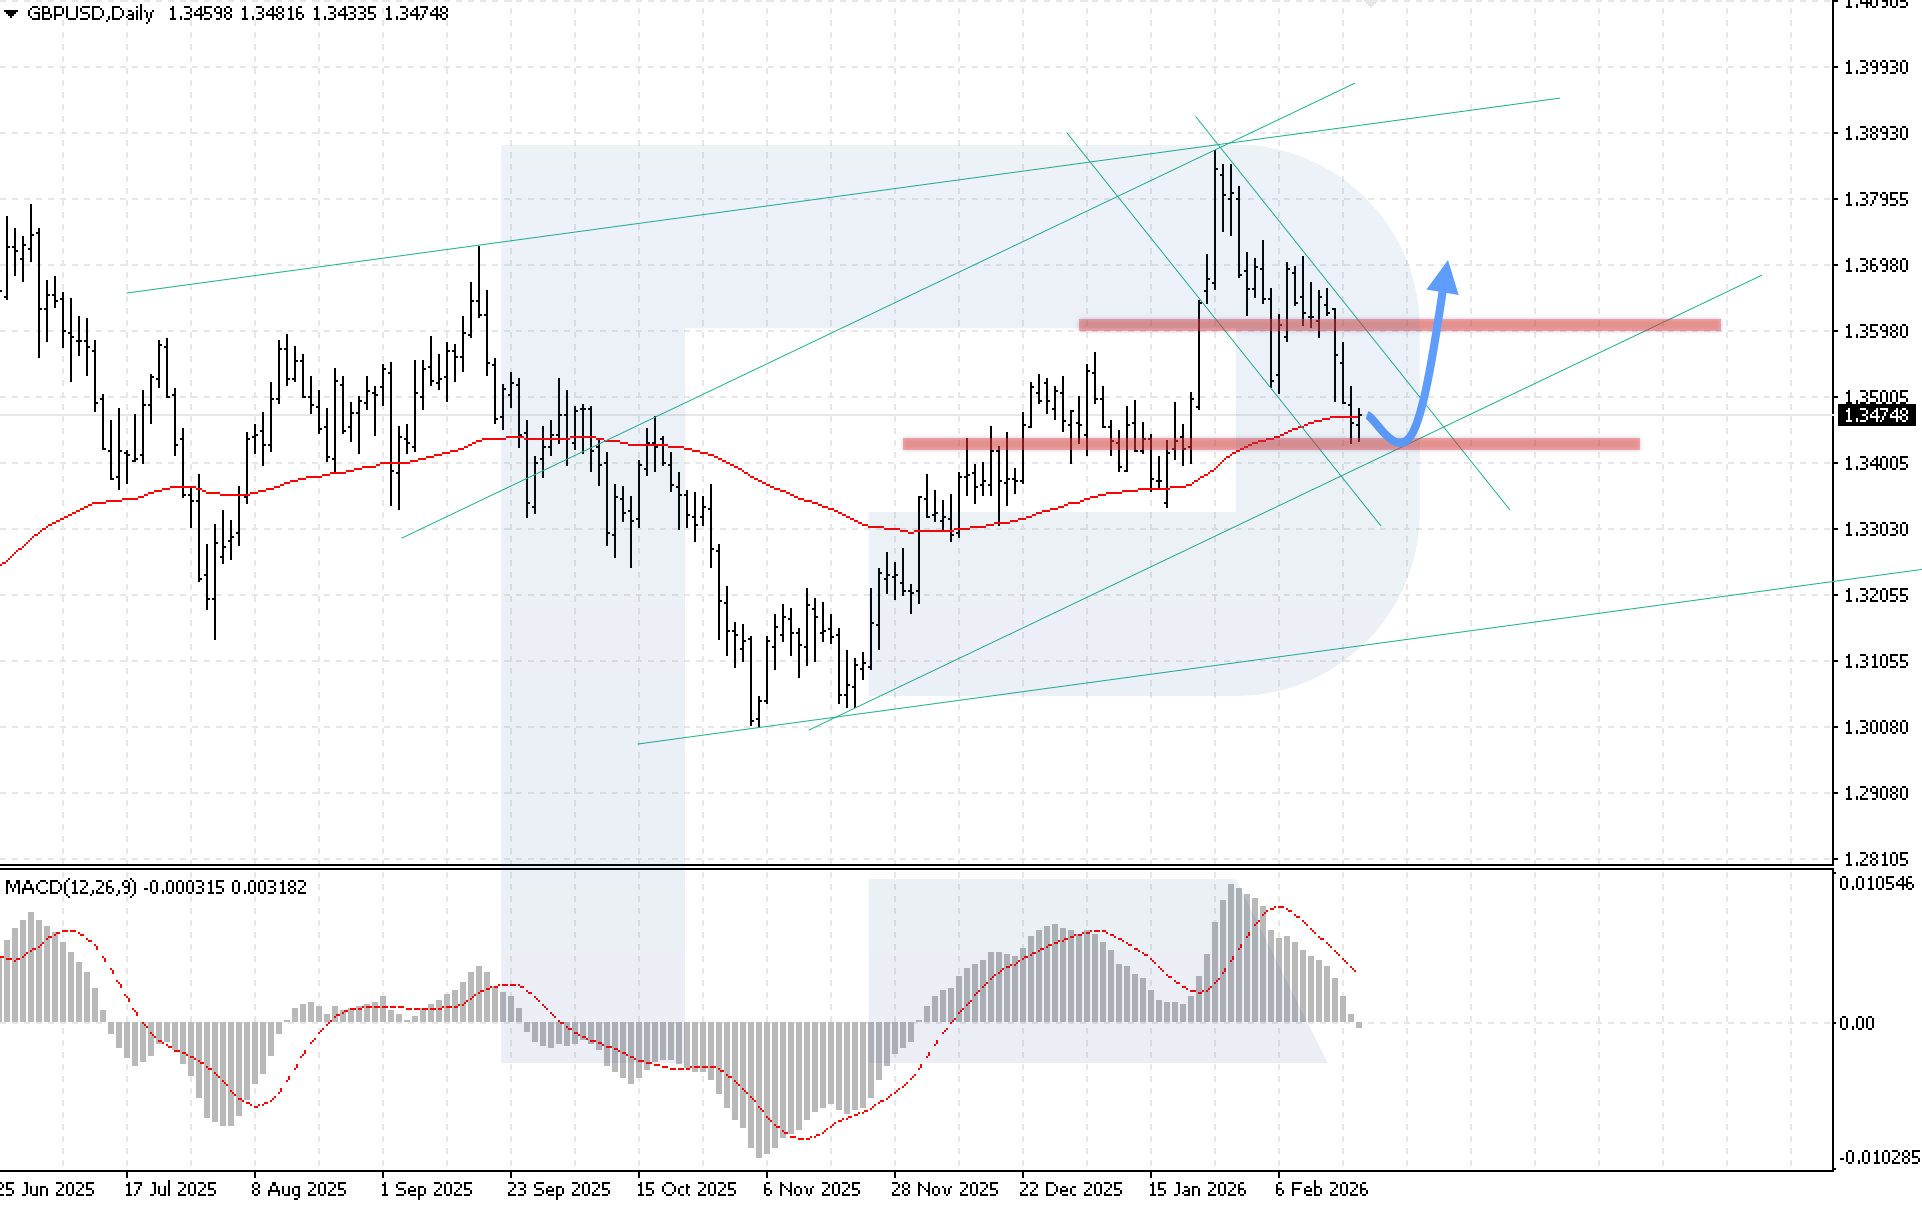
The GBPUSD rate continues to decline, with sellers attempting to consolidate below the EMA-85, but so far unsuccessfully. Despite robust UK economic indicators, the pound remains under pressure due to continued USD strength amid the Fed’s hawkish rhetoric.
The latest report showed that private sector activity in February rose at the fastest pace since April 2024, beating expectations thanks to stable growth in manufacturing and services. Retail sales also came in above forecasts: in January, they increased by 1.8% including fuel and by 2% excluding fuel.
Minutes from the latest Federal Reserve meeting showed ongoing disagreements among policymakers regarding the future rate path, which increases uncertainty about potential rate cuts and continues to bolster the US dollar.
GBPUSD technical analysis
On the daily GBPUSD chart, the market continues to hold near the EMA-85 support line while remaining within the long-term bullish channel. This week, bullish momentum could resume with upside potential towards 1.3695 if buyers maintain support.
MACD indicates a correction phase: the histogram is declining and has crossed the zero line, signalling slowing momentum. A key condition for the bullish scenario is consolidation above the local resistance level at 1.3545. This would confirm a recovery by moving beyond the descending corrective channel and increase the likelihood of a move towards the target level at 1.3925.
The alternative scenario will activate if the lower boundary of the channel is broken and the price consolidates below 1.3355. In this case, the risk of an extended decline towards 1.3225 increases after breaking below the lower boundary of the long-term bullish channel.
GBPUSD forecast scenarios
Bullish scenario (main): if the price rebounds from the lower boundary of the bullish channel and consolidates above the EMA-85, renewed bullish momentum is expected with a target at 1.3695.
Bearish scenario (alternative): continued downside with consolidation below 1.3355 would cancel the recovery scenario and indicate the development of a full-fledged downtrend.
AUDUSD forecast
The AUDUSD pair ended a six-week rally and fell under pressure from a stronger US dollar and weak Australian PMI data. February figures showed slowing activity across all sectors, pointing to slower growth while inflation pressure persists. Manufacturing, service, and composite indices declined from January, but each remained above 50, indicating the economy is still expanding.
The US dollar received additional support from strong macroeconomic data and the Federal Reserve’s hawkish commentary, increasing pressure on the Australian currency.
Amid improving domestic indicators and more hawkish signals from policymakers, the probability of a rate hike in Australia as early as March is increasing. Markets are pricing in an 80% likelihood of a key rate hike by May, while the probability of an earlier hike in March is around 30%.
AUDUSD technical analysis
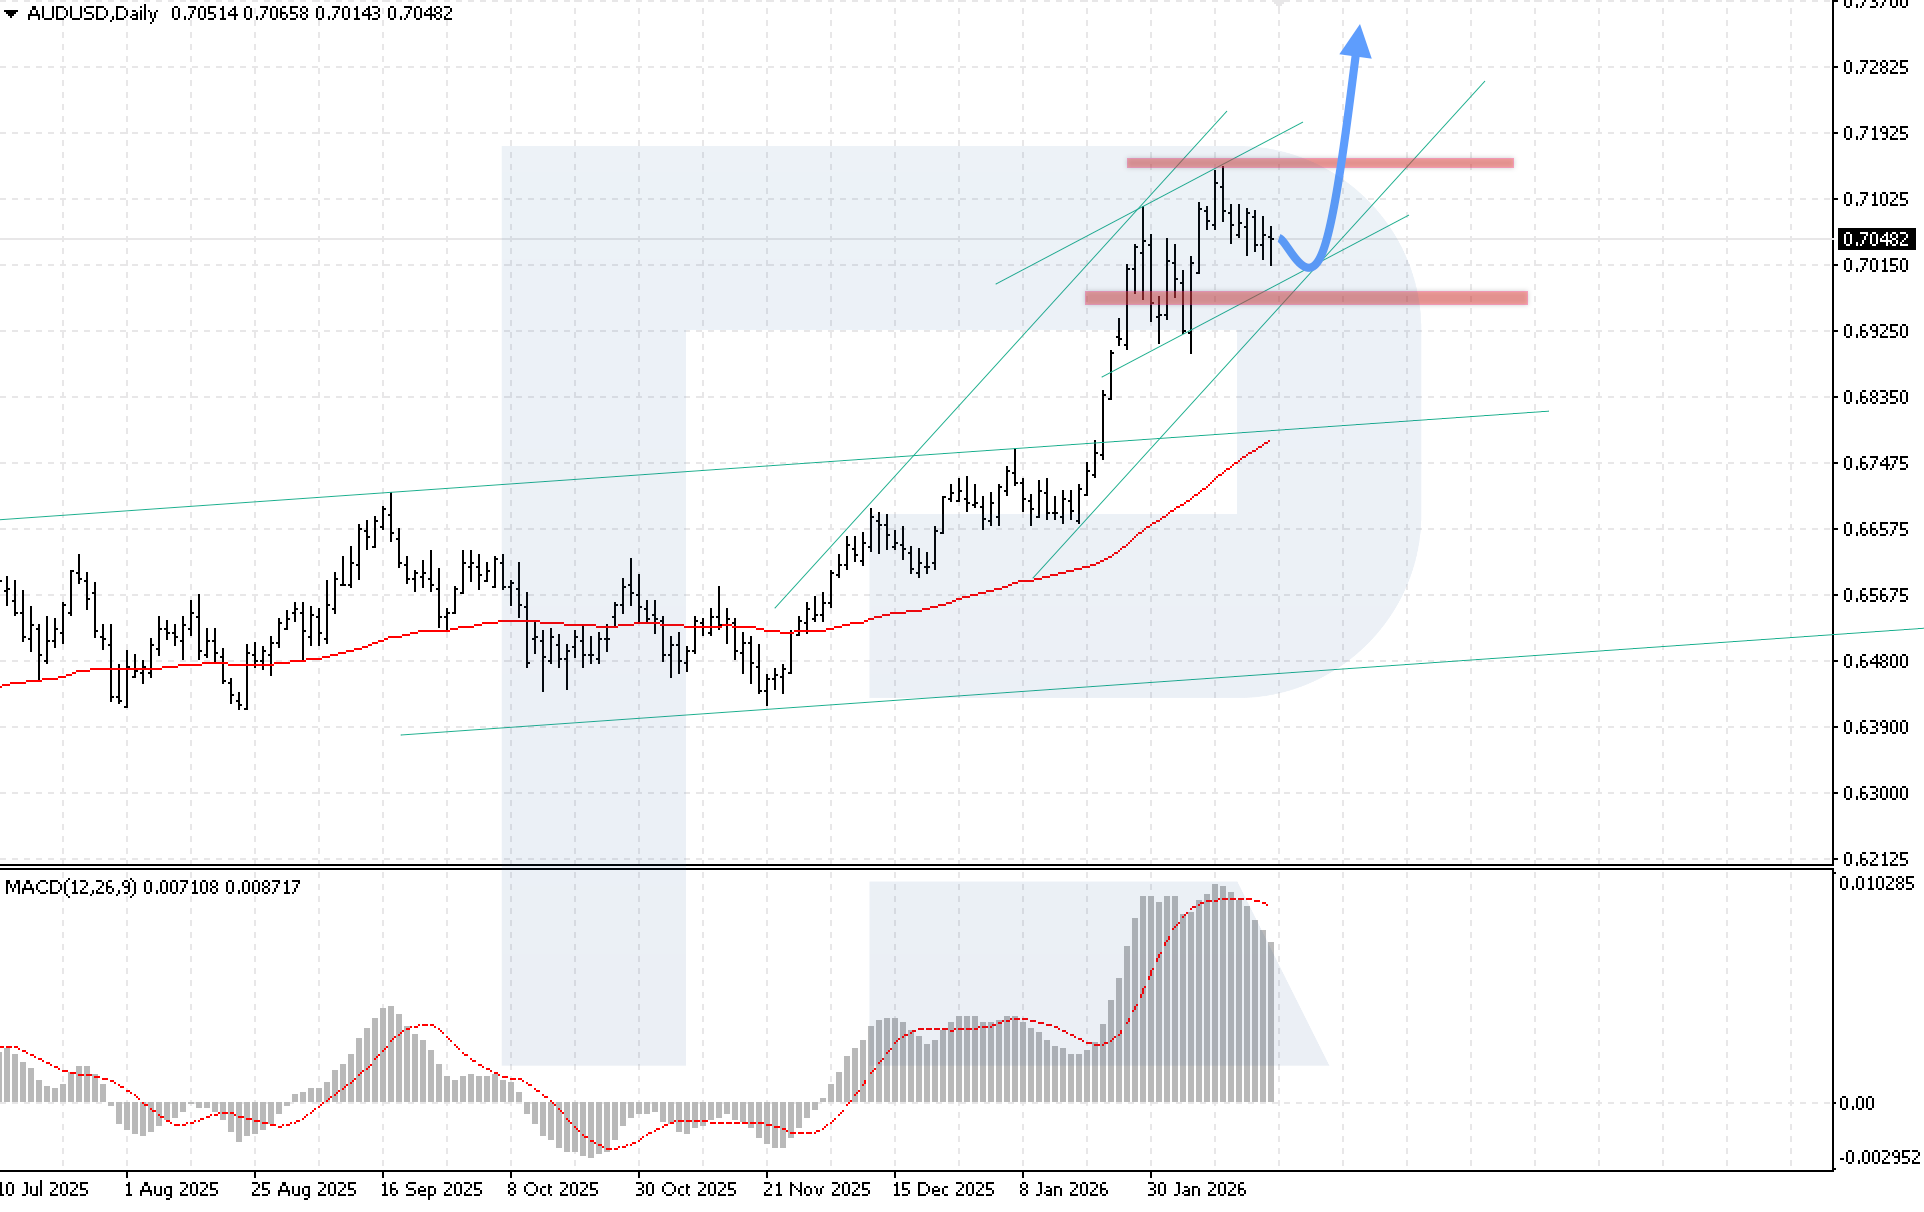
On the daily AUDUSD chart, despite the current correction, prices remain within the bullish channel, with selling pressure preventing the price from breaking below the 0.6965 support level. The price is holding comfortably above the EMA-85, indicating the medium-term bullish momentum remains intact. This week, growth could resume after a rebound from the lower boundary of the bullish channel, followed by a move towards 0.7345.
MACD confirms the correction phase: the histogram is declining after a local peak, reflecting slowing momentum, while the signal line has moved out of the histogram area. During the subsequent rise, buyers will likely have to overcome a bearish divergence. A key condition for the bullish scenario is consolidation above 0.7145. A breakout of this level would confirm the market’s readiness to continue its upward movement.
The alternative scenario will come into play if the 0.6905 support level is broken. Consolidation below the lower boundary of the bullish channel would create conditions for a decline towards 0.6745 as part of a Double Top reversal pattern.
Text 12
Bullish scenario (baseline): a rebound from the lower boundary of the bullish channel at current levels would indicate a continued upward move towards 0.7345, while a breakout above the local resistance level would only strengthen this scenario.
Bearish scenario (alternative): a breakout below the support level with consolidation below 0.6905 would signal a bearish correction in the pair and may indicate a reversal pattern with the prospect of further decline towards deeper target levels.
USDCAD forecast
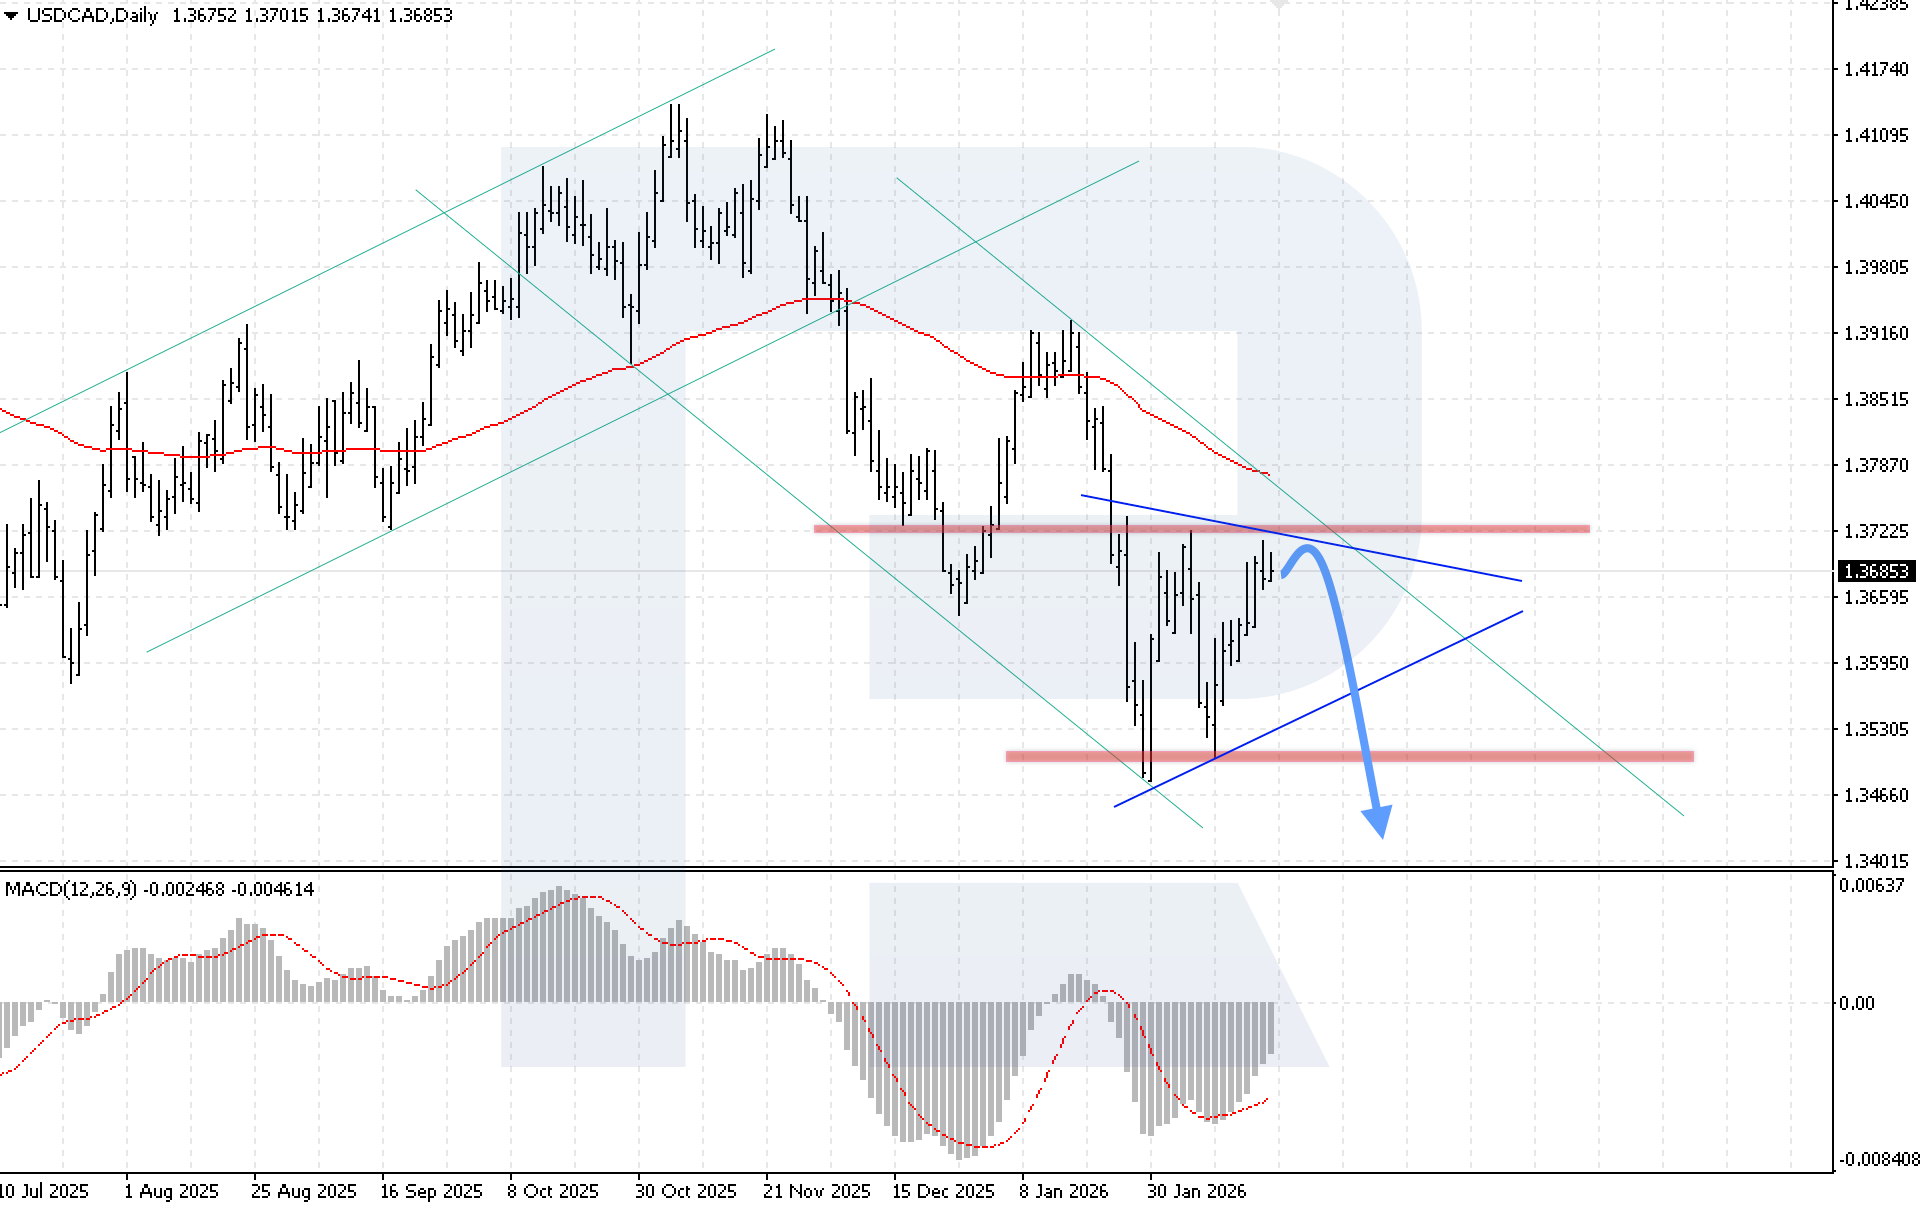
The USDCAD pair ended the week higher, but prices remain within a consolidation channel with an upper boundary at 1.3715 and a lower boundary at 1.3495. The Canadian dollar came under pressure due to slowing domestic inflation: the CPI fell to 2.3% in January, while cooling housing inflation confirms easing price pressure and reduces the likelihood of renewed monetary tightening.
With the policy rate at current levels and Bank of Canada officials stating that policy settings remain appropriate, the market is adjusting expectations for further rate hikes, which reduces the Canadian dollar’s attractiveness relative to other currencies.
USDCAD technical analysis
On the daily USDCAD chart, prices continue to correct within a Triangle pattern. Buying pressure weakened after the price tested the upper boundary of the pattern. The weekly outlook suggests a pullback from the Triangle’s upper boundary, followed by a decline towards 1.3445.
MACD confirms the dominance of buying pressure and points to the likelihood of another test of the Triangle’s upper boundary before the decline resumes. The histogram continues to rise, supporting expectations of a temporary strengthening of the US dollar. A key condition for the downside scenario is consolidation below 1.3505. Such a breakout would confirm a move below the pattern’s lower boundary and strengthen the signal for continued decline towards lower targets.
The alternative scenario will activate if the 1.3715 resistance level is broken. This would signal a breakout above the Triangle’s upper boundary and point to a bullish scenario with upside potential towards higher targets.
USDCAD forecast scenarios
Bearish scenario (main): if the price rebounds from the upper boundary of the Triangle pattern, the pair is expected to resume its downward movement, with a target at 1.3445.
Bullish scenario (alternative): if the price rises decisively, breaks above the upper boundary of the Triangle pattern, and consolidates above 1.3715, the market will receive a signal to continue its upward momentum.
XAUUSD forecast
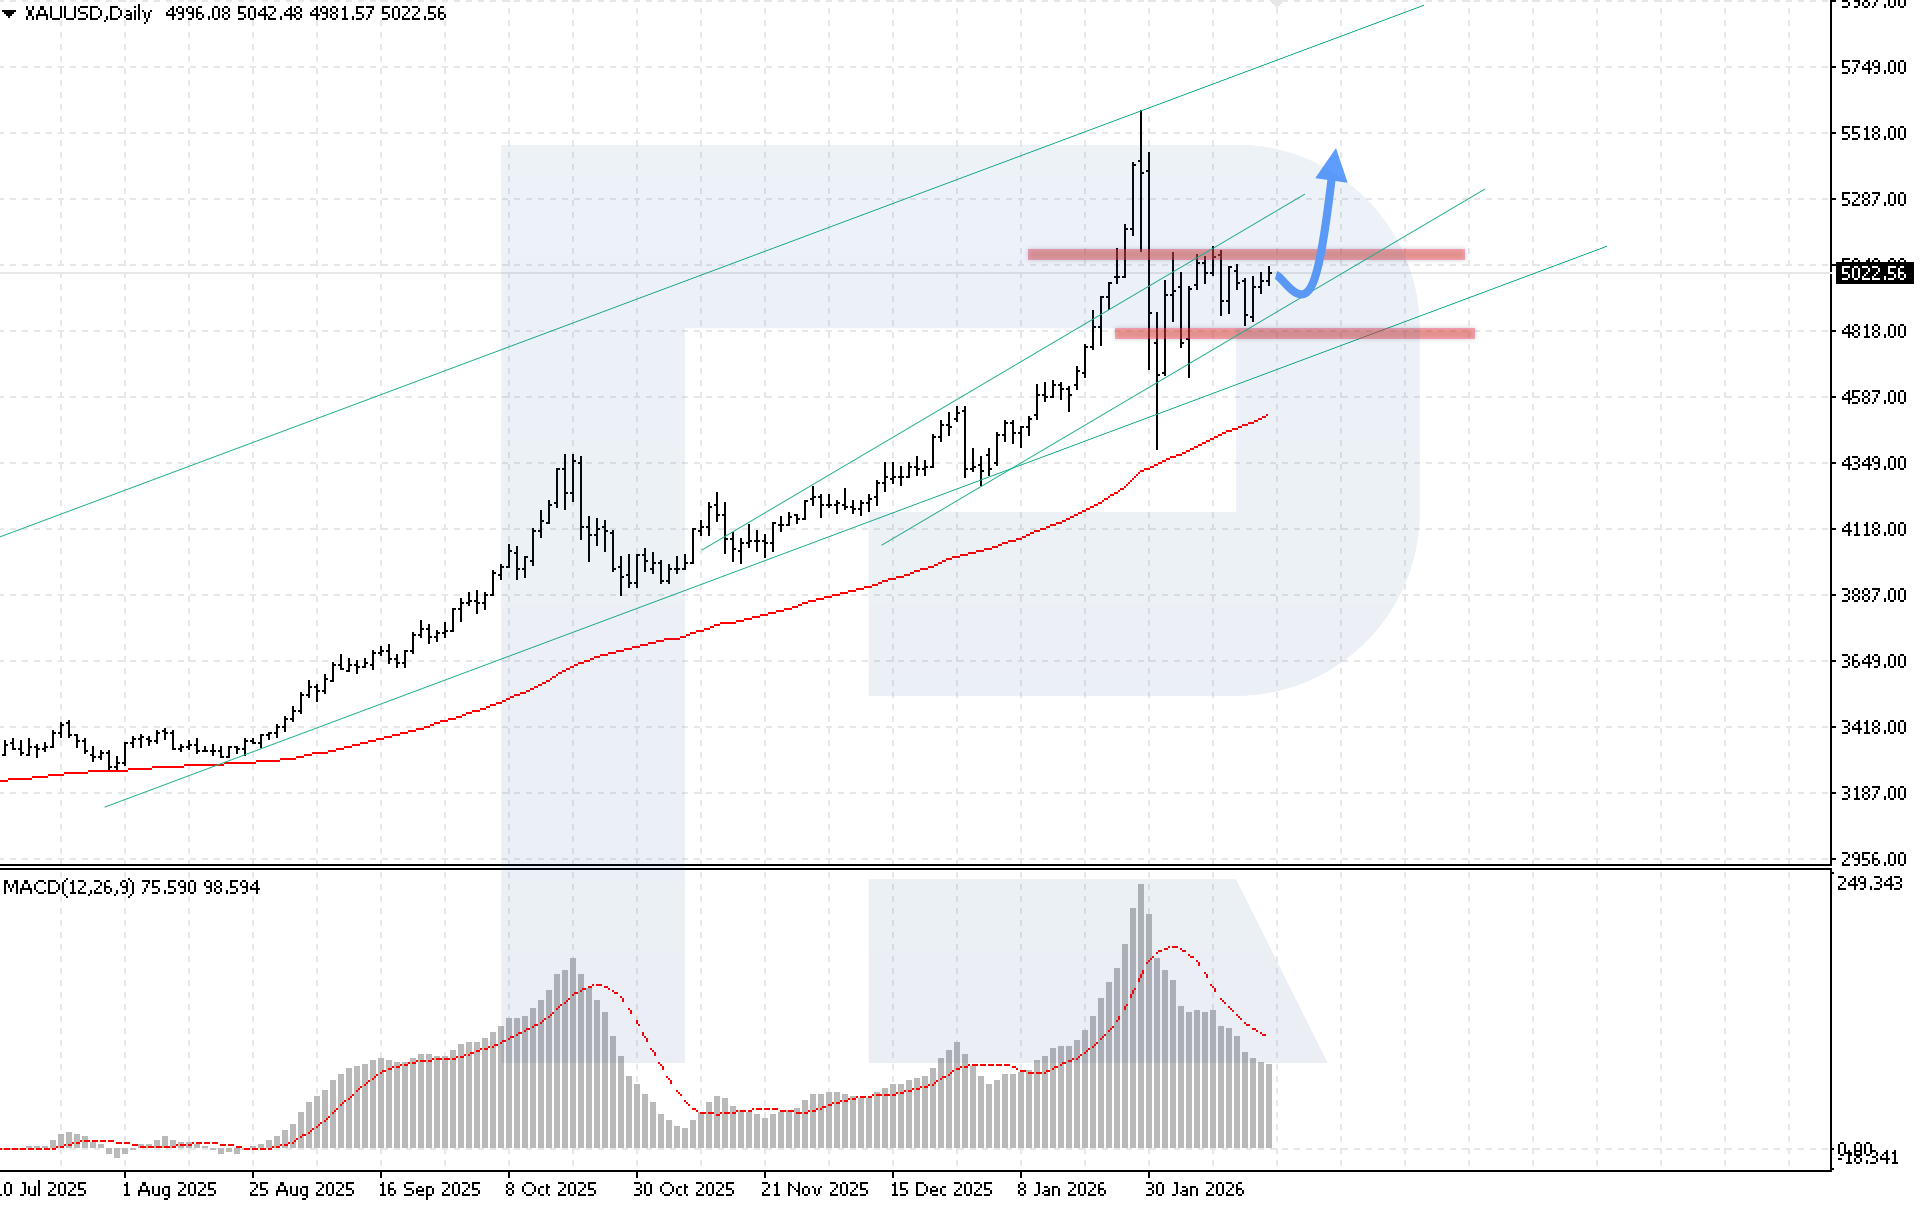
While XAUUSD has been rising for the third consecutive week, buyers have yet to break the strong resistance level at 5,105. The situation remains uncertain amid a mix of geopolitical risks and the outlook for the Federal Reserve’s monetary policy.
The minutes of the January FOMC meeting showed a split among policymakers: some participants pointed to the possibility of further rate hikes if inflation remains high, limiting demand for gold. Fed Governor Stephen Miran also lowered expectations for rate cuts this year, citing stronger-than-expected economic performance.
Despite the current uncertainty, the bullish trend remains in place, and gold still has good chances to continue moving higher.
XAUUSD technical analysis
On the daily XAUUSD chart, prices continue to correct, but buying pressure is gradually increasing, and buyers still have a chance to test the key 5,105 USD resistance level. Renewed growth remains likely at the start of the week, with a potential target at 5,575 USD.
MACD confirms the correction phase: the histogram continues to decline, reflecting slowing momentum and pointing to continued consolidation. A key condition for the bullish scenario is consolidation above the nearest resistance level at 5,105 USD. A breakout above this level would open the door for a full-fledged bullish momentum.
The alternative scenario will activate if the price breaks below the lower boundary of the bullish channel and consolidates below 4,805 USD. Such a signal would indicate a move outside the long-term channel and a test of the EMA-85, while the decline could lead to a deeper correction.
XAUUSD forecast scenarios
Bullish scenario (main): there is still the potential for prices to resume growth after rebounding from the lower boundary of the bullish channel, with a target at 5,575 USD; however, a breakout above the key resistance level is required to confirm this scenario.
Bearish scenario (alternative): if prices drop sharply and consolidate below 4,805 USD, this would open the way for a deeper correction.
Brent forecast
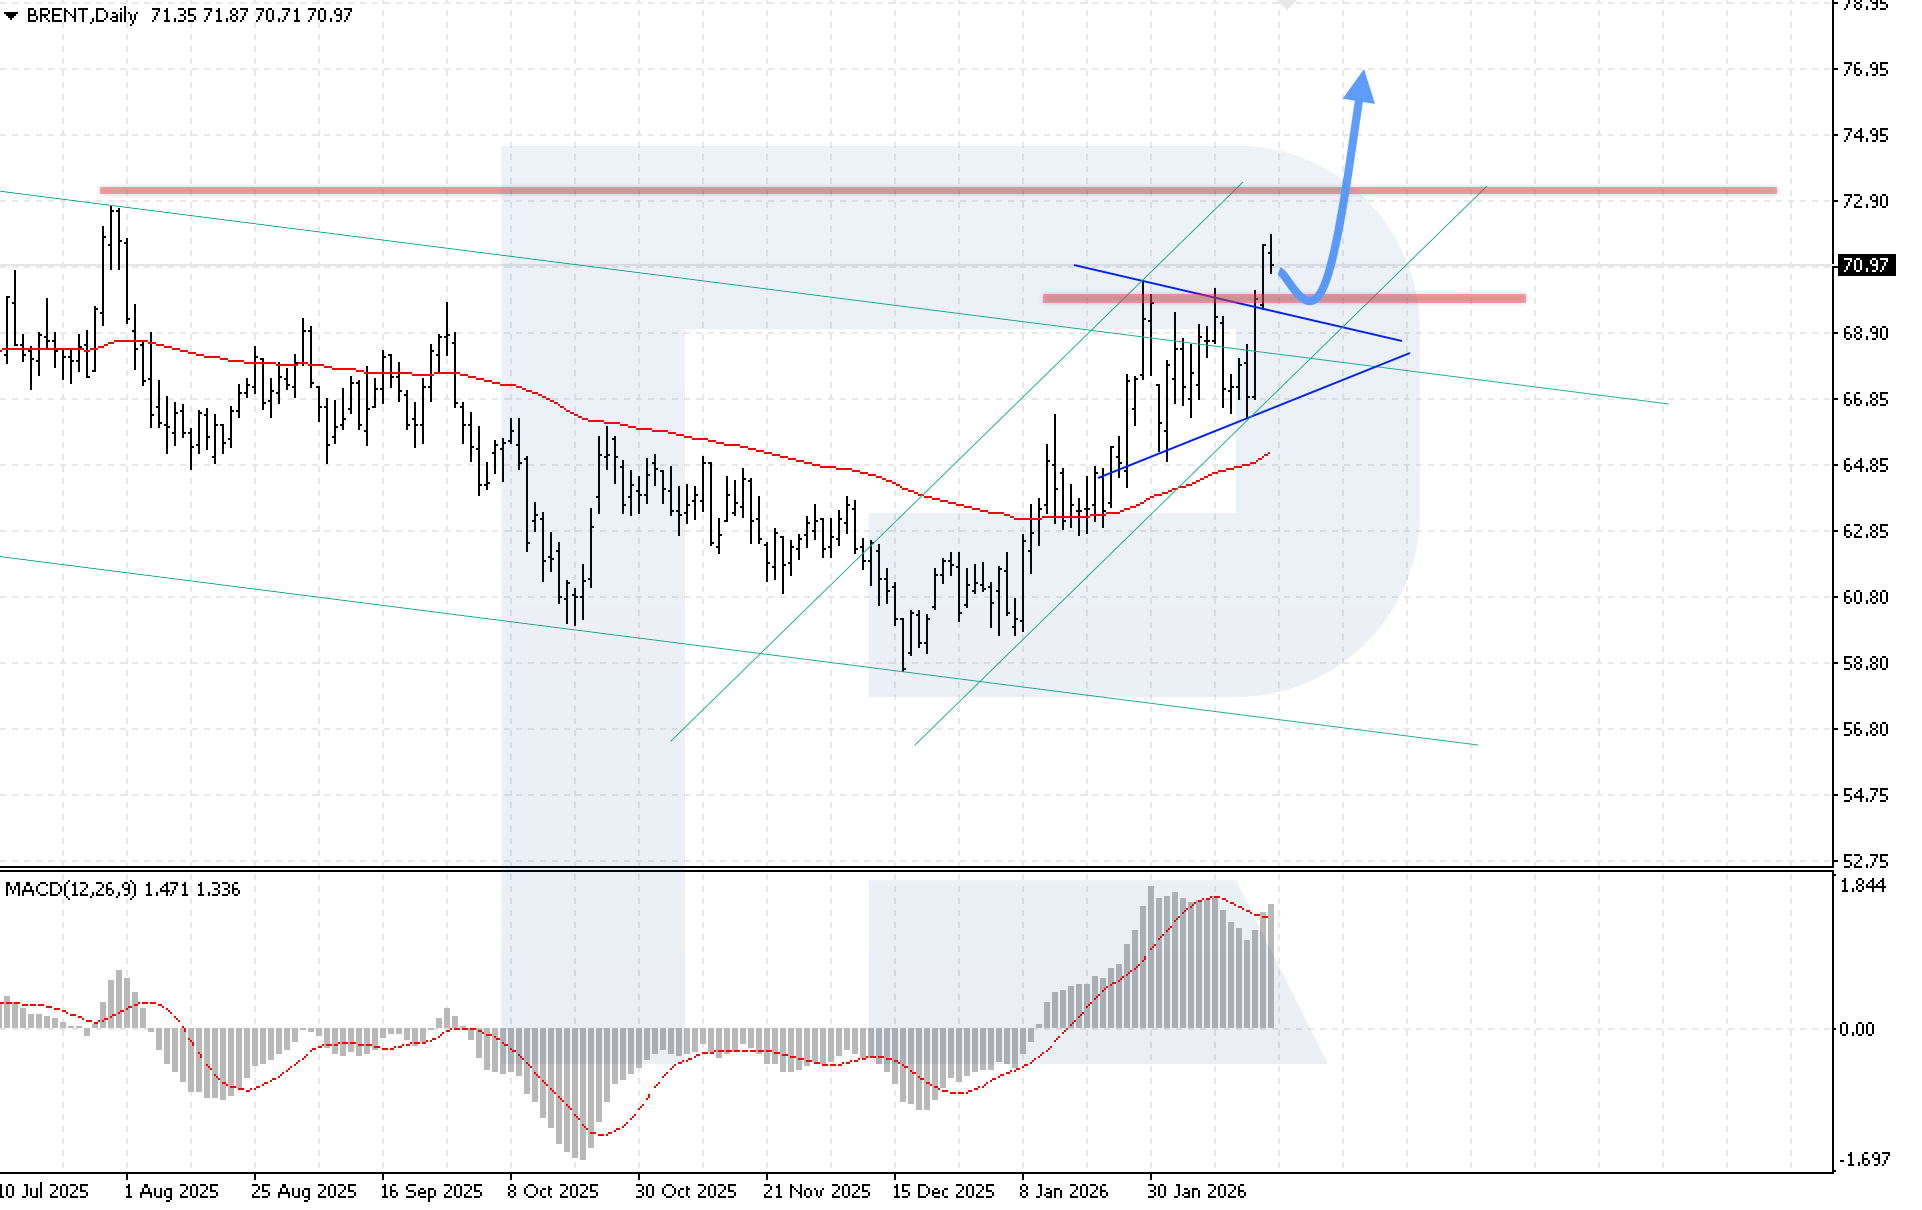
Brent prices are rising actively, attempting to consolidate above the key resistance level at 70.00 USD per barrel.
The market is supported by geopolitical factors: the US president set a strict deadline for progress in nuclear talks with Iran – substantial results must be achieved within a few days. At the same time, the US has deployed its largest military grouping in the Middle East, increasing fears of potential supply disruptions.
A conflict with Iran could restrict movement through the Strait of Hormuz, a key transport corridor for oil exports from the region. An additional boost to bullish sentiment came from data showing a drop in US oil inventories, the largest draw since early September.
Brent technical analysis
On the daily Brent chart, prices have consolidated above the upper boundary of a Triangle pattern, which may indicate continued growth this week. The outlook suggests a rebound from the support level, followed by a move towards 76.95 USD.
MACD confirms the growth phase: the histogram is rising actively, although buyers may face the formation of a bearish divergence. A key condition for the bullish scenario this week is consolidation above 72.90 USD.
The bullish scenario will be cancelled if the support level is broken and prices consolidate below 68.05 USD. This would confirm a return to the descending channel and a breakout of the Triangle pattern’s upper boundary.
Brent forecast scenarios
Bullish scenario (main): a rebound from the upper boundary of the Triangle pattern within the bullish channel would open the potential for continued growth with a target at 76.95 USD.
Bearish scenario (alternative): if prices fall sharply and consolidate below 68.05 USD, the downward movement in the oil market is expected to continue.
Editors’ picks
 EURUSD 2026-2027 forecast: key market trends and future predictions
This article provides the EURUSD forecast for 2026 and 2027 and highlights the main factors determining the direction of the pair’s movements. We will apply technical analysis, take into account the opinions of leading experts, large banks, and financial institutions, and study AI-based forecasts. This comprehensive insight into EURUSD predictions should help investors and traders make informed decisions.
 Gold (XAUUSD) forecast 2026 and beyond: expert insights, price predictions, and analysis
Dive deep into the Gold (XAUUSD) price outlook for 2026 and beyond, combining technical analysis, expert forecasts, and key macroeconomic factors. It explains the drivers behind gold’s recent surge, explores potential scenarios including a move toward 4,500 to 5,000 USD per ounce, and highlights why the metal remains a strong hedge during global uncertainty.
Forecasts presented in this section only reflect the author’s private opinion and should not be considered as guidance for trading. RoboForex bears no responsibility for trading results based on trading recommendations described in these analytical reviews.