Weekly technical analysis and forecast (25-29 August 2025)
This weekly technical analysis highlights the key chart patterns and levels for EURUSD, USDJPY, GBPUSD, AUDUSD, USDCAD, gold (XAUUSD), and Brent crude oil to forecast market moves for the upcoming week (25-29 August 2025).
Major technical levels to watch this week
- EURUSD: Support: 1.1550, 1.1400. Resistance: 1.1725, 1.1800
- USDJPY: Support: 146.25, 144.00. Resistance: 148.50, 150.80
- GBPUSD: Support: 1.3366, 1.3144. Resistance: 1.3590, 1.3690
- AUDUSD: Support: 0.6400, 0.6245. Resistance: 0.6480, 0.6565
- USDCAD: Support: 1.3727, 1.3650. Resistance: 1.3911, 1.4020
- Gold: Support: 3,333, 3,255. Resistance: 3,370, 3,400
- Brent: Support: 64.70, 60.00. Resistance: 68.20, 71.60
EURUSD forecast
The results of the Trump-Putin summit remain in focus. Despite no breakthrough agreements, both sides indicated the possibility of gradual negotiations on sanctions and tariffs. For the euro, this means continued uncertainty: the US hard stance on tariffs and energy supports the dollar, while any hint of compromise could weaken the USD.
The ECB signals risks of eurozone economic slowdown, while the Fed maintains hawkish rhetoric, suggesting rates could stay higher for longer. Monetary policy balance remains in favour of the dollar:
- US GDP revision and PCE index (the Fed’s key inflation gauge) are due
- In the eurozone, focus will be on PMI indices, which show weakness in Germany and France’s industry
Fundamentals favour the US dollar, increasing the likelihood of a bearish EURUSD scenario.
EURUSD technical analysis
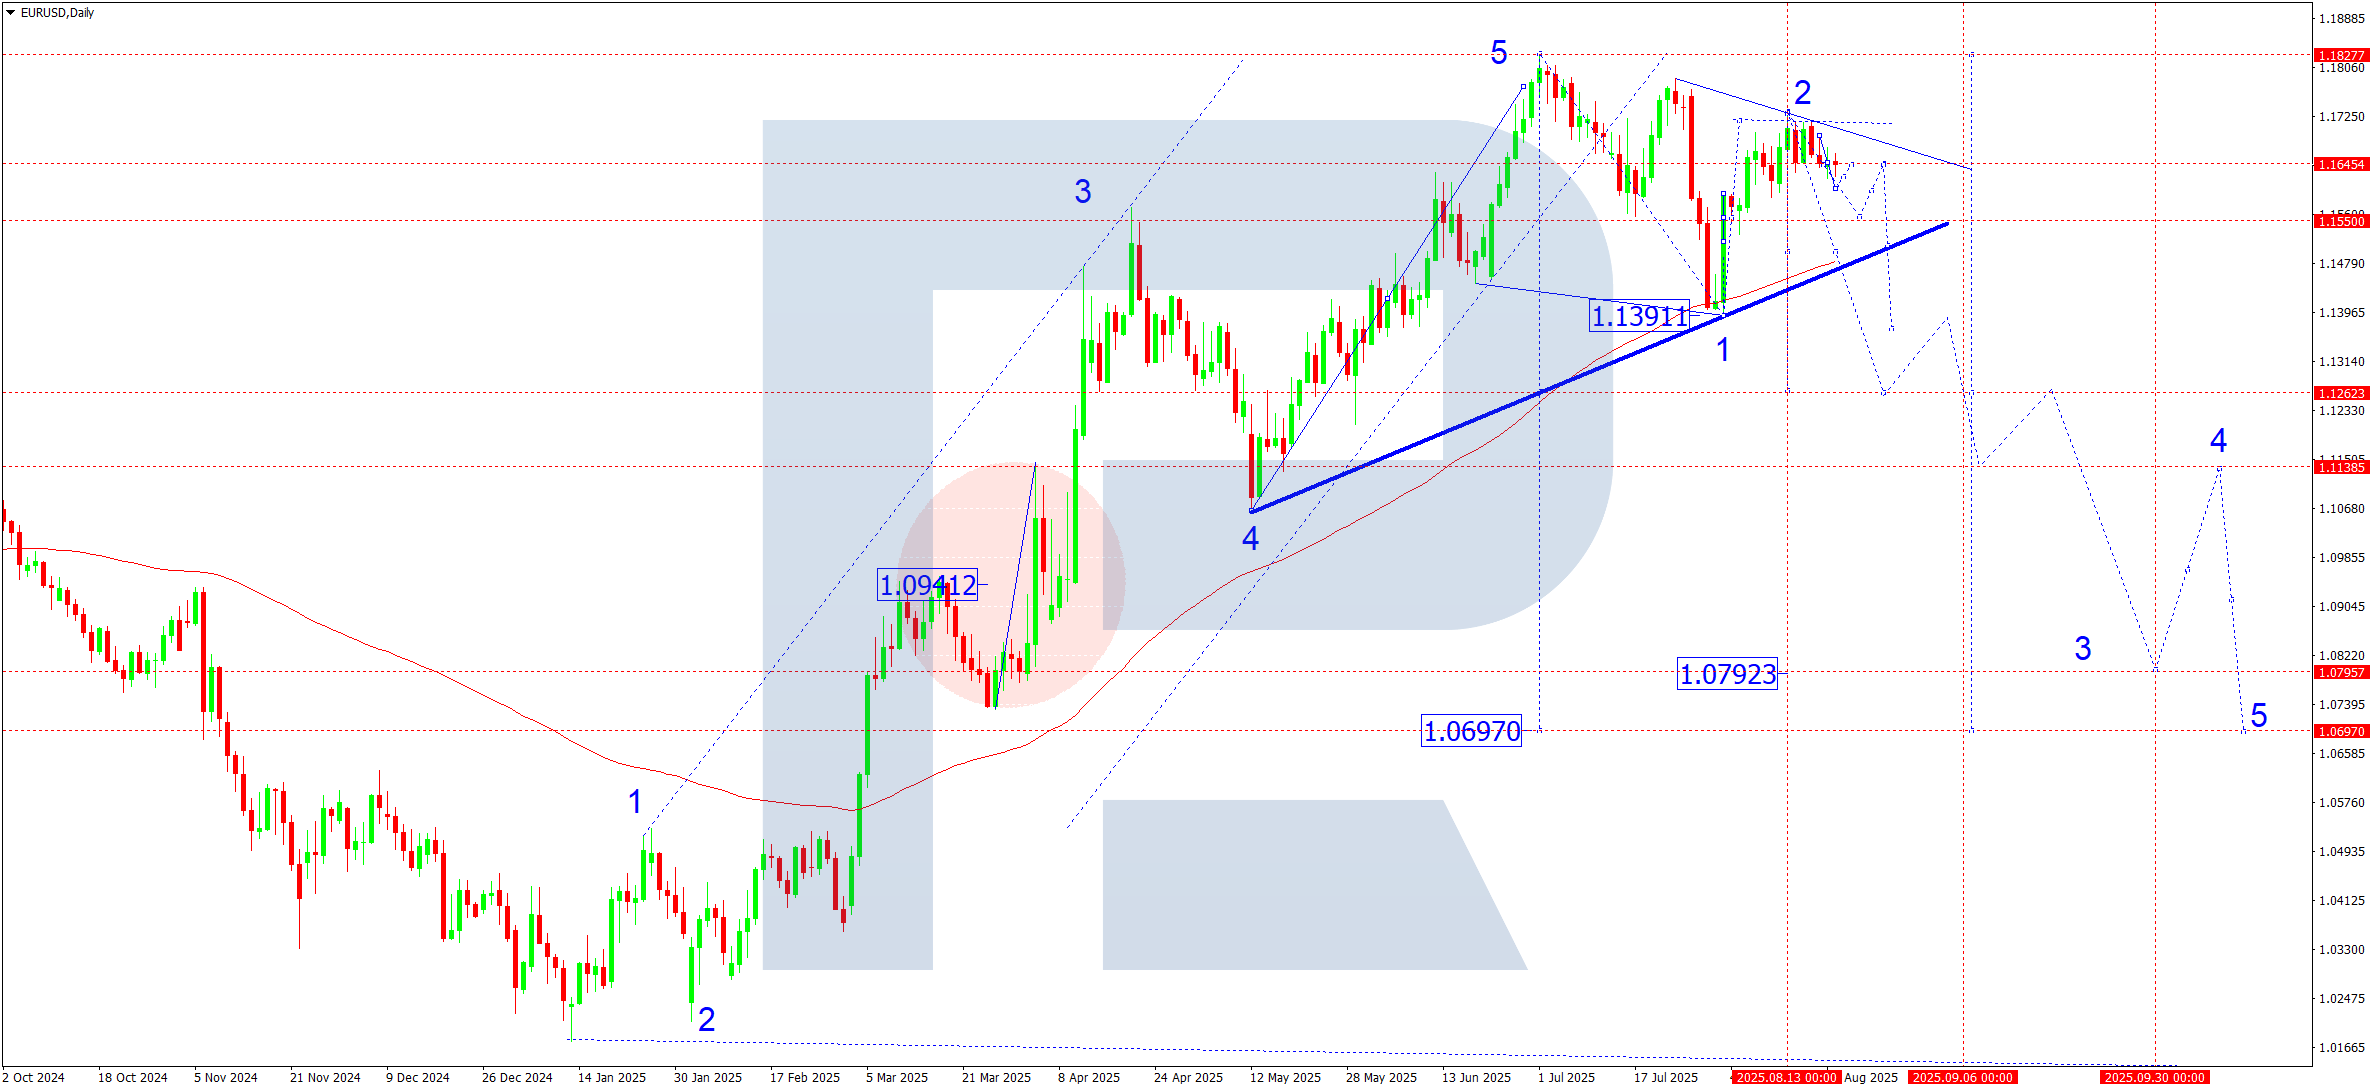
On the daily chart, the EURUSD pair formed a consolidation range near 1.1645 and broke below it, with the first wave targeting 1.1550. Subsequently, a correction towards 1.1640 is expected.
The market retains potential for further decline towards 1.1260, the first major target of the new bearish structure. SMA50 (1.1500) may temporarily contain the fall, but a breakout lower will increase pressure.
EURUSD forecast scenarios
Bearish (base):
A downward wave structure forms:
- Wave 1 – 1.1550
- Wave 2 – correction towards 1.1645 (testing from below)
- Wave 3 – 1.1400
- Wave 4 – correction towards 1.1500 (testing from below)
- Wave 5 – target of 1.1260
Bullish (alternative):
If the market consolidates above 1.1725, this would open the door for a move towards 1.1800.
USDJPY forecast
The US-Russia summit was the key August event. Despite statements of readiness for dialogue, both sides maintained hard positions on security and sanctions. For the yen as a safe-haven asset, this means demand remains amid geopolitical risks.
Fed hawkishness continues to support the dollar, especially with strong US PCE and GDP expectations. Rising Treasury yields increase demand for the dollar against the yen.
The Bank of Japan maintains an ultra-loose stance. Despite discussions about possible easing of yield curve control, the regulator still holds ultra-low rates, adding to pressure on the yen in the medium term. Fundamentals lean towards the US dollar, but the Trump-Putin factor and geopolitical uncertainty may boost yen demand.
USDJPY technical analysis
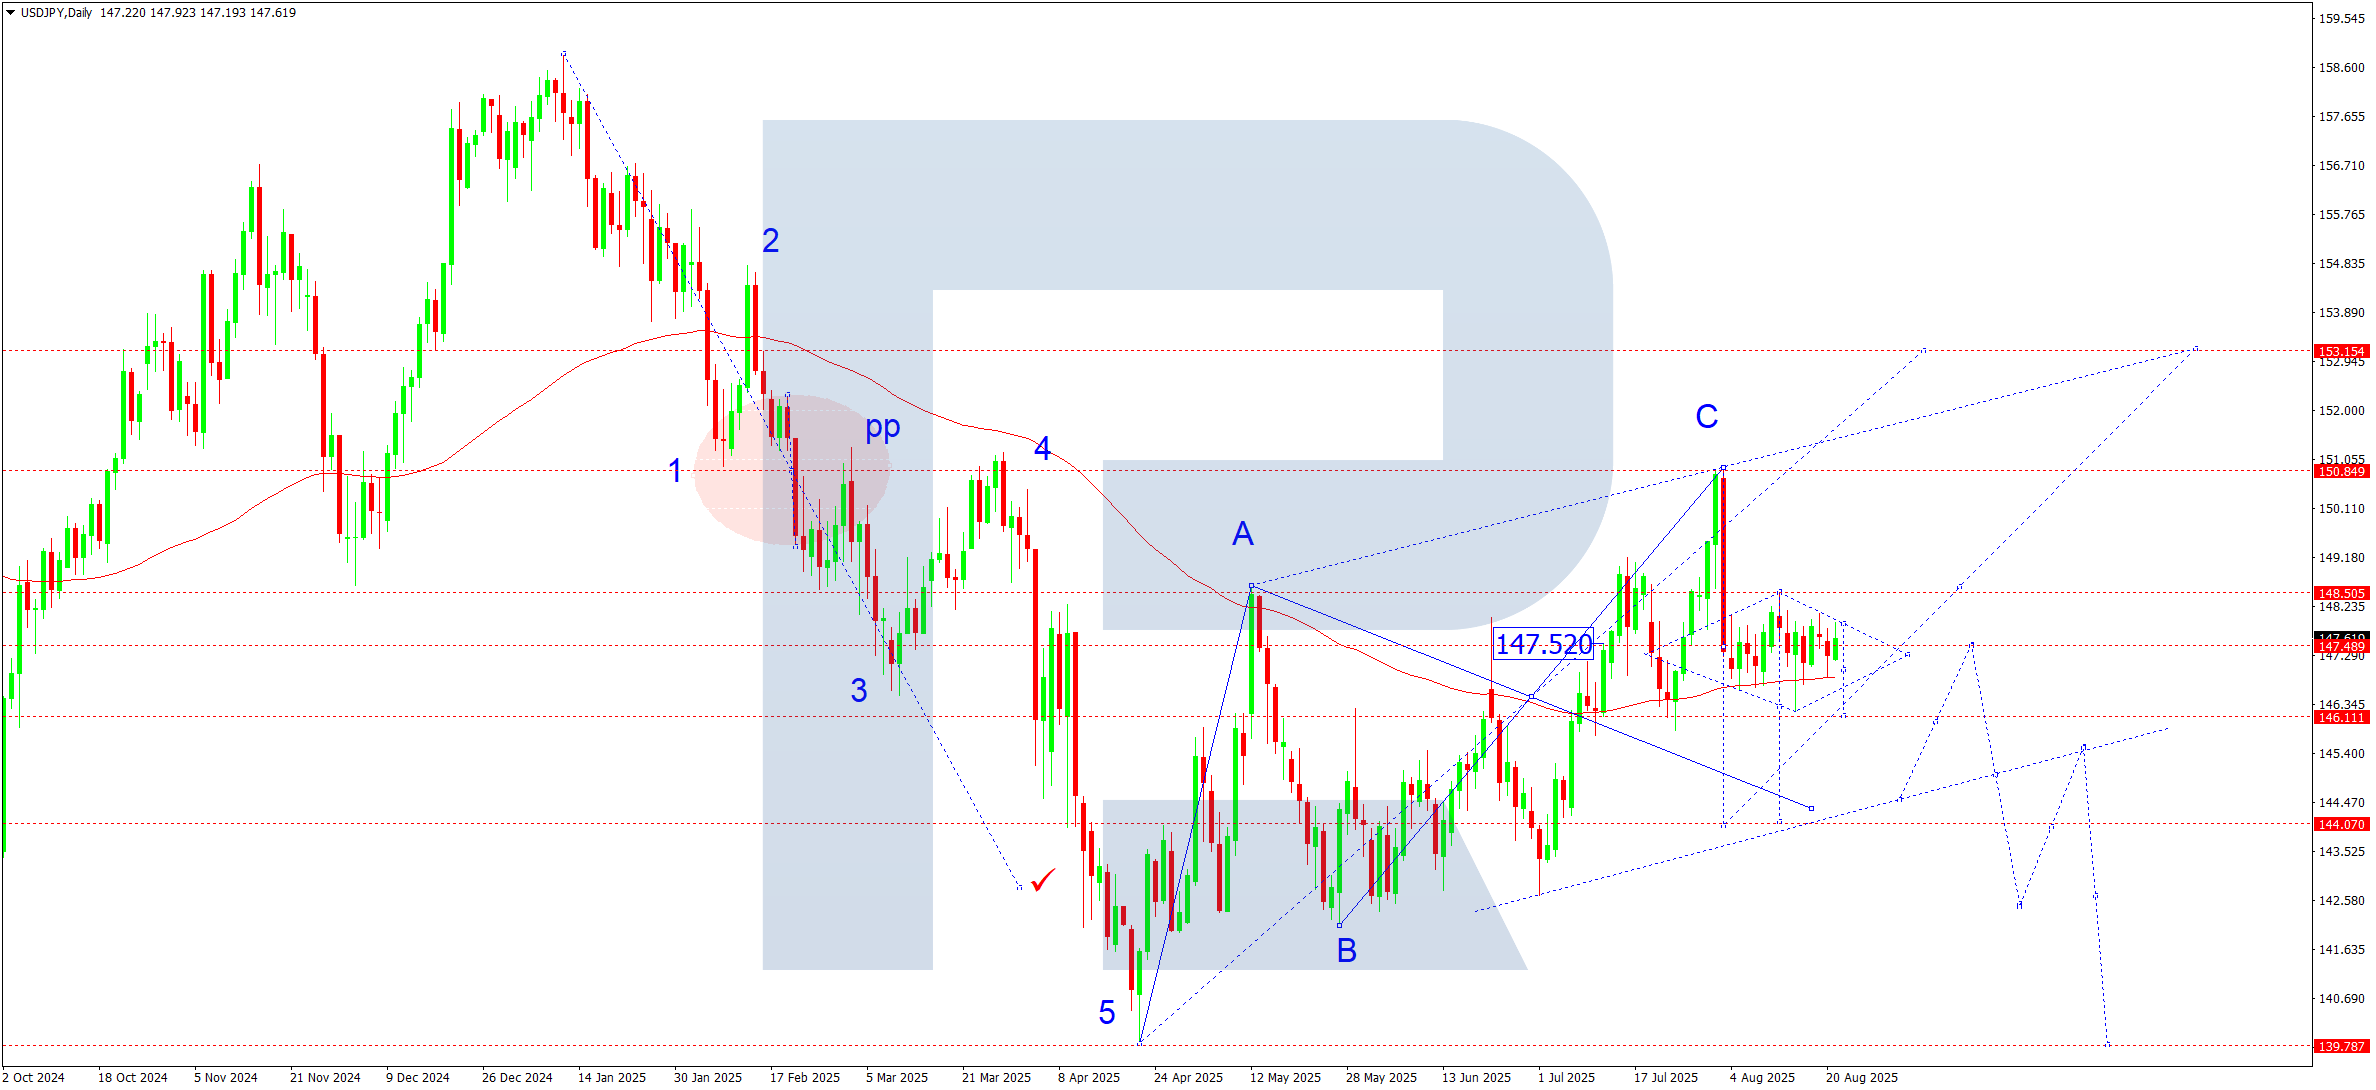
On the daily chart, the USDJPY pair is consolidating around 147.47, signalling preparation for an impulse move. SMA50 (146.25) provides support, shaping the base for the fifth growth wave from the 139.80 low. The upward A–B–C structure has bottomed, with the market balancing on the edge of a breakout from the corrective pennant.
USDJPY forecast scenarios
Bullish (main):
If SMA50 (146.25) holds and price breaks above the 148.00-148.50 resistance area with rising volumes, a new bullish wave will unfold, with targets at:
- 150.80
- 153.15 (channel’s upper boundary)
Bearish (alternative):
A confident breakout below 146.25, bolstered by volumes, will push the pair down to 144.00. If geopolitical risks escalate and safe-haven demand grows, declines could extend to 139.80 (previous wave’s base).
GBPUSD forecast
The Bank of England continues to balance between a slowing economy and still high inflation. Rhetoric remains cautious, with no signals of imminent hikes. The Fed maintains a hawkish stance, supporting the dollar. High US Treasury yields limit the pound’s potential.
Uncertainty over London-EU trade talks adds moderate pressure on the GBP. Fundamentals tilt in favour of the dollar, reinforcing a bearish scenario for GBP.
GBPUSD technical analysis
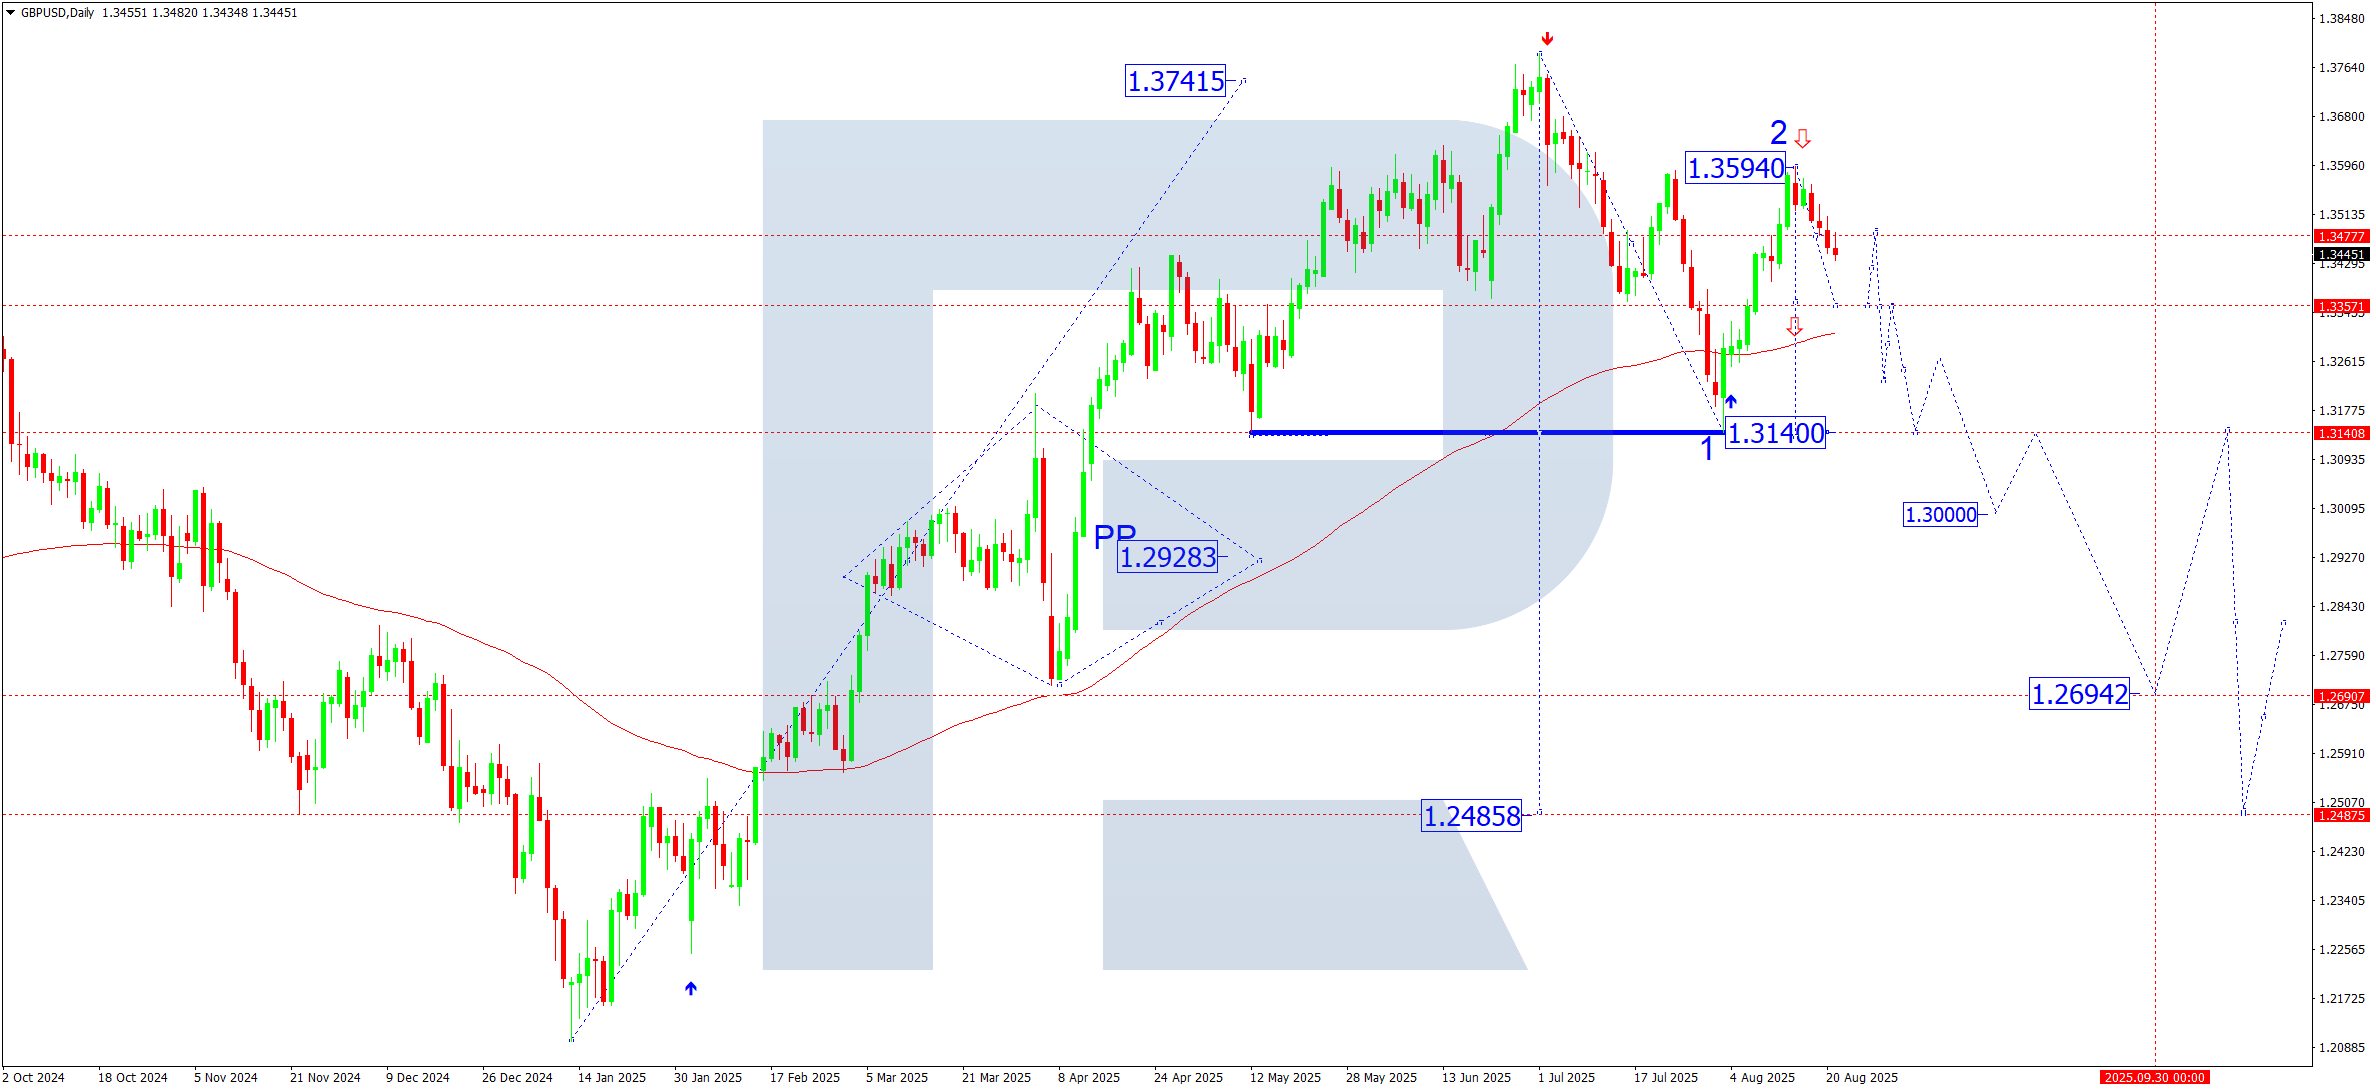
On the daily chart, the GBPUSD pair completed a corrective rise to 1.3590 before returning to a downward structure.
Current dynamics confirm the development of the third wave down. The first leg has already formed with a local target of 1.3140.
Near 1.3355, the pair will test SMA50, possibly causing a short-term rebound to 1.3477, after which the likelihood of a continued drop to 1.3355 and lower remains high.
GBPUSD forecast scenarios
Bearish scenario (base) suggests a continuation of the third downward wave.
- The first target is at 1.3140
- A breakout will open a path to 1.3000 and then 1.2695 (the wave’s key estimated target)
Bullish scenario (alternative): if the market holds above 1.3355 and consolidates over 1.3600, the bullish structure will gain momentum, with potential targets at:
- 1.3660
- 1.3800
- 1.4000
- with strong impulse – up to 1.4160
AUDUSD forecast
The Reserve Bank of Australia maintains a dovish stance, reluctant to tighten amid economic slowdown and weak domestic activity. Fed hawkishness strengthens the US dollar, reducing demand for risk currencies like the AUD. Iron ore and copper prices remain under pressure, weighing on the Australian dollar. China trade risks add further vulnerability. Fundamentals support a bearish scenario.
AUDUSD technical analysis
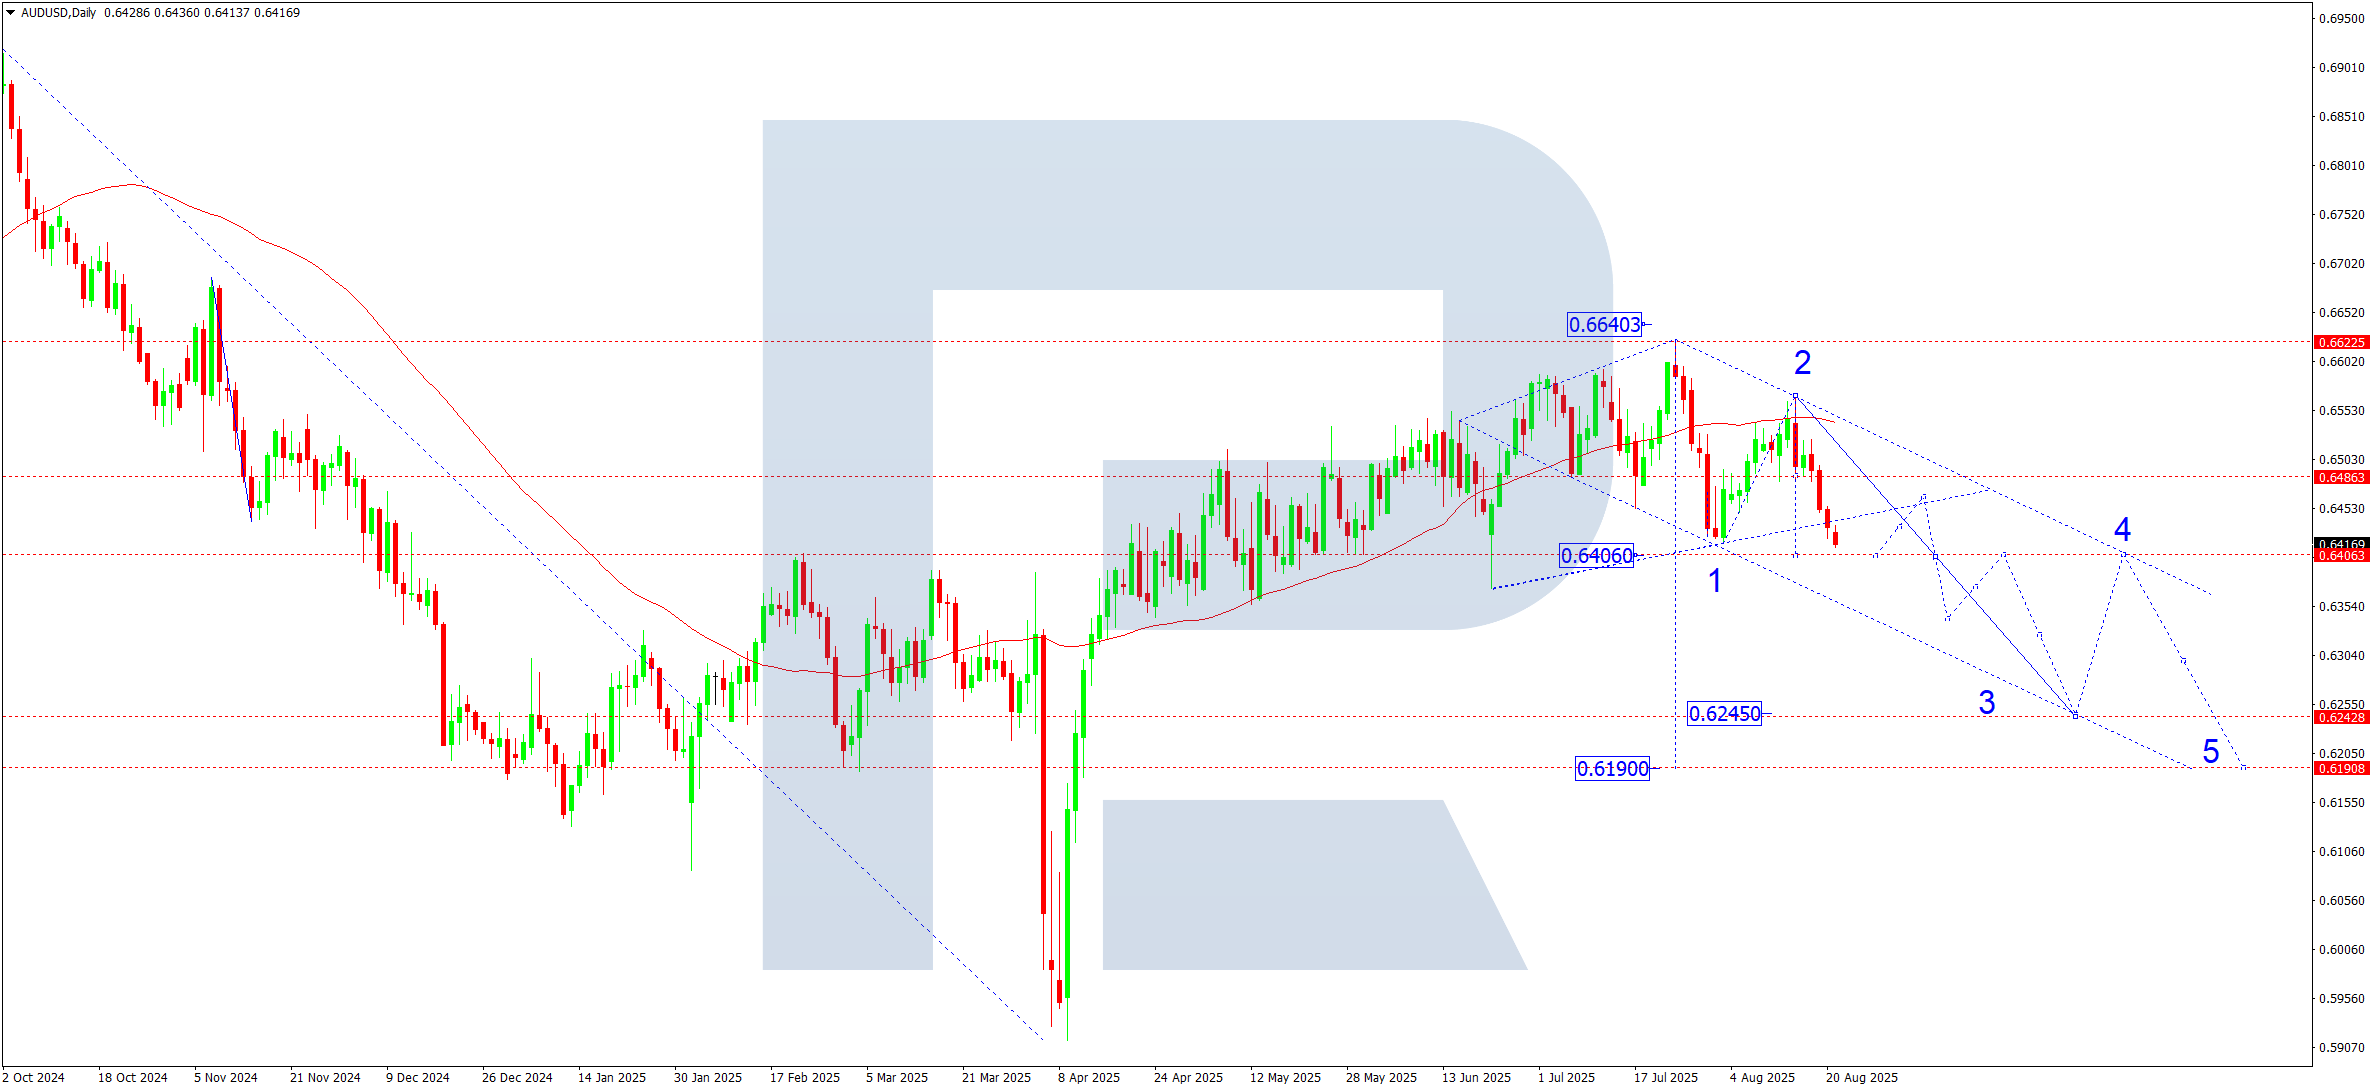
On the daily chart, the AUDUSD pair forms a downward wave structure targeting 0.6400. Next week, the pair is expected to test this level, after which consolidation may form. A breakout lower would activate the third downward wave with a local target of 0.6245. Afterwards, a corrective rebound to 0.6400 (testing from below) is likely before the fifth wave starts, aiming for 0.6190.
AUDUSD forecast scenarios
Bearish scenario (base):
- 0.6400 – intermediate target (likely pivot point for the current structure)
- 0.6245 – third-wave target
- 0.6190 – main target of the first downward wave
Bullish scenario (alternative):
Consolidation above 0.6550 could open the way to growth with targets фе:
- 0.6670
- 0.6820
- 0.6969 (extended fifth wave)
USDCAD forecast
Last week’s Brent price growth limited the USD upside against the CAD. The Bank of Canada remains cautious, pointing to risks from a global slowdown. Fed hawkishness temporarily supports USD, but expectations of a softer cycle reduce long-term upside. The fundamental backdrop is mixed, raising the likelihood of consolidation near current levels.
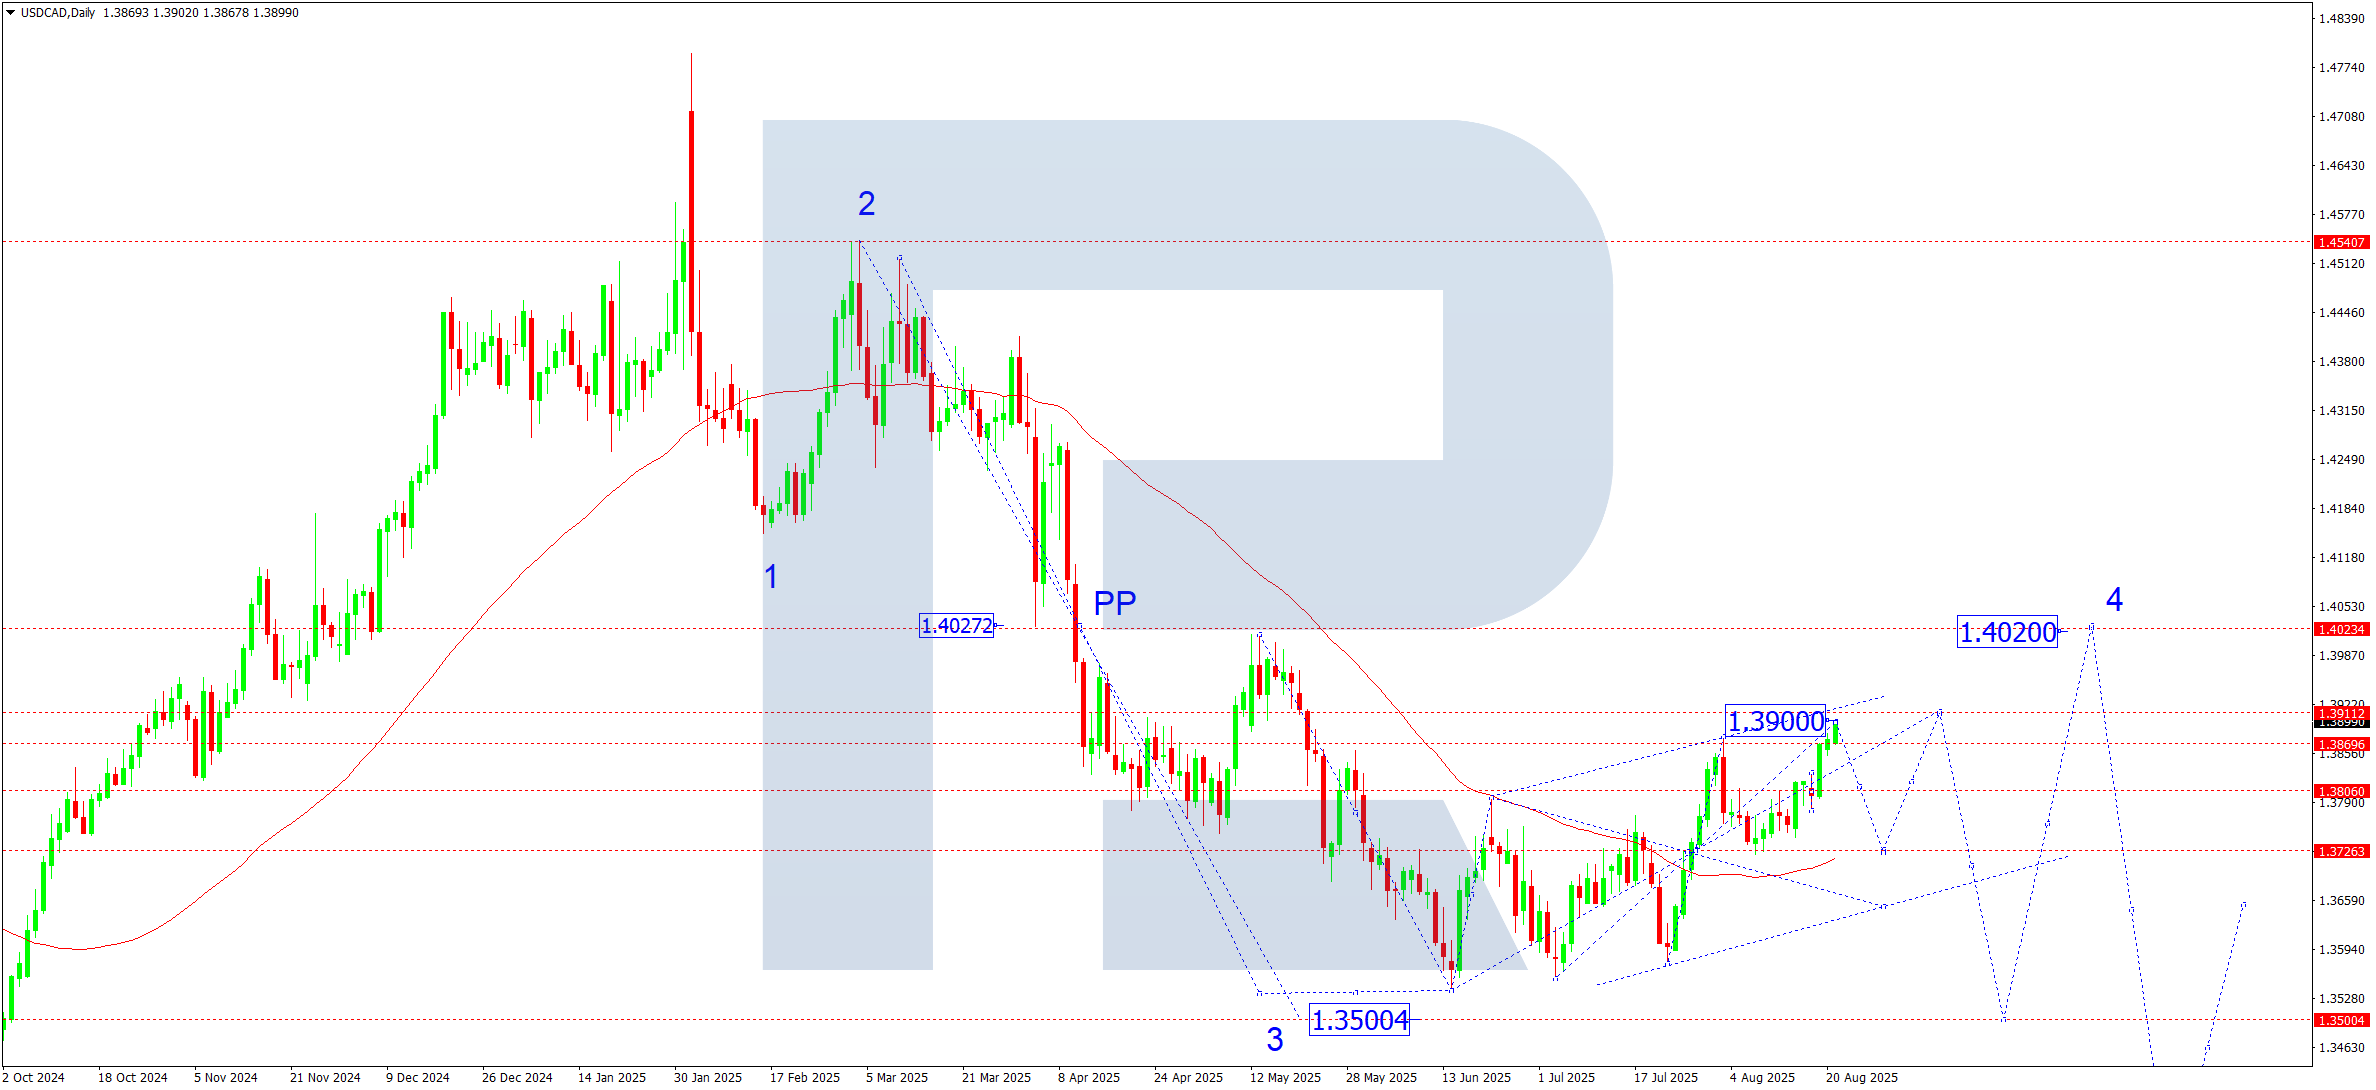
USDCAD technical analysis
On the daily chart, the USDCAD pair reached its third-wave growth target of 1.3900, confirming the pivot point at 1.3727. Next week, a correction towards 1.3727 (testing from above) is possible. The main correction target lies near 1.3911. The long-term picture remains neutral-to-bearish, with the downtrend expected to resume towards 1.3600-1.3500. Thus, current growth is seen as a correction within the dominant downtrend.
USDCAD forecast scenarios
Bullish scenario (main): a firm consolidation above 1.3727 and a breakout above 1.3800 will open growth potential with the target at 1.3911 – main correction target.
Further ahead, a return to the downtrend with a decline towards 1.3270 is possible.
Bearish scenario (alternative): the completion of the correction near 1.3911 will increase pressure. Downside targets:
- 1.3800
- 1.3700
- 1.3600
- 1.3500 (base target for the third wave from 1.4540)
XAUUSD forecast
The tough rhetoric of the US regulator puts pressure on gold, but expectations of an imminent start of policy easing limit the potential strengthening of the dollar. Amid ongoing armed conflicts, interest in gold as a safe-haven asset remains, but local corrections are inevitable. Profit-taking after the rapid growth since spring increases the risk of forming a medium-term top. The fundamental background remains mixed. In the short term, gold is under pressure from the dollar and technical correction, but in the medium term, it remains supported by geopolitical risks and safe-haven demand.
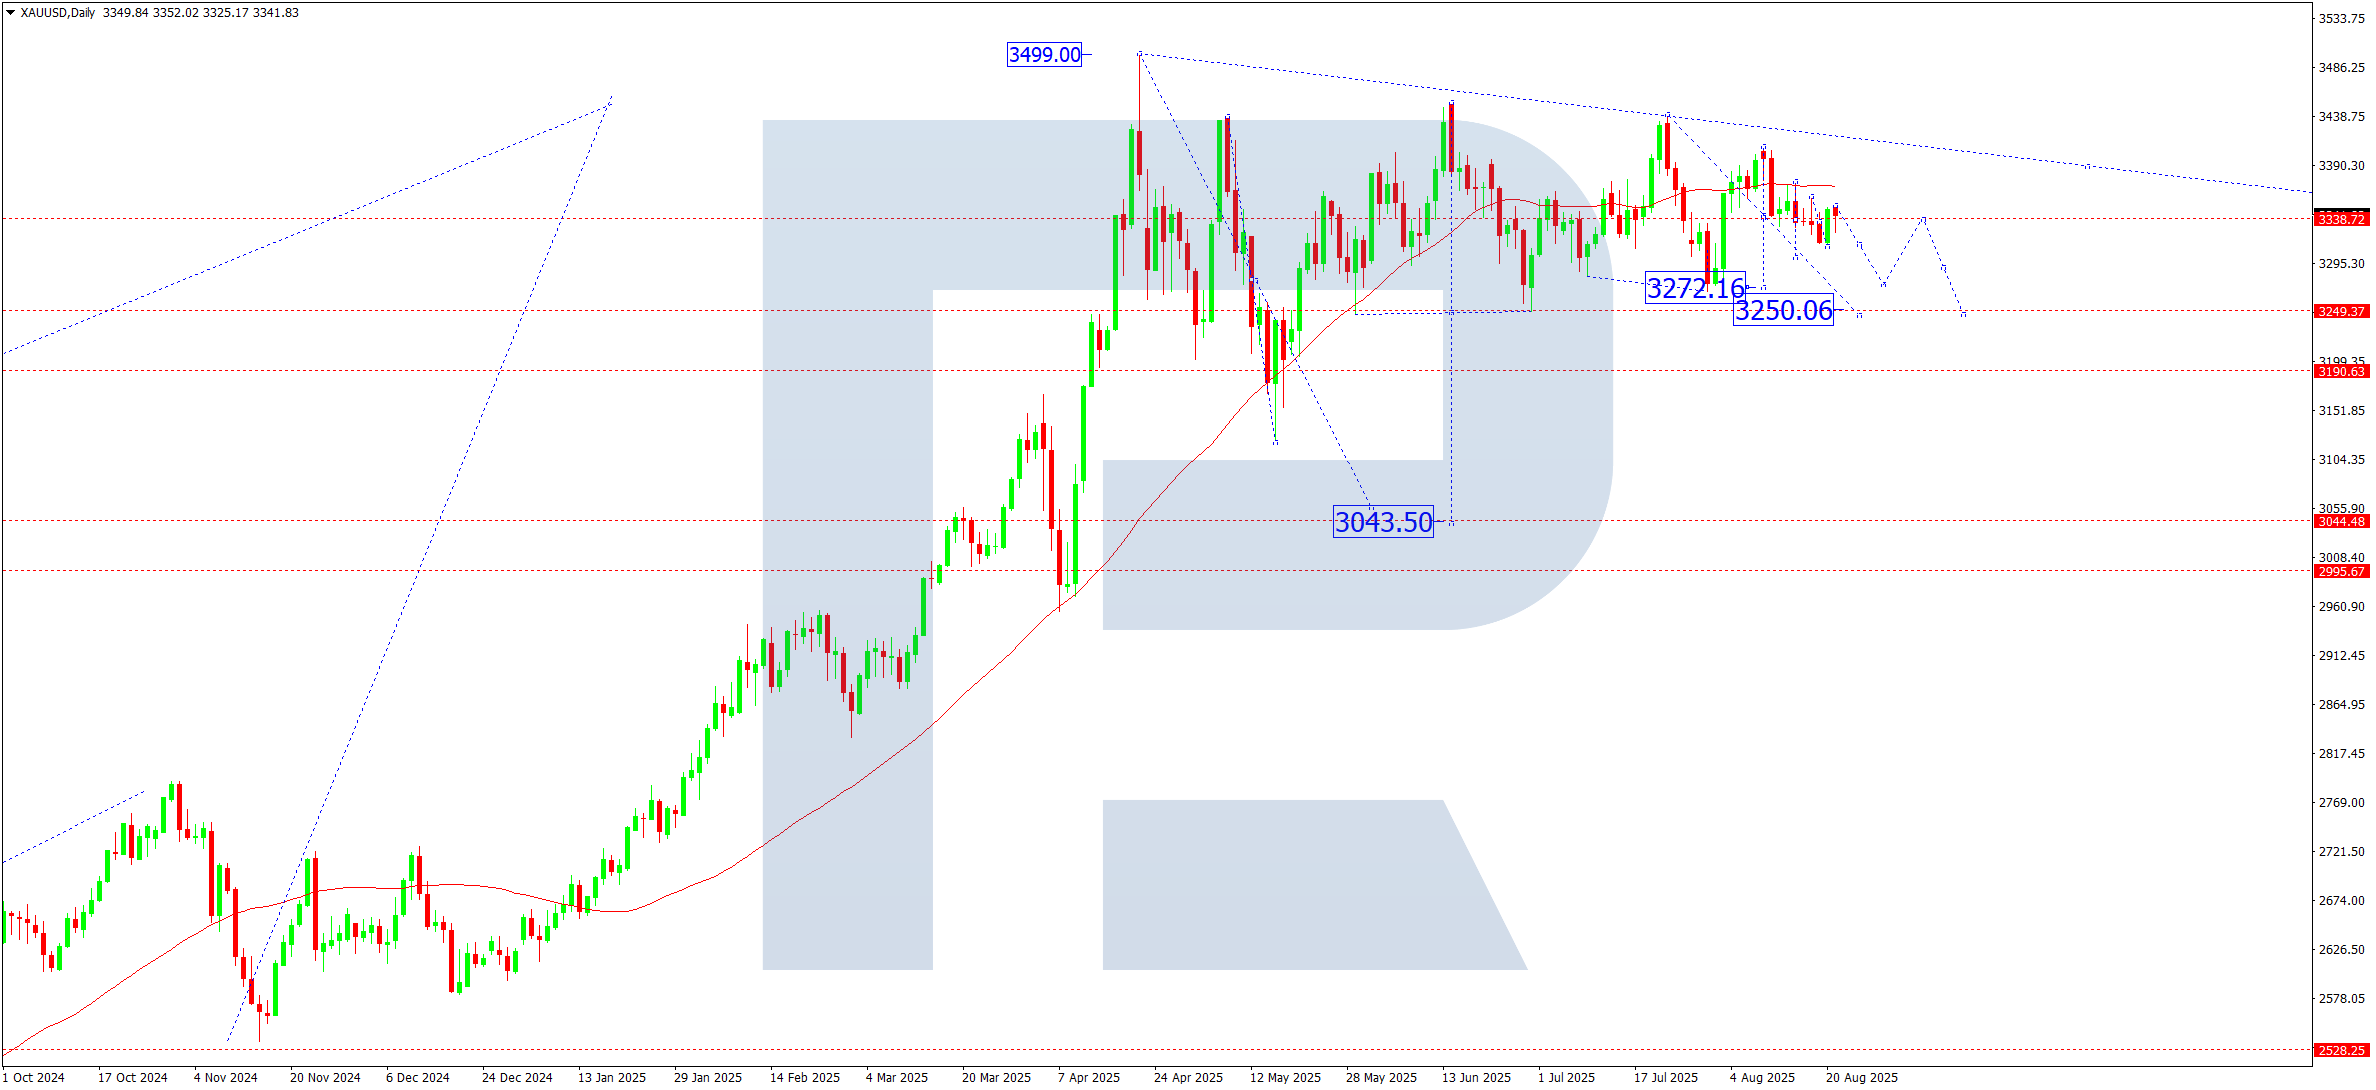
XAUUSD technical analysis
On the daily chart, gold rebounded down from 3,335 (SMA50 zone). A symmetrical triangle pattern is forming, which indicates an accumulation phase and readiness for a major move. The nearest downside target is 3,250, and if broken, the potential will open for further correction towards 3,043. A breakdown of the 3,320 level downwards next week will confirm the reversal scenario. In the short term, a renewed rise to 3,350 (resistance test) is possible. Thus, gold is forming a top in the coming days with a high probability of a corrective scenario, while steady safe-haven demand limits the depth of decline in the medium term.
XAUUSD forecast scenarios
Bearish scenario (main): a breakout and consolidation below 3,320 will activate a downward wave, with targets at:
- #.3,250 – intermediate support
- #.3,050 – 3,040 – technical and fundamental correction zone (main target)
Bullish scenario (alternative): a confident consolidation above 3,415 will open potential for further growth, with targets at:
- #.3,500 – key May resistance
- #.3,535 – potential upper boundary of the extended fifth wave
Brent forecast
The market received support amid expectations of reduced supplies and disciplined compliance with quotas by OPEC+. US drilling activity remains stable, but inventories are gradually declining, which supports prices. Risks of supply disruptions due to instability in the Middle East remain high, forming an additional premium in the price. Fundamentally, the oil market remains balanced, with moderate demand and supply restrictions supporting the growth scenario.
Brent technical analysis
Brent has completed its downward phase and is forming a bullish structure, but risks of a short-term correction remain, especially near local resistances. On the daily chart, Brent consolidated in the range above 64.75. With an upward breakout from the range, the downward wave can be considered complete. The potential is open for the development of the fifth wave of growth towards 78.30. In the coming week, growth to 71.60 (first target) is expected, followed by a possible correction towards 68.20.
Brent forecast scenarios
Bullish scenario (base): a breakout above 66.60 confirmed the resumption of the uptrend, with growth targets at:
- #.71.60 – first target
- #.68.20 – possible correction zone
- #.74.22 – local target
- #.78.30 – main target of the fifth wave
Bearish scenario (alternative):
A breakout and consolidation below 64.00 will add to pressure, with a downside target at:
- #.60.00 – key support level

Forecasts presented in this section only reflect the author’s private opinion and should not be considered as guidance for trading. RoboForex bears no responsibility for trading results based on trading recommendations described in these analytical reviews.