Weekly technical analysis and forecast (18-22 August 2025)
This weekly technical analysis highlights the key chart patterns and levels for EURUSD, USDJPY, GBPUSD, AUDUSD, USDCAD, gold (XAUUSD), and Brent crude oil to forecast market moves for the upcoming week (18-22 August 2025).
Major technical levels to watch this week
- EURUSD: Support: 1.1720, 1.1790. Resistance: 1.1268, 1.1140
- USDJPY: Support: 146.50, 145.30. Resistance: 148.50, 150.80
- GBPUSD: Support: 1.3366, 1.3144. Resistance: 1.3590, 1.3690
- AUDUSD: Support: 0.6400, 0.6245. Resistance: 0.6480, 0.6565
- USDCAD: Support: 1.3727, 1.3650. Resistance: 1.3895, 1.3920
- Gold: Support: 3,320, 3,250. Resistance: 3,385, 3,440
- Brent: Support: 64.70, 60.00. Resistance: 68.85, 71.60
EURUSD forecast
In the coming week, market participants will focus on both US and eurozone macroeconomic data and the situation surrounding negotiations to resolve the Ukrainian issue.
A potential easing of geopolitical tensions could temporarily support the euro by boosting interest in risk assets and reducing demand for the dollar as a safe-haven asset. However, analysts expect modest results, and any reaction may be speculative. Together with EU inflation data and US retail sales, this could shape a volatile but downward background for the pair.
EURUSD technical analysis
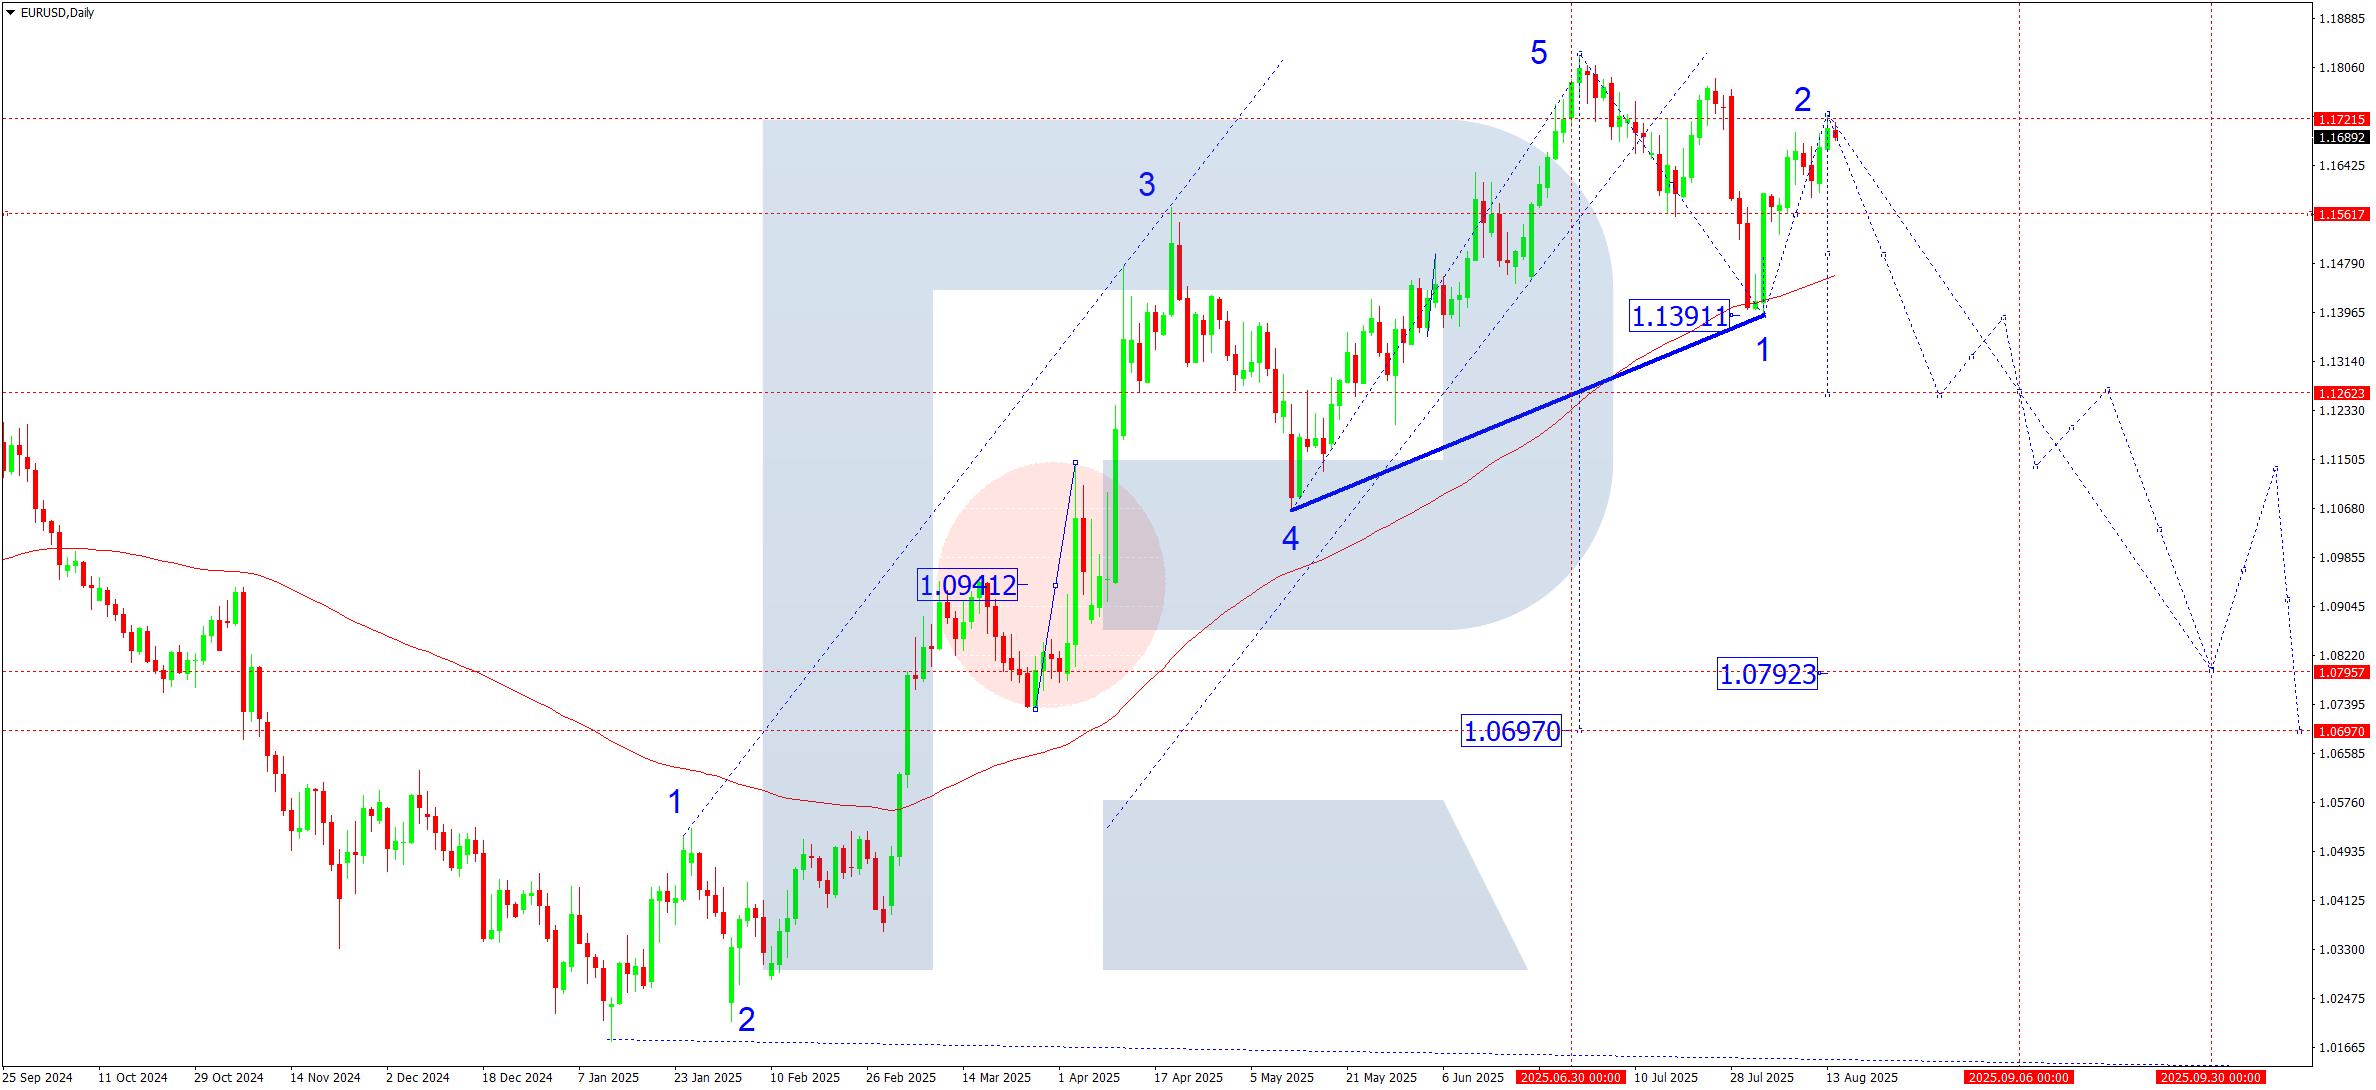
On the daily chart, EURUSD’s decline to 1.1391 can be viewed as the first wave, with SMA50 serving as intermediate support. The rise to 1.1720 is assessed as a corrective second wave. Next week, the first segment of a third downward wave is expected to form, targeting 1.1262.
EURUSD forecast scenarios
Bearish (base):
After the correction ends, the third downward wave is expected to continue.
Stages and targets:
- First segment – target of 1.1262
- Second segment – testing the 1.1390 level from below
- Third segment – target of 1.1140
- Fourth segment – testing the 1.1262 level from below
- Fifth segment – main third-wave target of 1.0800
Bullish (alternative):
If the market consolidates below 1.1720 and breaks upwards, growth potential towards 1.1790 will open. This would mean a continued correction and temporary easing of selling pressure.
USDJPY forecast
Next week, investors will focus on the Trump-Putin meeting, which may cause increased currency market volatility. The market will evaluate political and economic signals, including possible comments on international trade and geopolitics. Additional attention will go to US and Japanese statistics and US Treasury yield dynamics, which traditionally influence the USDJPY rate.
USDJPY technical analysis
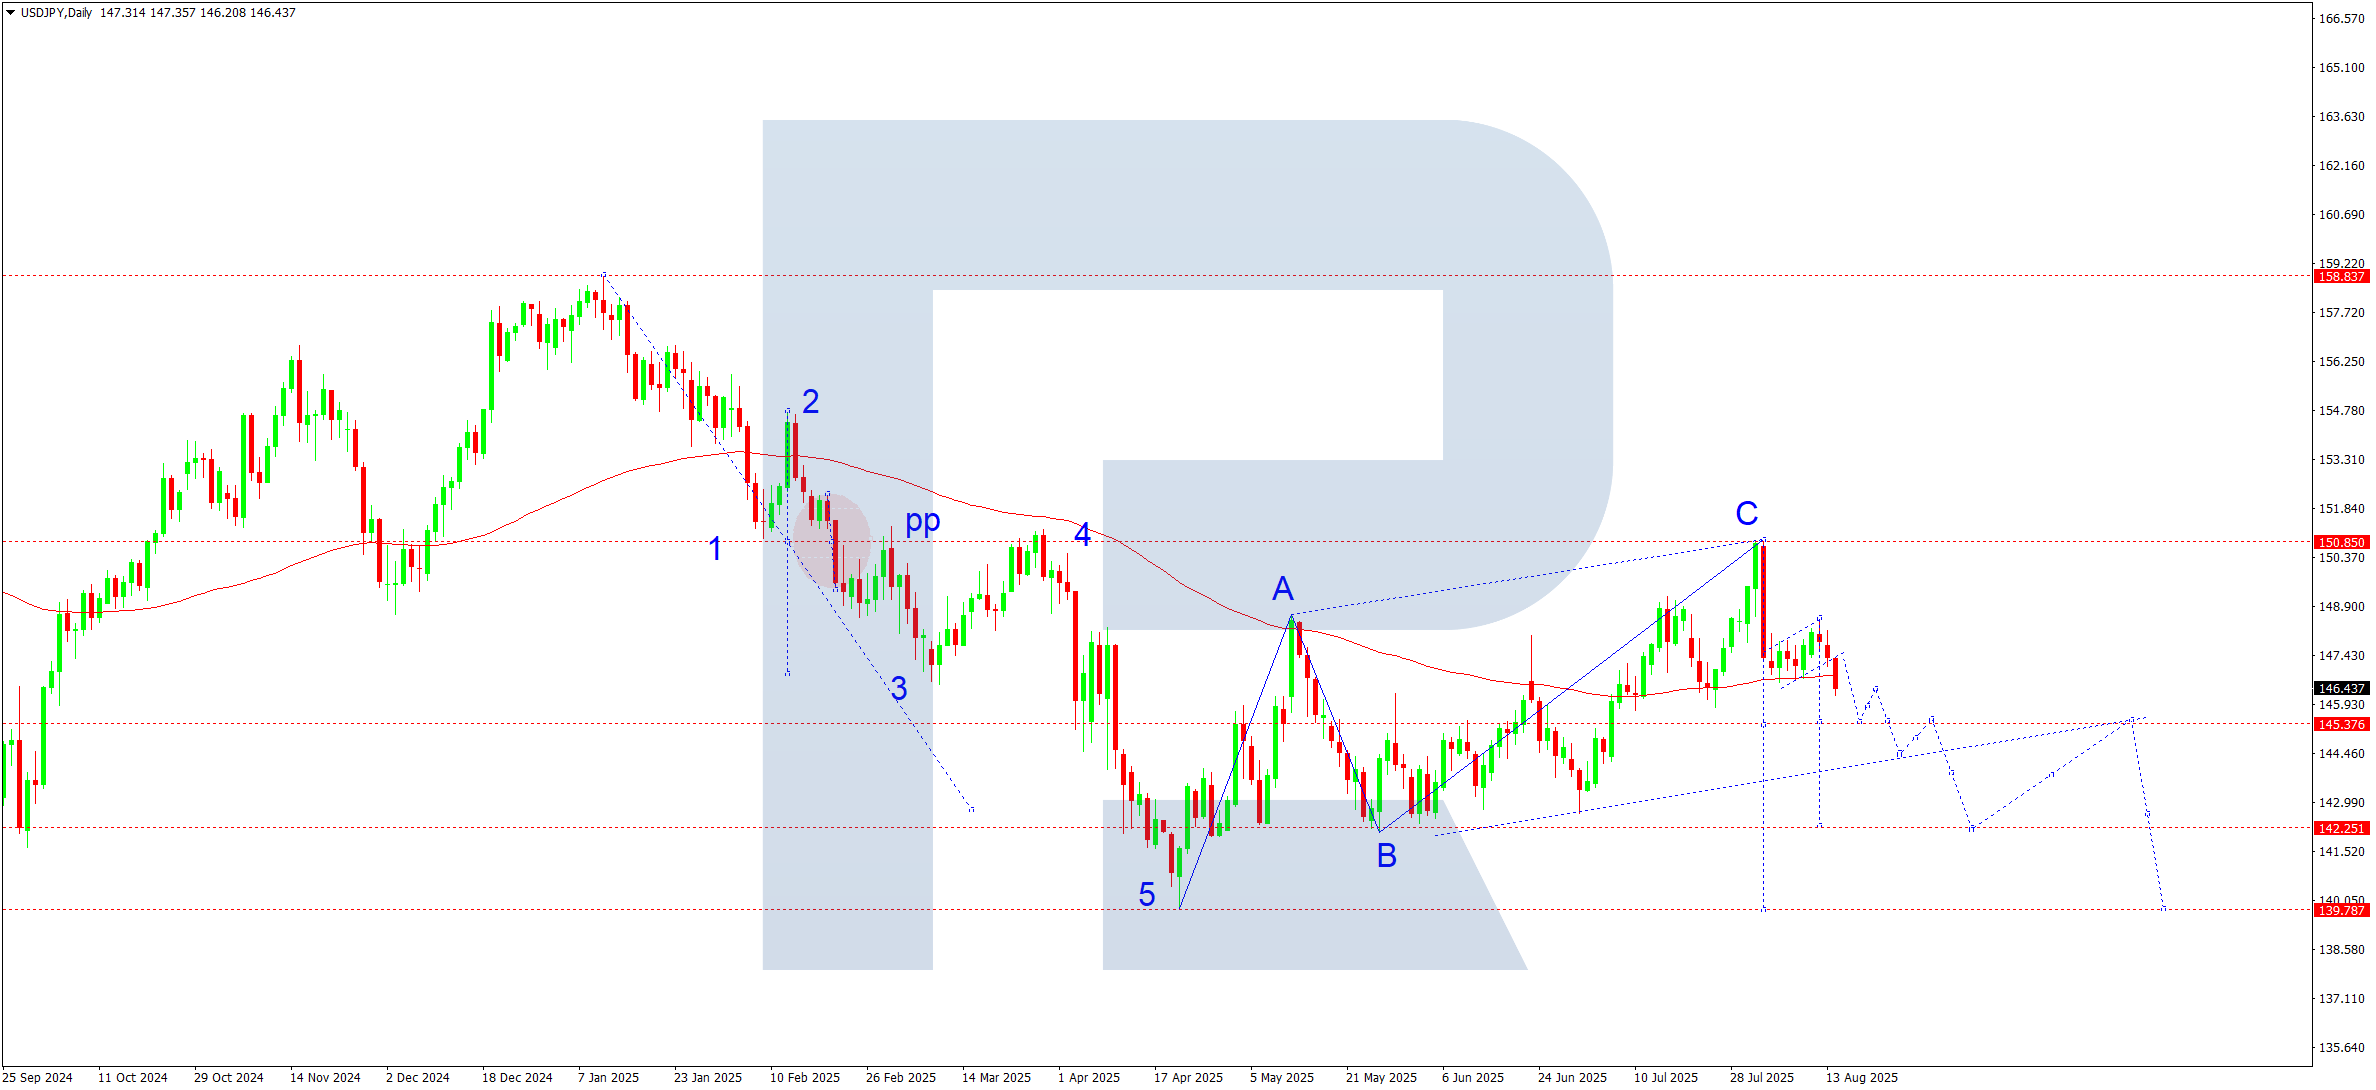
On the daily chart, the pair corrected towards 148.03 before forming a downward impulse and a structure resembling a “corrective pennant” with a breakout downwards. The current setup shows sellers’ interest in extending declines to 145.35.
Breaking this support level would open the way to 144.44 and then to the local target of 142.22.
USDJPY forecast scenarios
Bullish scenario (alternative):
If the SMA50 supports the pair near 146.50 and rising volumes push a breakout above 148.50, buyers could trigger a new upward correction towards 148.80, with prospects for 150.80.
Bearish scenario (main):
A firm breakout below 146.40, supported by increased volumes, will allow sellers to push the decline towards 142.25 and 139.80.
GBPUSD forecast
Next week, the GBPUSD pair will be heavily influenced by geopolitical events, particularly the summit between US President Donald Trump and Russian President Vladimir Putin on 15 August in Anchorage, Alaska. The summit took place amid rising US pressure on Russia. Trump had threatened 100% tariffs on Russian goods and 500% tariffs on countries buying Russian oil if a peace deal with Ukraine is not reached within 50 days, later shortened to 10-12 days. Proposals for territorial exchanges between Russia and Ukraine are also being discussed, causing concern in Kyiv and among its allies.
Trump and Putin will hold a private meeting with only interpreters present, underscoring the significance and confidentiality of the talks. Topics are expected to include ceasefire, possible economic concessions, and arms control.
Given the uncertainty, traders should exercise caution with GBPUSD between 18 and 22 August. The market may face high volatility from unexpected news and summit outcomes.
Monitoring official statements and press conferences will be crucial, as any geopolitical shifts may significantly impact the pair.
GBPUSD technical analysis
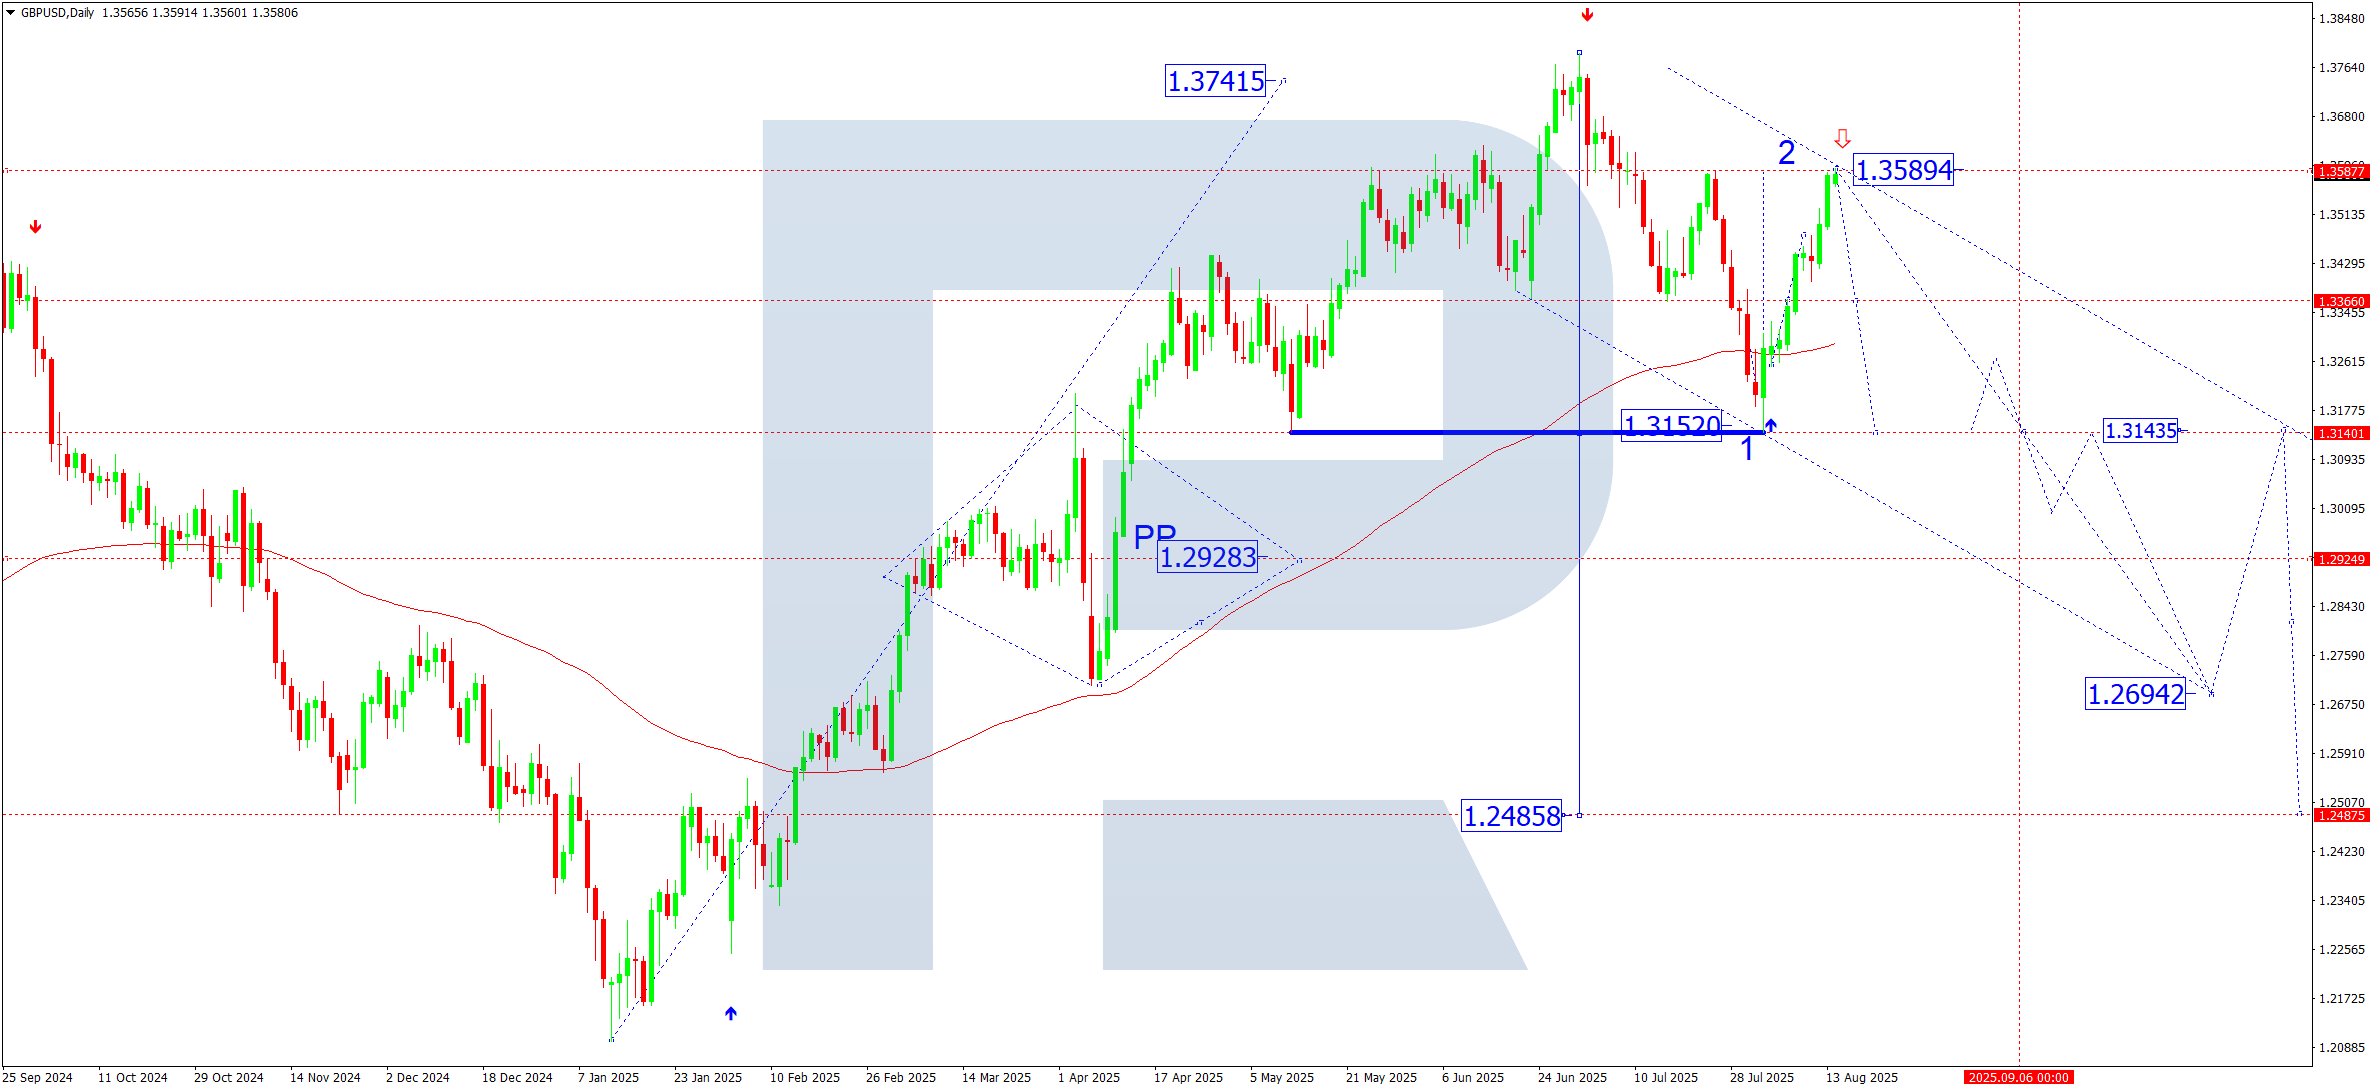
The GBPUSD daily chart shows a downward structure forming:
The first downward wave reached 1.3152.
The second corrective wave tested the 1.3589 level from below.
Target for the third wave is a drop towards 1.3366. If this level breaks, the decline could continue towards 1.3150, with movement potentially extending to 1.2700 as the main third-wave target.
Subsequently, a corrective rebound towards 1.3144 (the fourth target) is possible.
Further development suggests the fifth downward wave to 1.2485.
GBPUSD forecast scenarios
Bearish scenario (base):
Current situation: the GBPUSD pair is in a correction phase after dipping to 1.3152.
Short-term targets:
- Decline to 1.3366; if broken, further fall to 1.3150 and then to 1.2700
Long-term prospects:
- Possible continuation of the downtrend towards 1.2485
Bullish scenario (alternative):
Conditions for growth:
- A steady move above 1.3600 would open the way to 1.3660, potentially reviving the uptrend
- Growth targets: 1.3800, 1.4000, with strong momentum possibly reaching 1.4160
AUDUSD forecast
The fundamentals support a cautious bearish scenario for the AUDUSD pair. Stable Australian macroeconomic data combined with global uncertainty strengthen the US dollar. Commodity price declines and geopolitical uncertainty following the Trump-Putin summit add to pressure on the Aussie, with potential short-term swings in the rate and safe-haven demand.
AUDUSD technical analysis
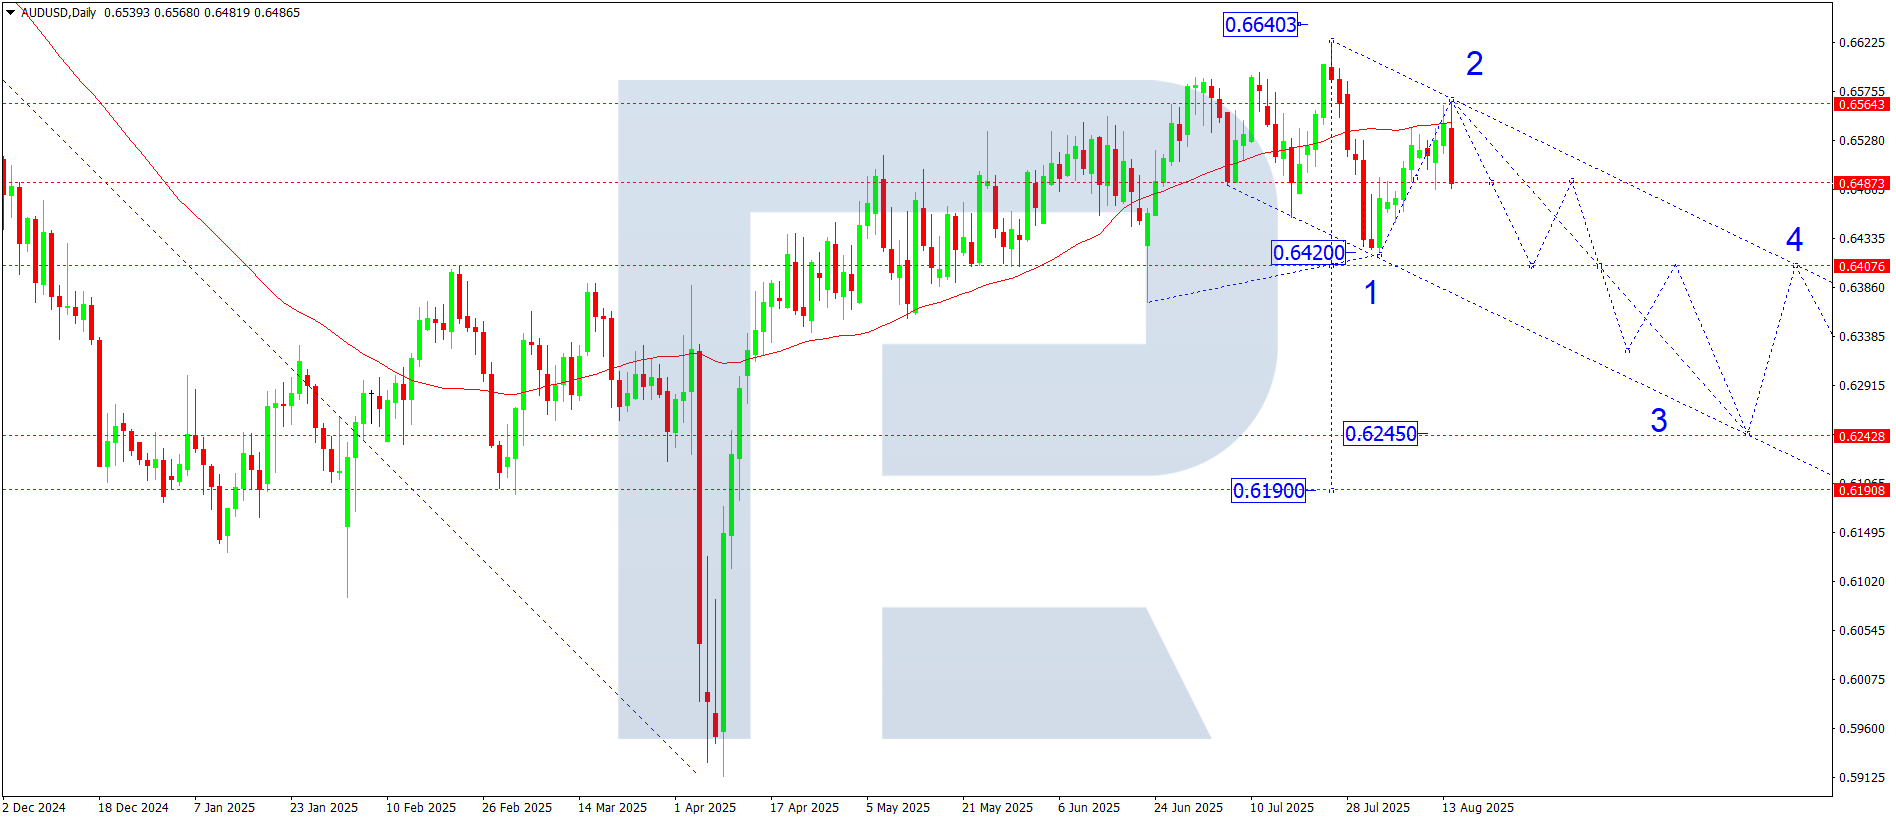
A wave structure is developing on the AUDUSD daily chart:
The first downward wave reached 0.6420.
The second corrective wave tested the 0.6564 level, where SMA50 provided resistance and pushed the price lower.
The weekly forecast suggests another downward wave towards 0.6400. A breakout below 0.6400 would open the door for the third wave down to 0.6245 as a local target. After reaching this level, the pair could form a corrective fourth wave with a rebound to 0.6400. Subsequently, the fifth downward wave may target 0.6277 with possible extension to 0.6190.
AUDUSD forecast scenarios
Bearish scenario (base):
Consolidation below 0.6500 confirms the end of the correction.
Downside targets:
- 0.6400 – intermediate target
- 0.6245 – third-wave target
- 0.6170 – main target of the larger first downward wave
Bullish scenario (alternative):
Consolidation above 0.6550 could push the pair higher towards 0.6670.
Further upside targets:
- 0.6670 – resistance/support area
- 0.6820 – local wave target
- 0.6969 – major target of the extended fifth wave
USDCAD forecast
The Canadian dollar remains pressured by the strong US dollar and oil market uncertainty. Geopolitical tensions after the Trump-Putin summit add to volatility risks. For the CAD, this means vulnerability if oil prices drop and investors turn to the US dollar as a safe-haven asset.
USDCAD technical analysis
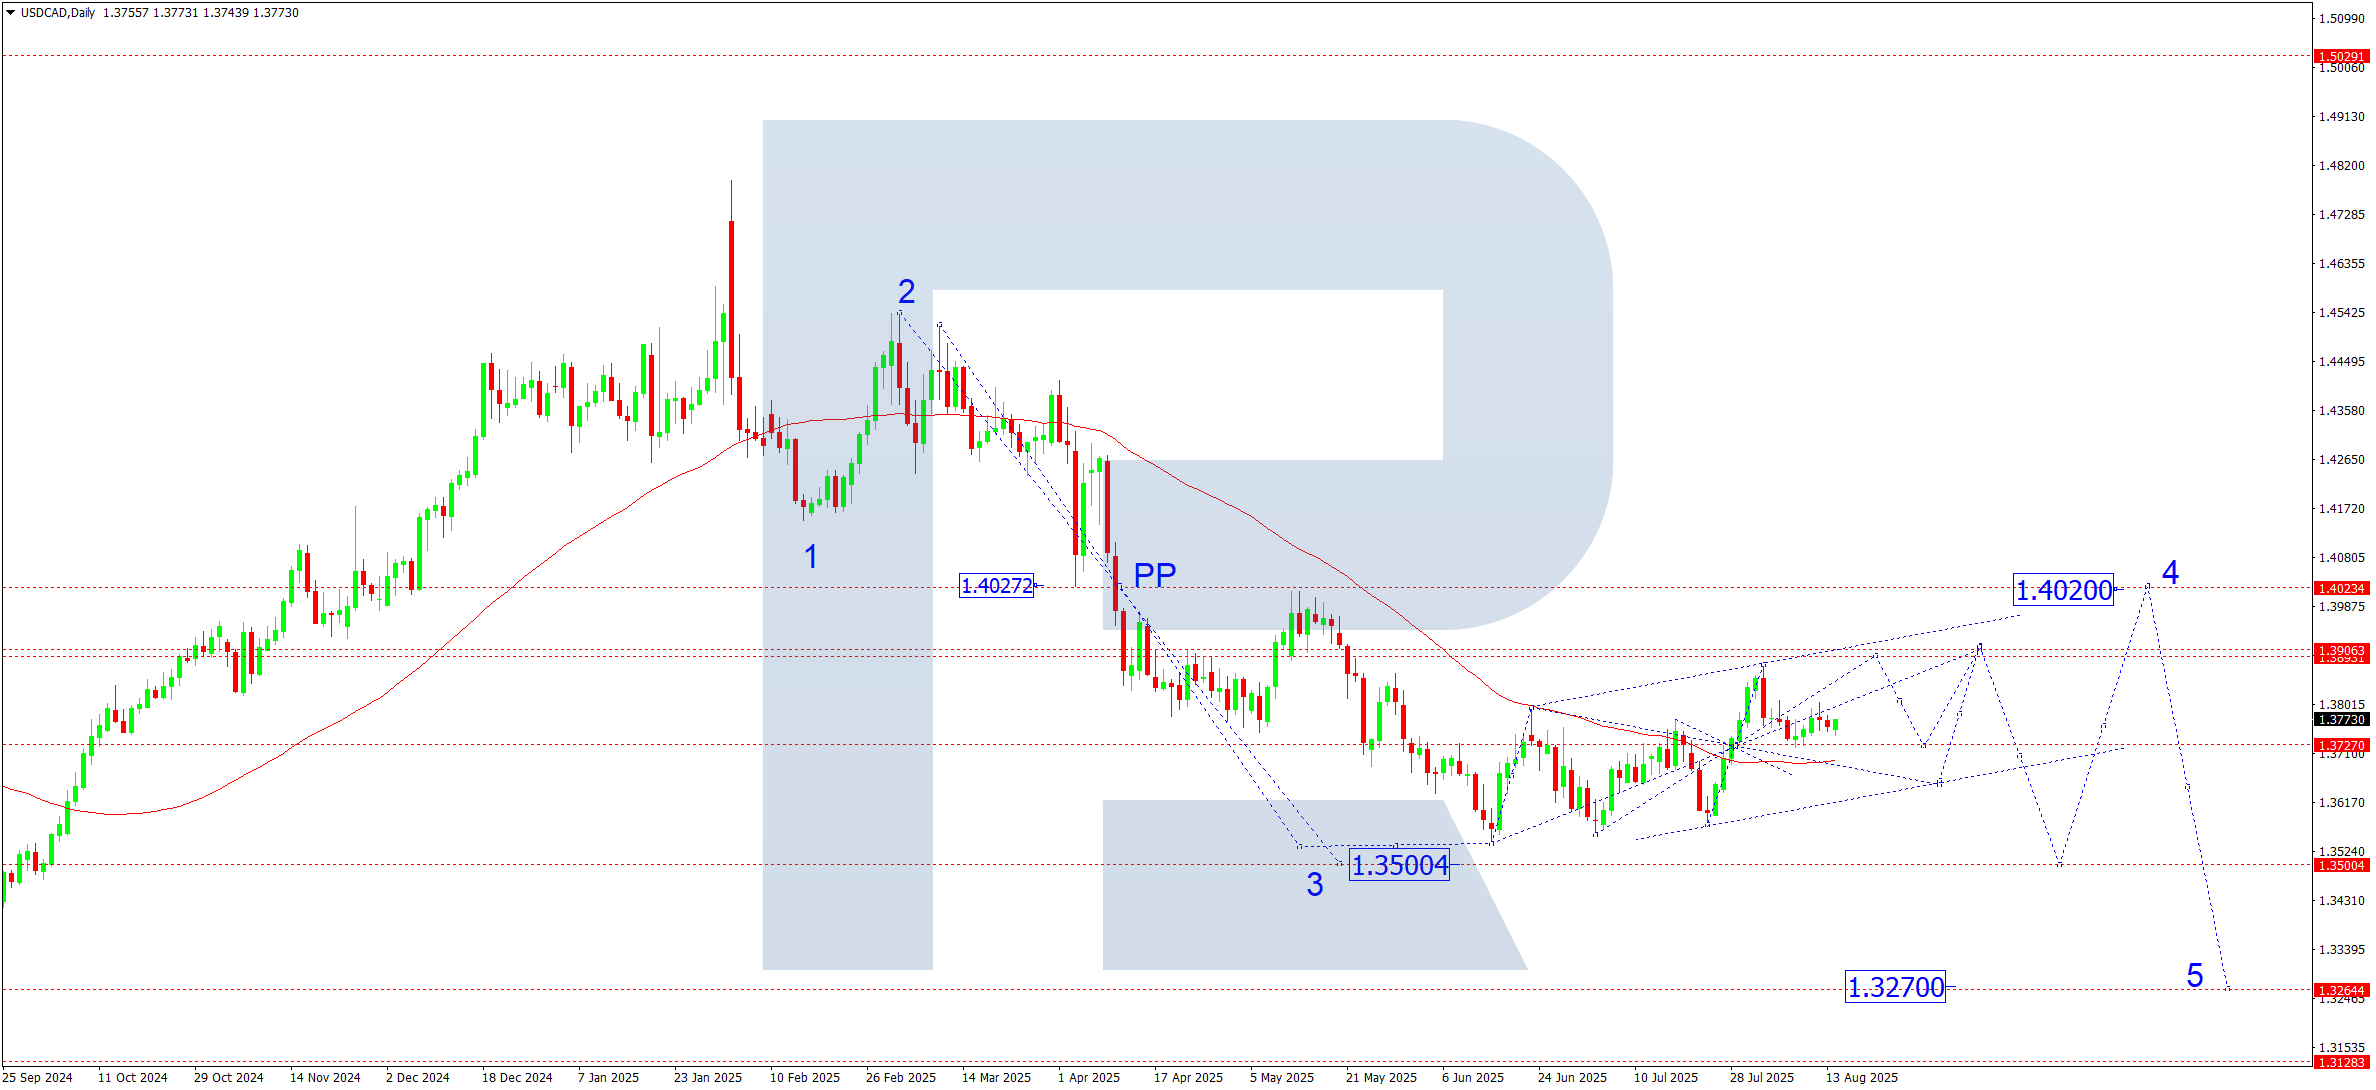
On the USDCAD daily chart:
- Support at 1.3727 confirmed the weekly pivot point
- The market continues a growth wave towards 1.3893
- A correction back to 1.3727 (testing from above) is possible
- Then, another growth structure may develop, aiming for 1.3917
This correction could extend towards 1.4020, followed by the fifth downward wave, targeting 1.3500 and lower. The broader picture remains neutral-to-bearish, with current growth seen as a correction within the dominant downtrend.
USDCAD forecast scenarios
Bullish scenario (base):
- Holding above 1.3700 and breaking above the 1.3800 level would open the potential for growth to 1.3920 as the main correction target
- After reaching it, the pair may resume its decline, aiming for 1.3270
Bearish scenario (alternative):
If the correction ends near 1.3900, this would add to selling pressure.
Downside targets:
- 1.3700 – first target
- 1.3600 – second target
- 1.3500 – main target (within the third wave from 1.4540)
XAUUSD forecast
The gold market remains sensitive to shifts in global safe-haven demand. After the Trump-Putin summit, volatility may rise depending on outcomes. If geopolitical risks increase, gold could gain short-term support, but US dollar strength and rising yields may counter this. Investors will be watching for Fed signals on rate policy and stock index movements reflecting risk appetite.
Any non-market signals, especially signs of de-escalation, could reduce gold’s safe-haven appeal. Trade and tariff risks remain a key reason for higher gold prices, with gold acting as a hedge against further restrictions or sanctions.
Federal Reserve policy: slowing inflation and weak labour data strengthen expectations of a September rate cut, which is favourable for gold.
XAUUSD technical analysis
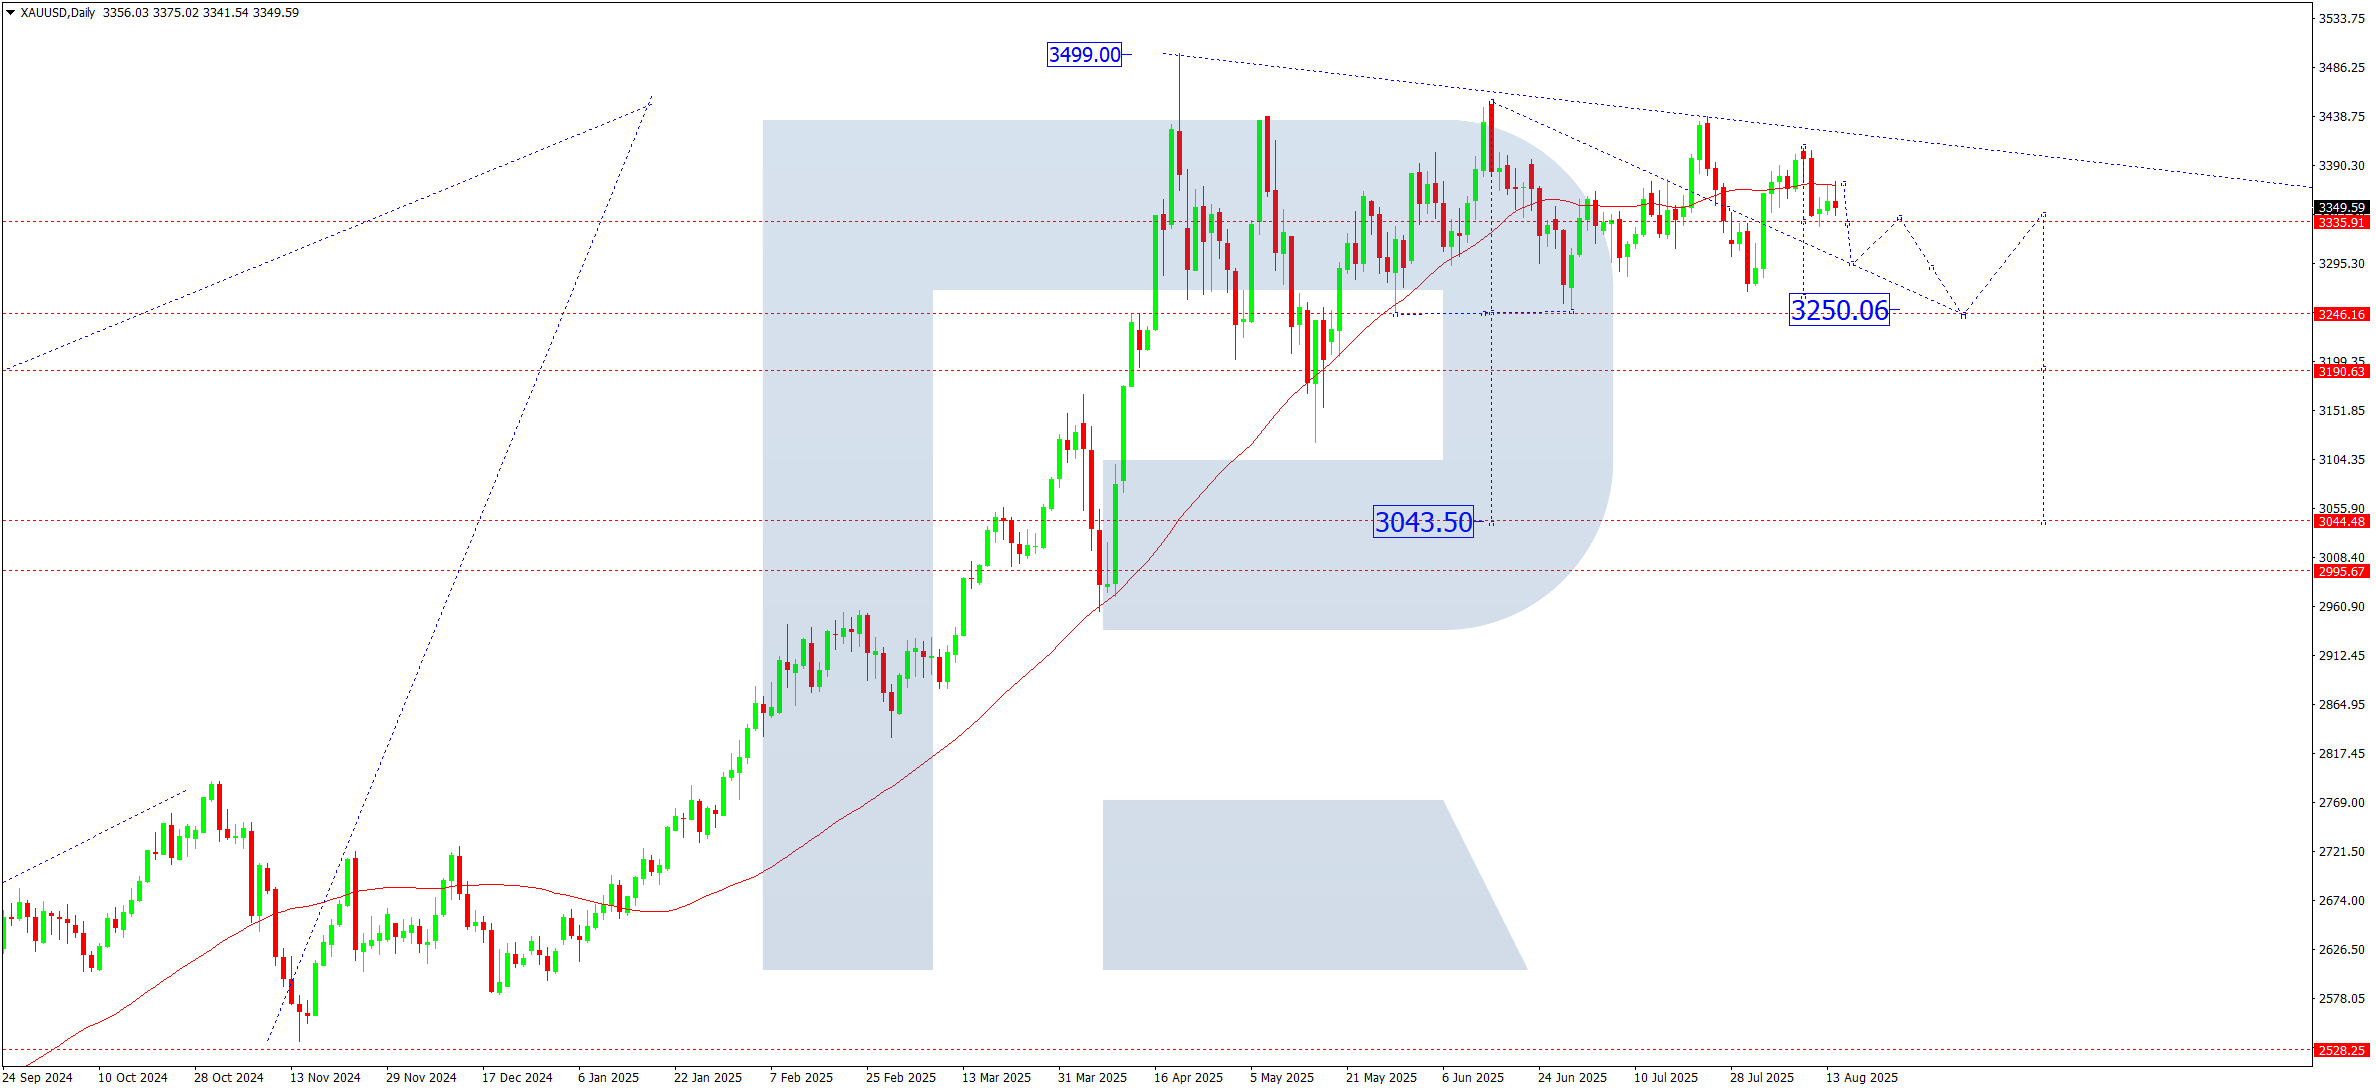
On the daily chart, gold rebounded from the 3,373 level, where SMA50 also lies. A symmetrical triangle is forming, usually a signal of an imminent major move.
Next week, a breakout below 3,320 is expected, confirming a reversal scenario with targets at 3,250-3,240 (the key support level).
A breakout below the 3,250 level would open the potential for a decline to 3,043, the first corrective wave target. After testing support levels, the pair could rebound to 3,350, but the overall bias remains bearish.
XAUUSD forecast scenarios
Bearish scenario (base):
A breakout and consolidation below 3,320 would open the way towards:
- 3,250 – intermediate support
- 3,050-3,040 – technical/fundamental correction zone
Bullish scenario (alternative):
Consolidation above 3,415 would pave the way towards:
- 3,500 – key May resistance level
- 3,535 – possible upper boundary of the extended fifth wave
Brent forecast
Geopolitical factors remain the key drivers for the oil market. The Trump-Putin summit (15 August, Anchorage) drew traders’ attention, as potential deals on Ukraine, sanctions, and tariffs could significantly impact energy markets.
Trump previously suggested 500% tariffs on countries buying Russian oil, potentially cutting global supply and supporting prices. However, compromise or softened rhetoric could have the opposite effect.
China and US data point to moderate oil demand growth. OPEC+ forecasts still expect a supply deficit in the second half of 2025, supporting a bullish scenario.
While US dollar strength could put short-term pressure on oil, fundamentals remain supportive thanks to limited supply and political risks.
Brent technical analysis
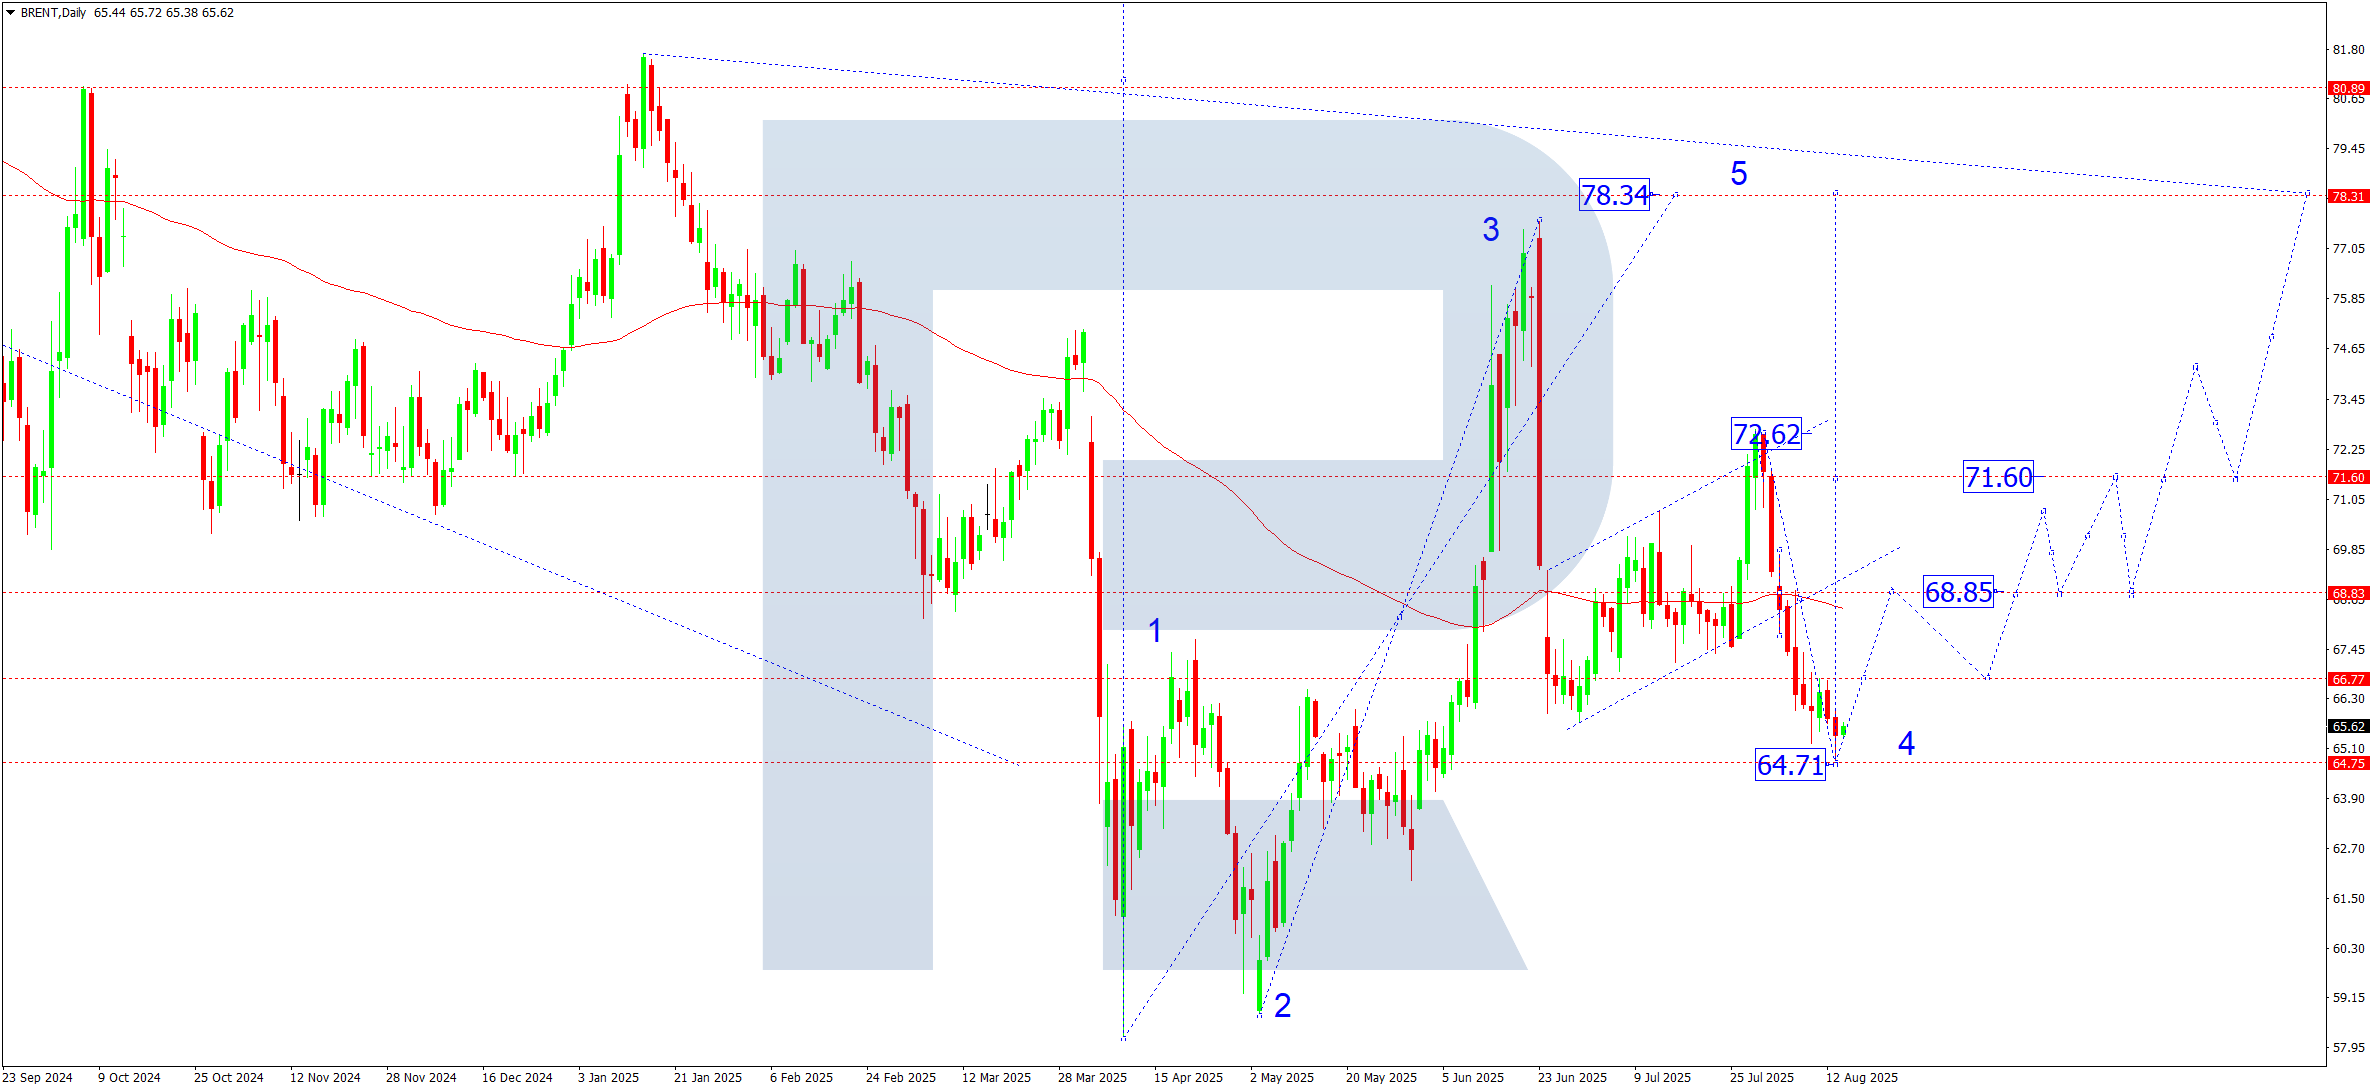
On the daily chart, Brent rebounded from SMA50 near 68.50 and dropped to 64.71.
Next week, prices are expected to return towards 68.85, with potential to develop a fifth growth wave targeting 78.34 (the first main upside target). After reaching the 78.34 level, a correction towards 71.60 may follow.
Brent forecast scenarios
Bullish scenario (base):
Support at 64.71 confirms the uptrend.
Upside targets:
- 68.85 – intermediate target
- 71.60 – first trend target
- 74.22 – local target
- 78.34 – main target in the fifth wave
Bearish scenario (alternative):
A breakout below the 64.00 level and consolidation lower may continue the correction.
- Downside target: 60.00
Forecasts presented in this section only reflect the author’s private opinion and should not be considered as guidance for trading. RoboForex bears no responsibility for trading results based on trading recommendations described in these analytical reviews.