Weekly technical analysis and forecast (14-18 July 2025)
This weekly technical analysis highlights the key chart patterns and levels for EURUSD, USDJPY, GBPUSD, AUDUSD, USDCAD, gold (XAUUSD), and Brent crude oil to forecast market moves for the upcoming week (14-18 July 2025).
Major technical levels to watch this week
- EURUSD: Support: 1.1640-1.1430. Resistance: 1.1737-1.1880
- USDJPY: Support: 145.50-140.00. Resistance: 148.00-151.00
- GBPUSD: Support: 1.3440-1.3120. Resistance: 1.3660-1.4000
- AUDUSD: Support: 0.6550-0.6370. Resistance: 0.6674-0.6969
- USDCAD: Support: 1.3500-1.3250. Resistance: 1.3750-1.4000
- Gold: Support: 3,325-3,250. Resistance: 3,390-3,535
- Brent: Support: 69.90-68.50. Resistance: 71.30-73.40
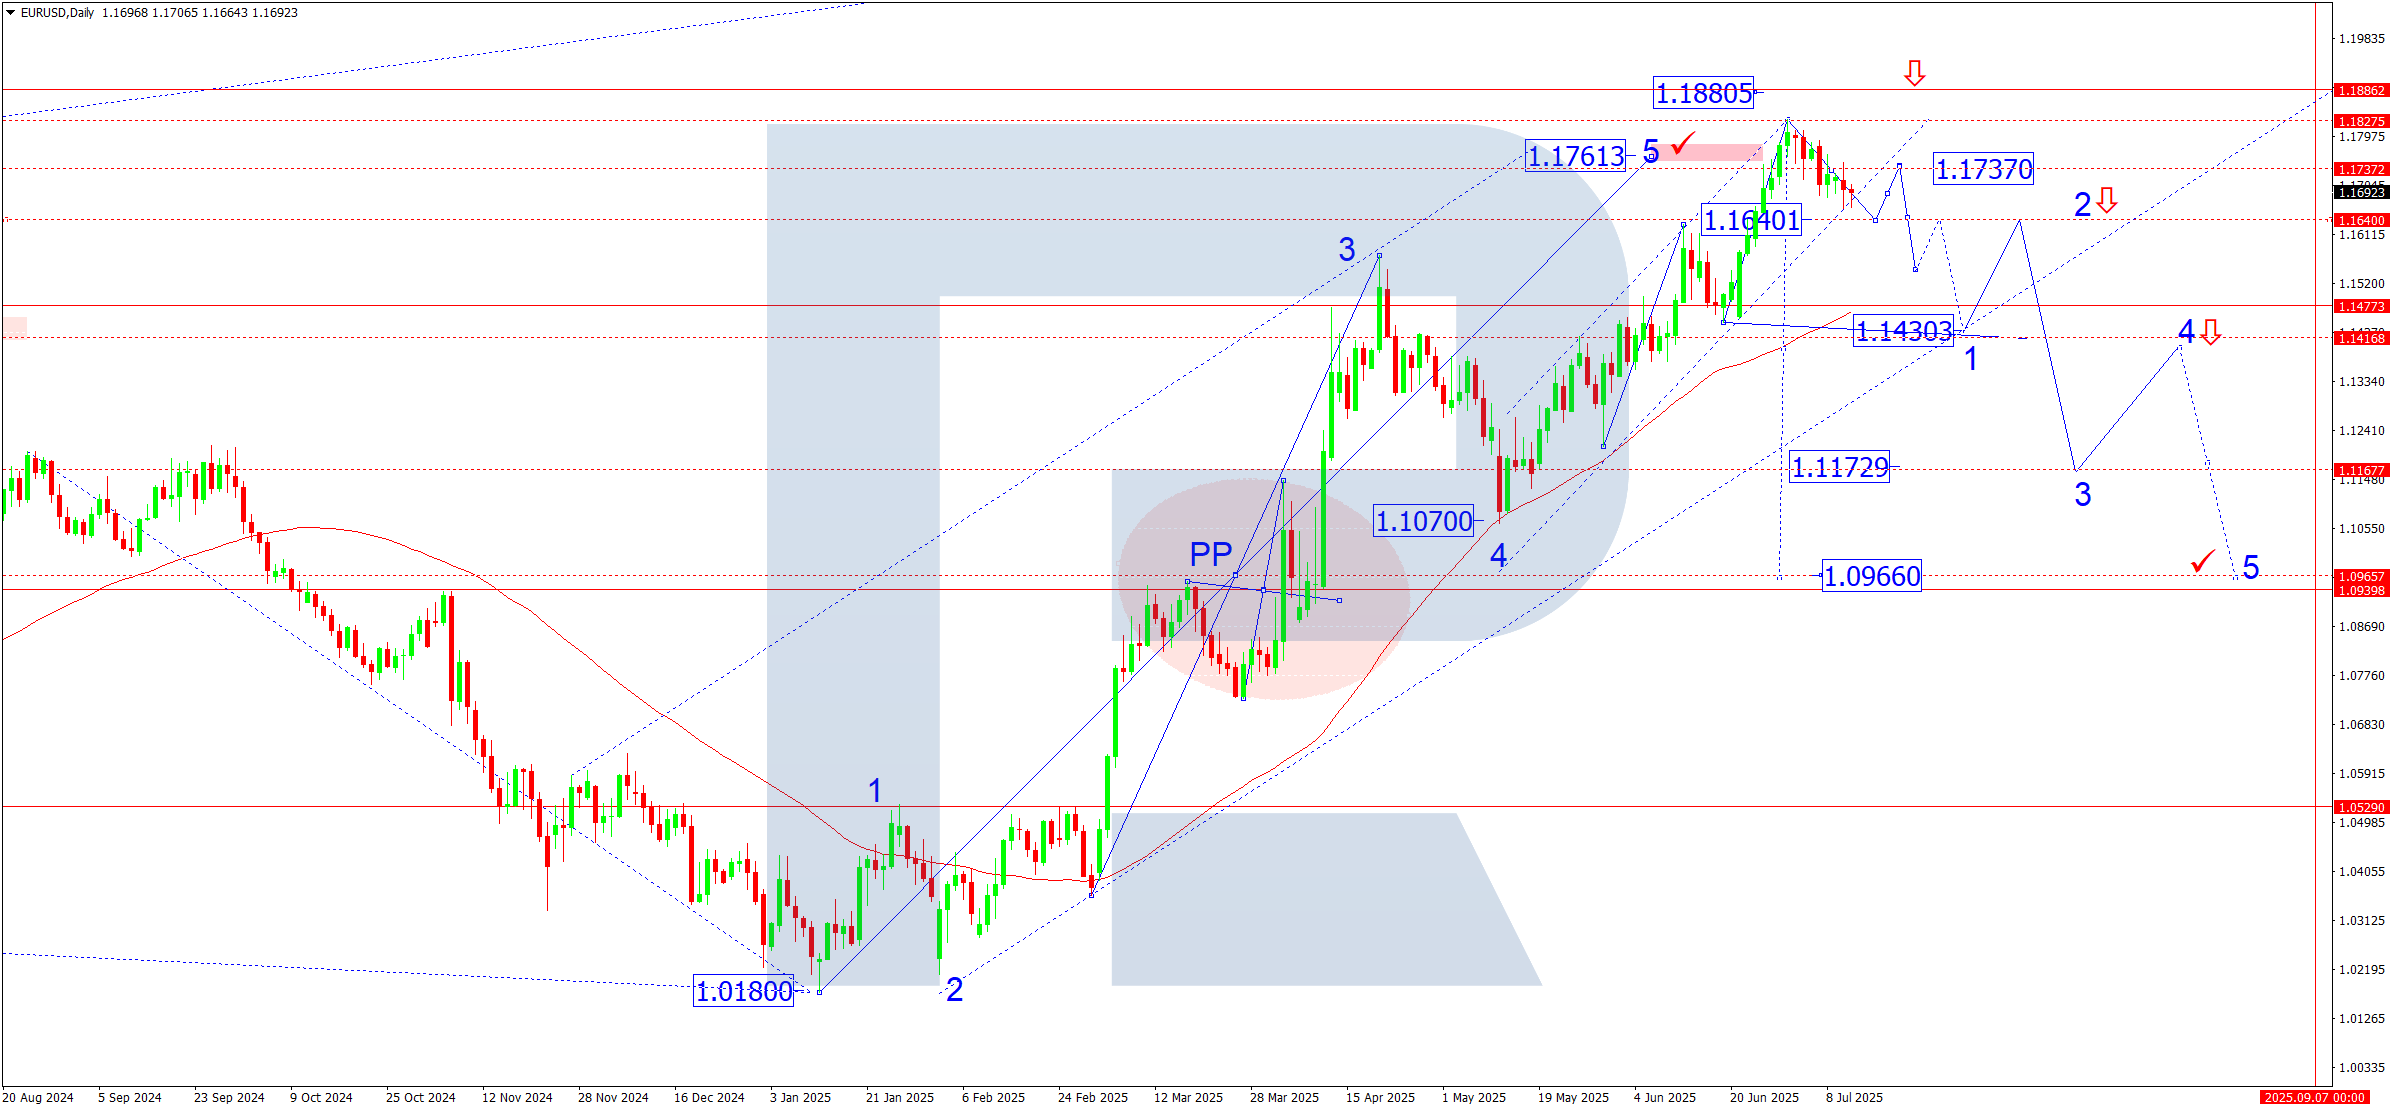
EURUSD forecast
Weekly EURUSD outlook for 14-18 July 2025:
EURUSD ends the first half of July under mixed influences.
The ECB confirmed a cautious path towards rate cuts in June. Although headline inflation dropped to 2.0%, core inflation remains near 2.6%, forcing the ECB to strike a delicate balance between stimulus and restraint. European and US equity markets show correctional tendencies. Investors hedge in gold and USD, creating conflicting pressure on EURUSD.
Ongoing geopolitical tension in the Middle East and Eastern Europe continues to fuel USD demand. Fundamentally, the outlook remains moderately neutral, with a slight short-term bias in favour of the US dollar. The biggest uncertainty lies in the Fed's mid-July rhetoric and the ECB’s end-of-month meeting.
Technical analysis:
On the daily chart, EURUSD completed a fifth upward wave, reaching 1.1829. A correction began from there. The current impulse aims for 1.1640, potentially marking the end of the first corrective wave (1). An upward wave (2) to 1.1737 may follow, where consolidation is likely.
If the market breaks below the 1.1640-1.1737 range, a new downward wave may begin:
- Wave 1 target: 1.1430 (50% Fibonacci retracement from 1.1070-1.1829); the SMA50 may offer support near 1.1440
- Wave 3 target: 1.1173
- Wave 5 target: 1.0966 (50% retracement from 1.0180-1.1829)
A breakout above 1.1737 could trigger an extension to 1.1880, the next projected high for the current wave.
Forecast scenarios (14-18 July):
Bearish (base) scenario: a breakout below 1.1640 could lead to a dip to 1.1550 (local target), followed by 1.1440 as the primary downside target and the first target.
Bullish scenario: if the 1.1640 level holds and buying volume grows, a breakout above 1.1737 may spark another upward move towards 1.1850, possibly stretching to 1.1880.
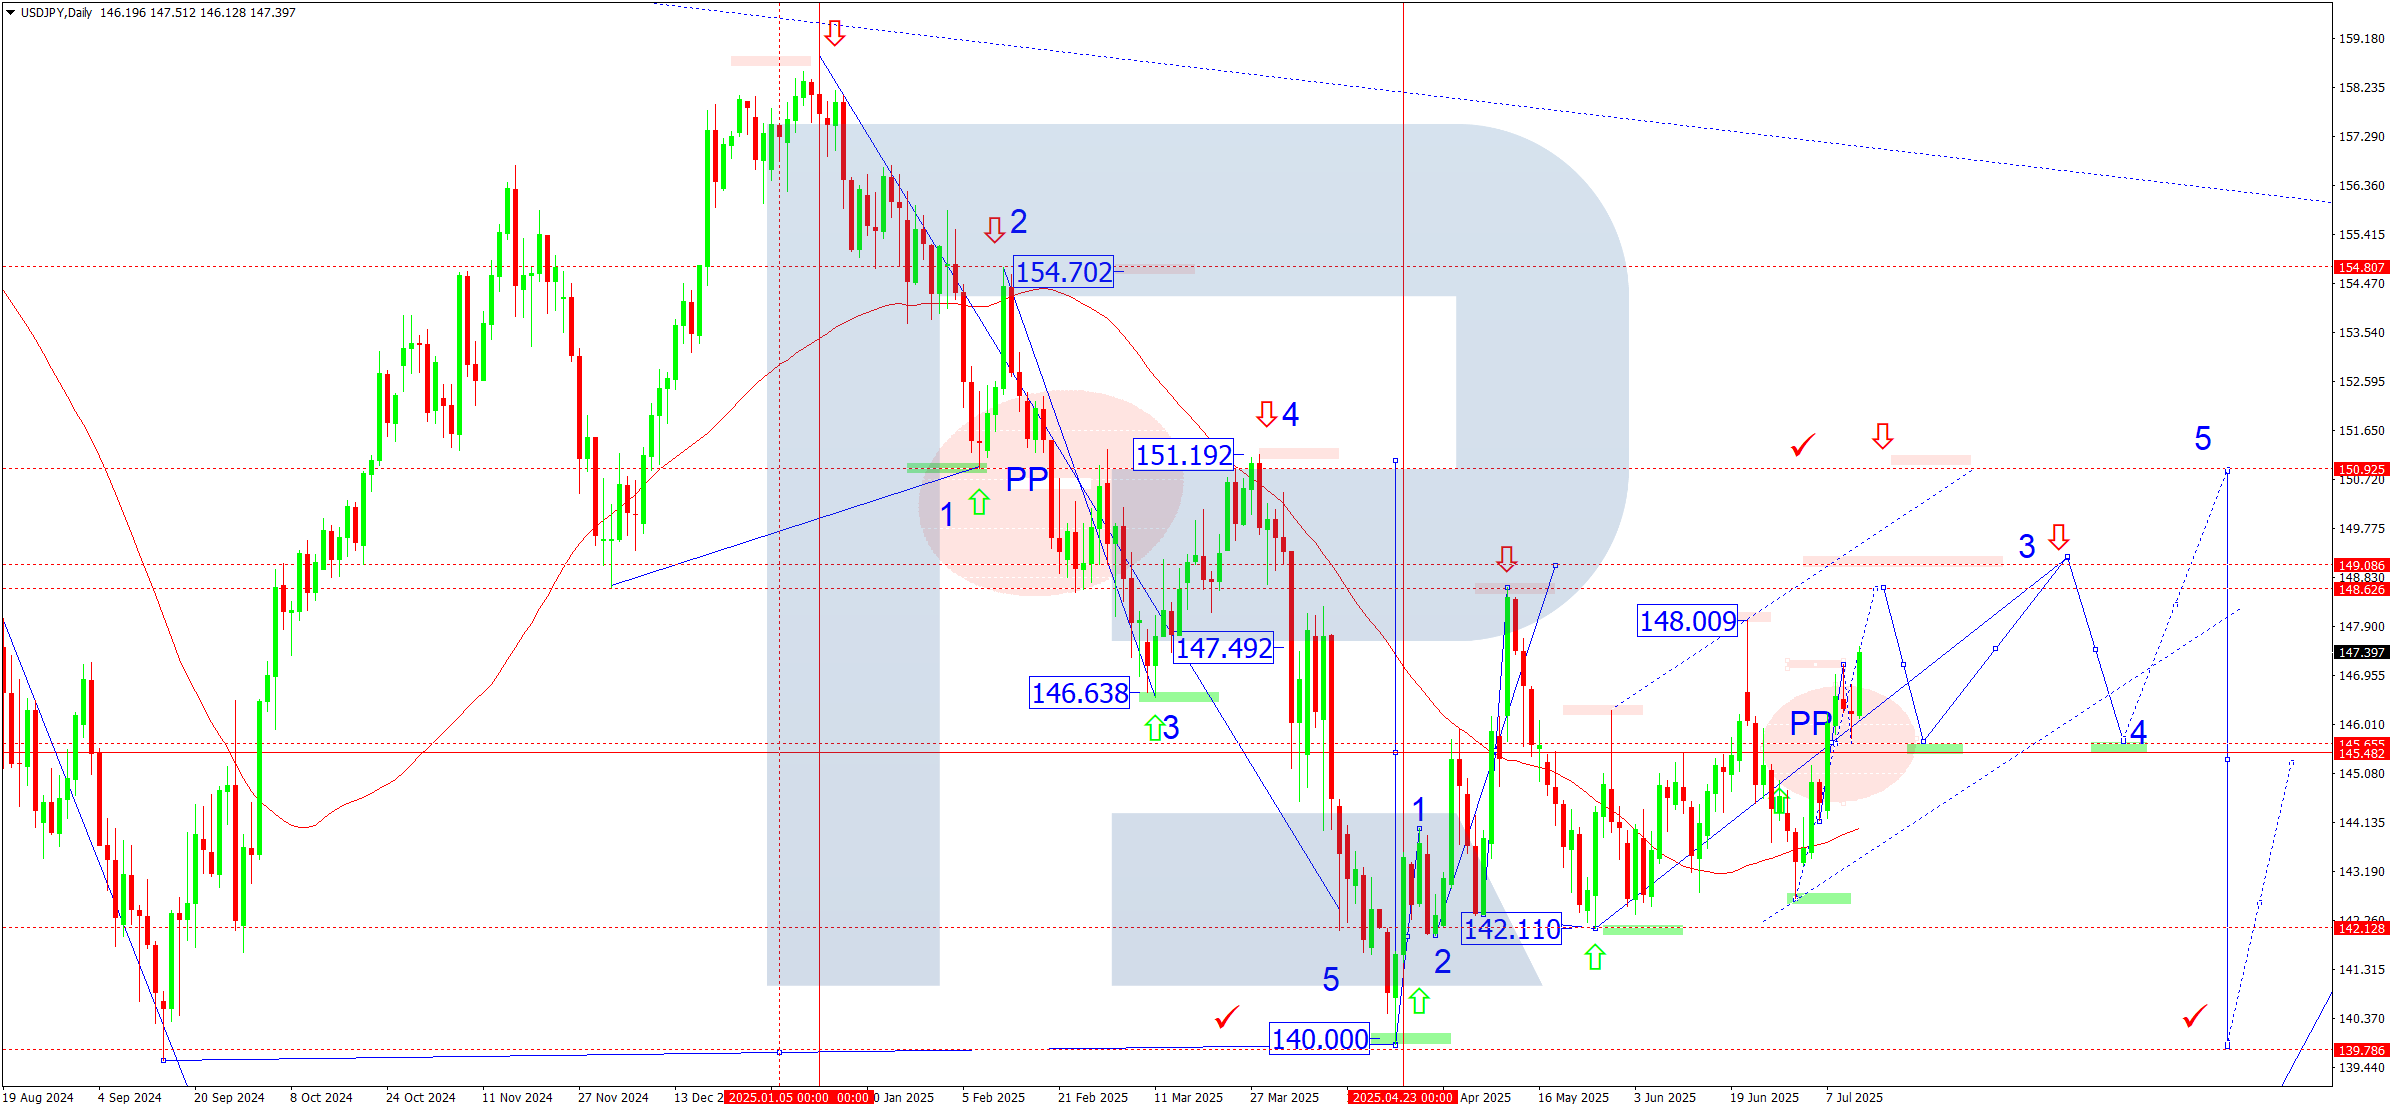
USDJPY forecast
Weekly USDJPY outlook for 14-18 July 2025
USDJPY continues to strengthen amid broad FX market volatility. The yen remains pressured by diverging monetary policy. The Bank of Japan maintains an ultra-loose stance, while the Federal Reserve holds interest rates high, enhancing USD attractiveness.
Additional pressure on the yen came from recent inflation slowdown in Japan, which lowered prospects for policy tightening. Meanwhile, robust US economic data, strong labour market and inflation expectations support the US dollar.
However, market participants also take into account rising geopolitical tensions in Asia and potential Japanese currency interventions if USDJPY nears sensitive levels such as 150 or higher.
Technical analysis:
On the daily chart, the USDJPY pair broke above 145.50 and consolidated above it, setting it as the new pivot point.
The third growth wave develops with local targets at 148.00-149.00, followed by a potential correction towards 145.50. This rise fits a correction to the downtrend from the 158.80 peak. The 50% Fibonacci recovery target is at 151.00.
The SMA50 lies below the price, reinforcing bullish momentum.
Forecast scenarios:
Bullish scenario: with the 145.50 support level holding and the 147.00 mark breached, the next targets are:
- 148.00
- 149.00
- 151.00 (January 2025 high and key Fibonacci resistance)
Bearish scenario: a breakout below 145.00 would invalidate the bullish scenario, triggering a return to consolidation, targeting:
- 144.00 (intermediate support)
- 142.00 (range boundary)
- 140.00 (Matrix-based structure target)
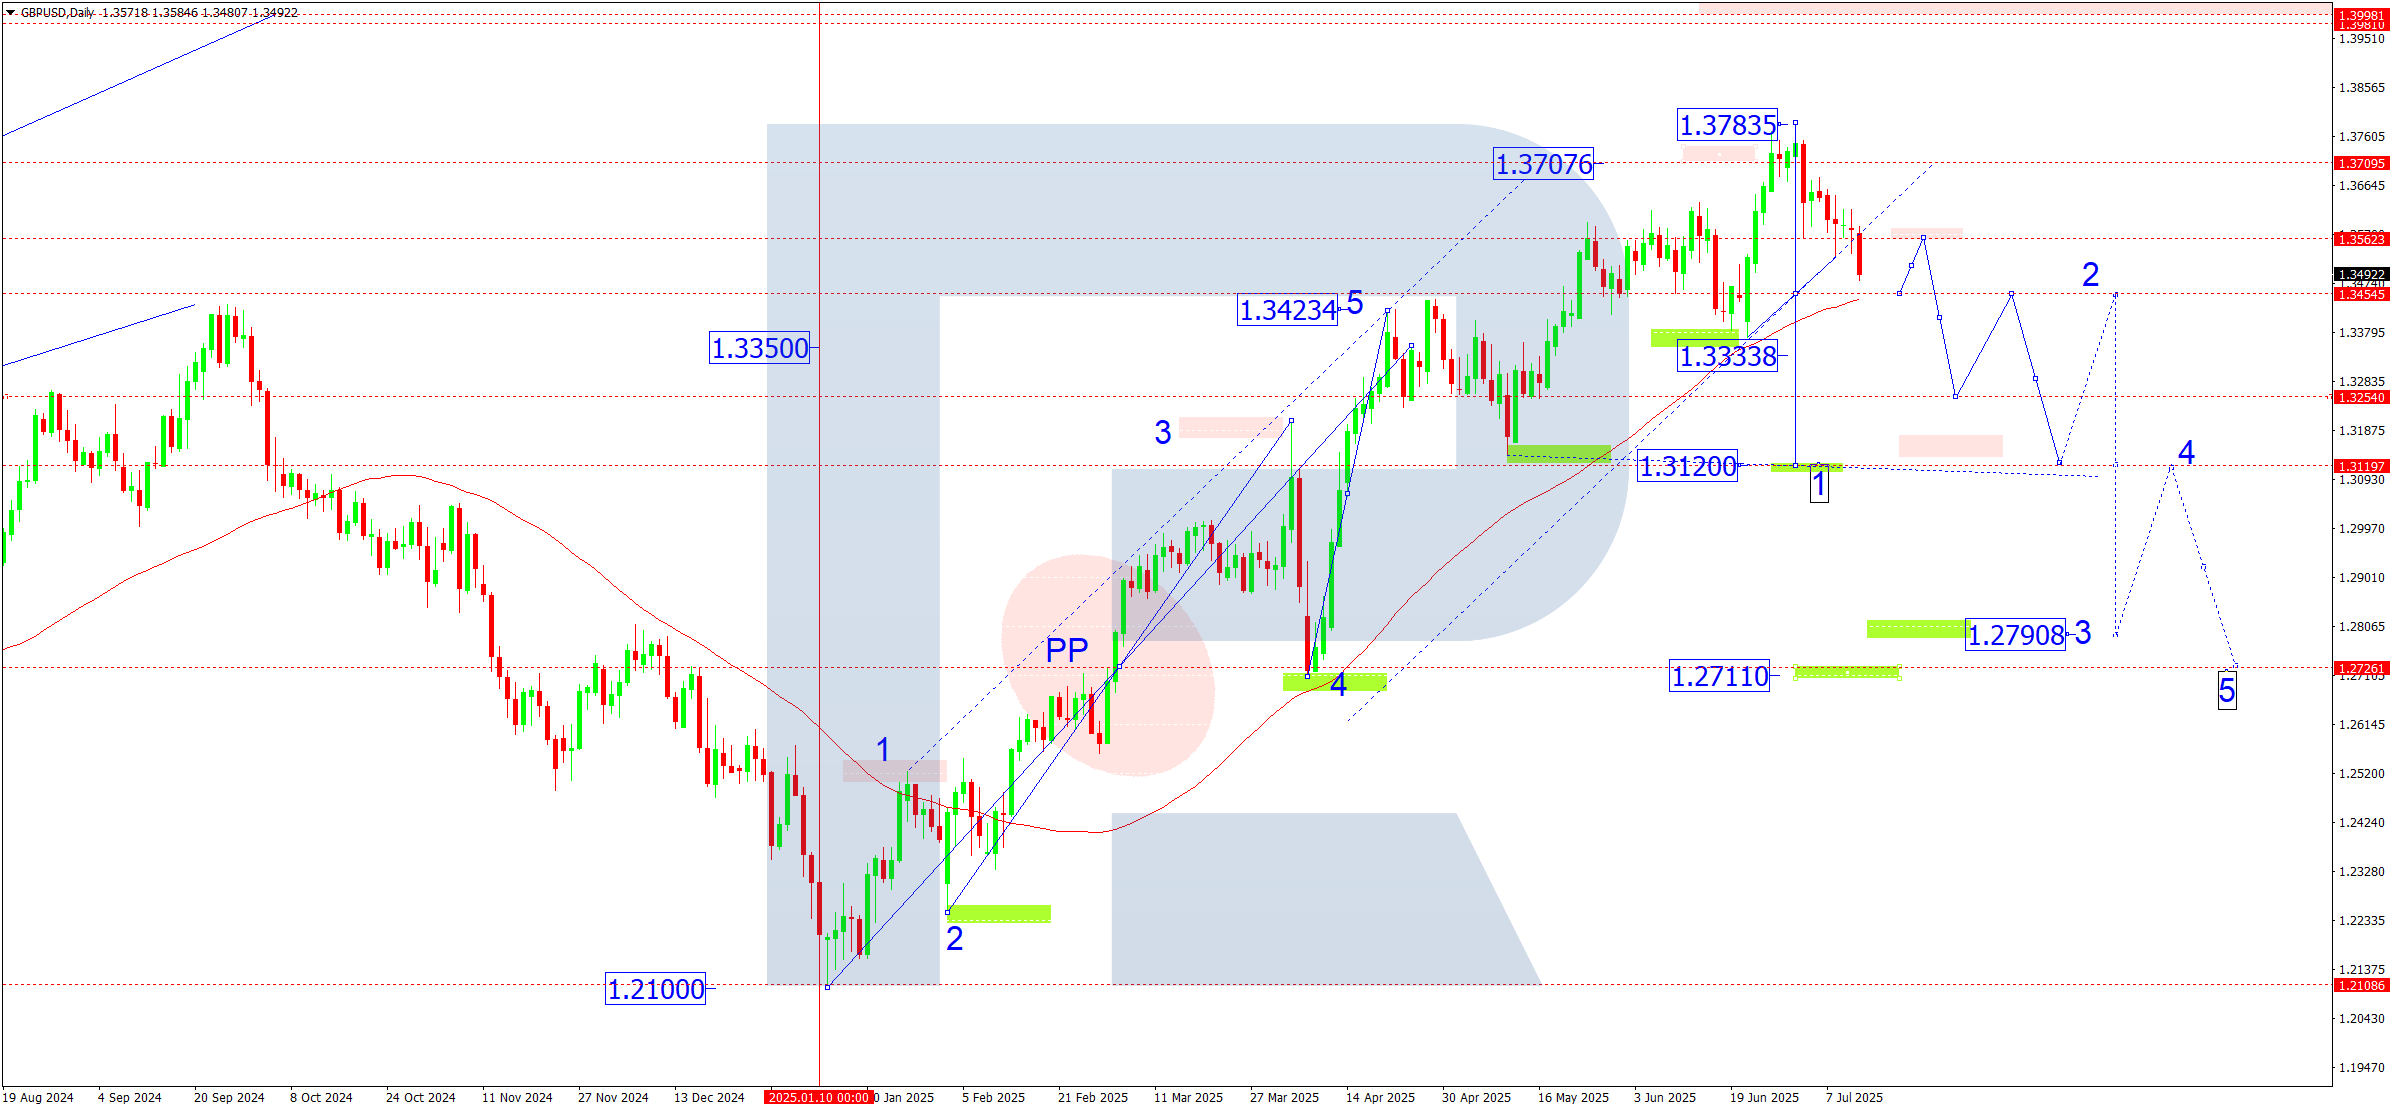
GBPUSD forecast
Weekly GBPUSD outlook for 14-18 July 2025:
GBP reacts to two key drivers: Bank of England policy and USD demand. The latest UK inflation data shows a slowdown, increasing odds of a BoE pause or softer tone. However, the labour market remains strong, limiting room for deep rate cuts.
The USD gains support from hawkish Fed statements, despite signs of slower economic growth. High US interest rates continue to weigh on currencies with looser policies, including the pound. Geopolitical risks and escalating tensions in Eastern Europe also drive demand for USD as a safe-haven asset.
Investors are keeping a close eye on the upcoming UK GDP, retail sales, and US CPI data that could determine the pair's short-term direction.
Technical analysis:
On the daily chart, GBPUSD completed a five-wave rise from the January low of 1.2100, peaking near 1.3780. The current pullback signals a correction phase. The weekly pivot point shifted to 1.3440, a key area of buyer–seller interest.
A breakout below 1.3650 confirmed the end of the bullish phase and opened the way to 1.3440. Short-term stabilisation and possible rebound are expected here. If this level breaks, a full downward wave may unfold targeting 1.3250 and 1.3120.
The SMA50 remains near 1.3440 and could act as support. However, only a recovery above 1.3560 and a breakout above 1.3660 would resume the uptrend, with targets at 1.3800 and 1.4000, a psychologically important level.
Forecast scenarios:
Bearish scenario: a breakout and consolidation below 1.3440 confirms a downward structure, with targets at:
- 1.3250 (local wave target)
- 1.3120 (range bottom)
- 1.2711 (pivot point of the earlier upward wave from 1.2100)
Bullish scenario: staying above the SMA50 and breaking above 1.3660 would open the way to:
- 1.3800, the nearest resistance level
- 1.4000, a key level, where profit-taking is possible
- 1.4160 (if the momentum strengthens)
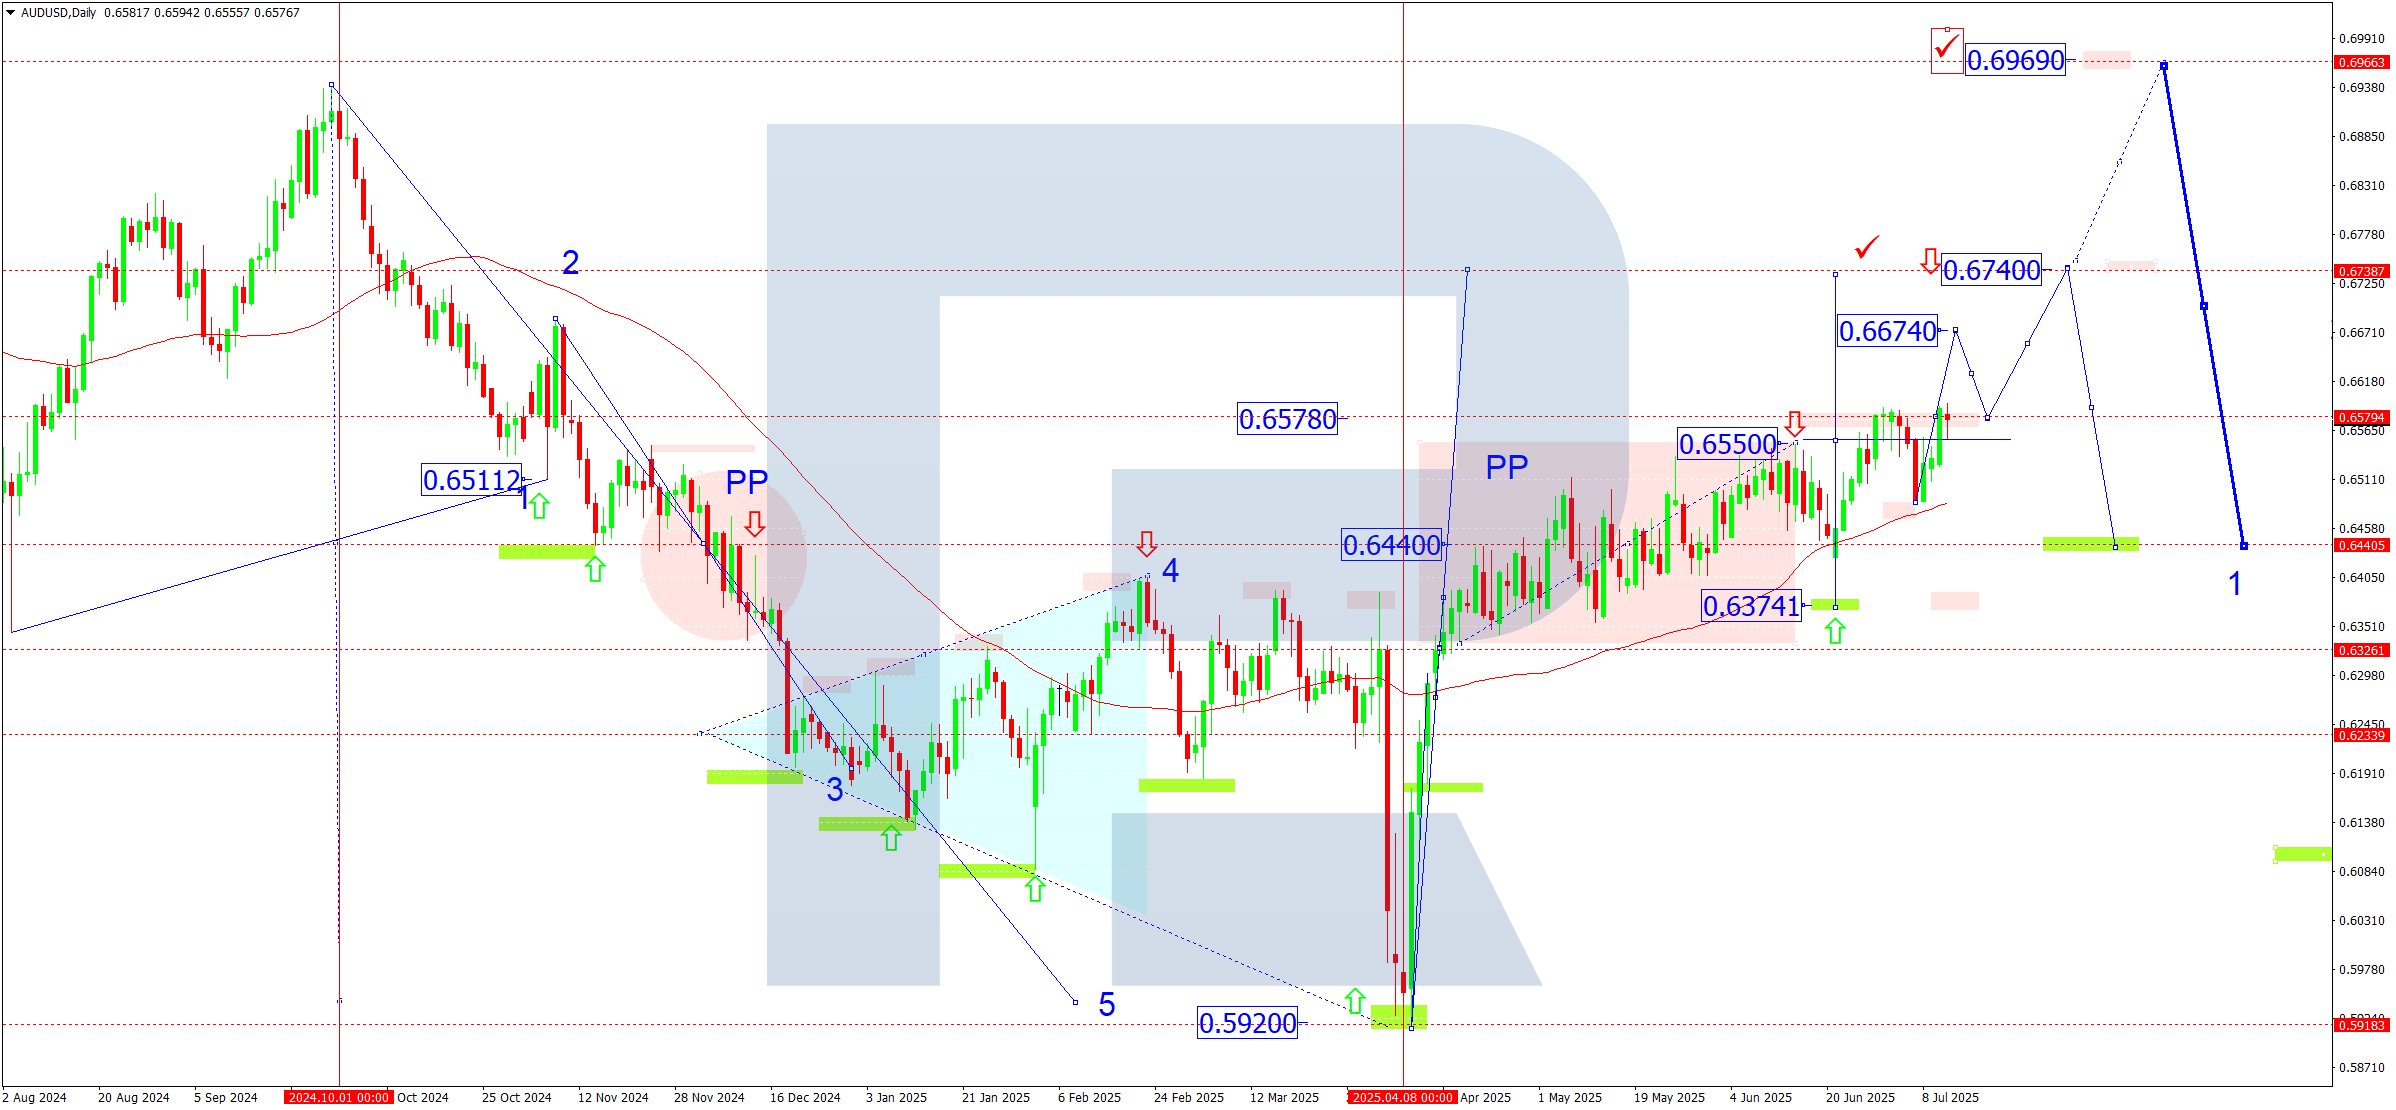
AUDUSD forecast
Weekly AUDUSD outlook for 14-18 July 2025
The Australian dollar continues to balance between domestic economic conditions and global risk factors. Demand for commodities, especially iron ore and copper, has picked up, supporting the rate amid signs of stabilisation in China's economy and stimulus from Beijing. Since China remains Australia’s key trading partner, any signal of recovery from the Chinese economy directly supports AUD.
On the flip side, concerns about global economic slowdown, commodity market volatility, and the US Fed’s tightening policy continue to weigh on commodity-linked currencies. The Reserve Bank of Australia (RBA) maintains a moderate tone and is unlikely to opt for aggressive tightening. This keeps the interest rate differential in favour of the US dollar.
Upcoming data on China’s GDP, trade performance, and US inflation reports will be key catalysts for AUDUSD this week.
Technical analysis:
The daily chart shows that AUDUSD has exited a consolidation phase that ranged between 0.6370 and 0.6550. The breakout above 0.6550 confirmed the end of sideways movement and triggered a move towards 0.6674, followed by 0.6740.
The weekly pivot point (PP) lies at 0.6550, which previously acted as resistance and now serves as support. This level is also reinforced by the SMA50, adding technical significance.
If the price holds above 0.6550, the bullish structure could extend towards 0.6969, a key long-term target, aligning with the structure of an extended fifth growth wave.
However, if demand weakens and the price falls below 0.6440, the asset may return to a broader range with risks of decline towards 0.6370 and 0.6320.
Forecast scenarios:
Bearish scenario:
- A breakout below 0.6440 would suggest the current wave of growth has ended
- The next downside targets are the local support level at 0.6374 and then 0.6323
- If bearish pressure increases, a drop to 0.6200 may occur in the medium term
Bullish scenario:
- Holding above 0.6550 and consolidating above 0.6580 will confirm further upward momentum
- Growth targets: local resistance level at 0.6674 and 0.6740 as the next milestone
- In a high-volatility environment with rising demand for commodities, AUDUSD may reach 0.6969 in July
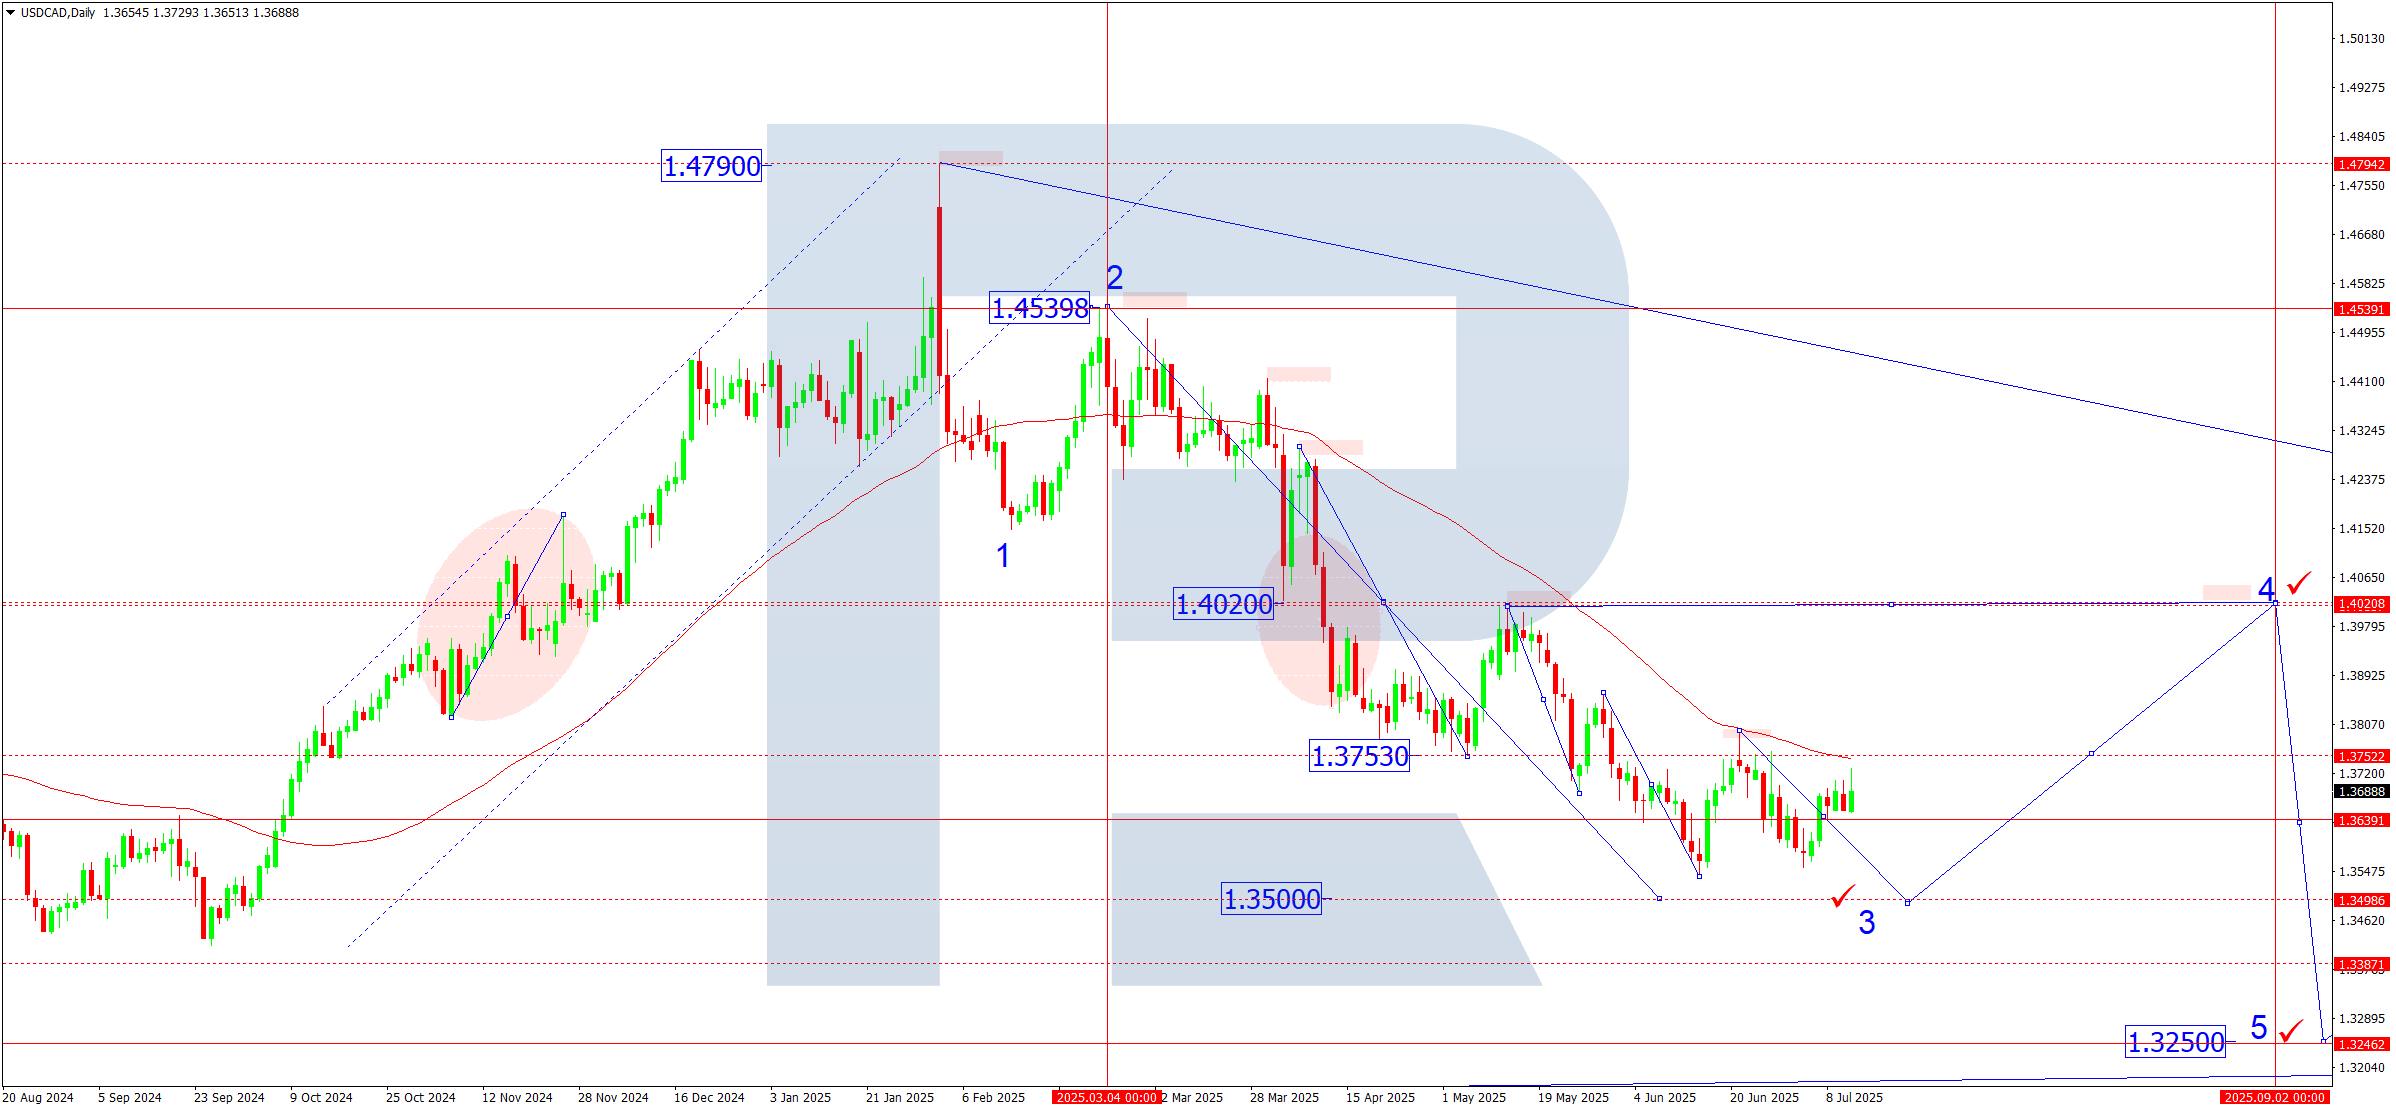
USDCAD forecast
Weekly USDCAD outlook for 14-18 July 2025
USDCAD continues to trade under the influence of conflicting drivers. Strong US labour market data and the Fed’s hawkish tone support the US dollar. However, rising oil prices (a key Canadian export) and stabilisation in Canada’s economy are capping the pair’s upside. The Bank of Canada maintains a moderately cautious stance, offering no clear signal on further rate hikes. This, combined with global inflation expectations and commodity market volatility, creates a complex environment for long-term direction. This week’s focus will be on US and Canadian inflation data and oil price movements, which traditionally impact the Canadian dollar.
Technical analysis:
The daily chart shows a downtrend structure, with USDCAD in the final stages of a third wave of decline from the 1.4539 peak. A bounce from 1.3790 followed by a pullback confirms bearish control.
The price has stabilised in the 1.3650-1.3720 range, but pressure on the 1.3500 support level remains – a key horizontal and psychological level. If broken, a drop towards the 1.3250 target is likely, completing the fifth wave of the current structure.
Still, a short-term correction may develop. If a local bottom forms at 1.3500, the market may test resistance between 1.3900 and 1.4020, the origin of the last bearish impulse.
Forecast scenarios:
Bearish scenario:
- A breakout below 1.3650 and consolidation below this level will increase downside pressure
Downside targets:
- 1.3500, a key support level
- 1.3380, an interim level
- 1.3250, the final wave 5 target on a long-term level
Bullish scenario:
- A breakout above 1.3750 and consolidation above the SMA50 (1.3790) would indicate the end of the current decline and the start of a correction
Upside potential:
- 1.3900, the first retracement target
- 1.4020, a key resistance level and retest of the downtrend line. This is the primary correction target
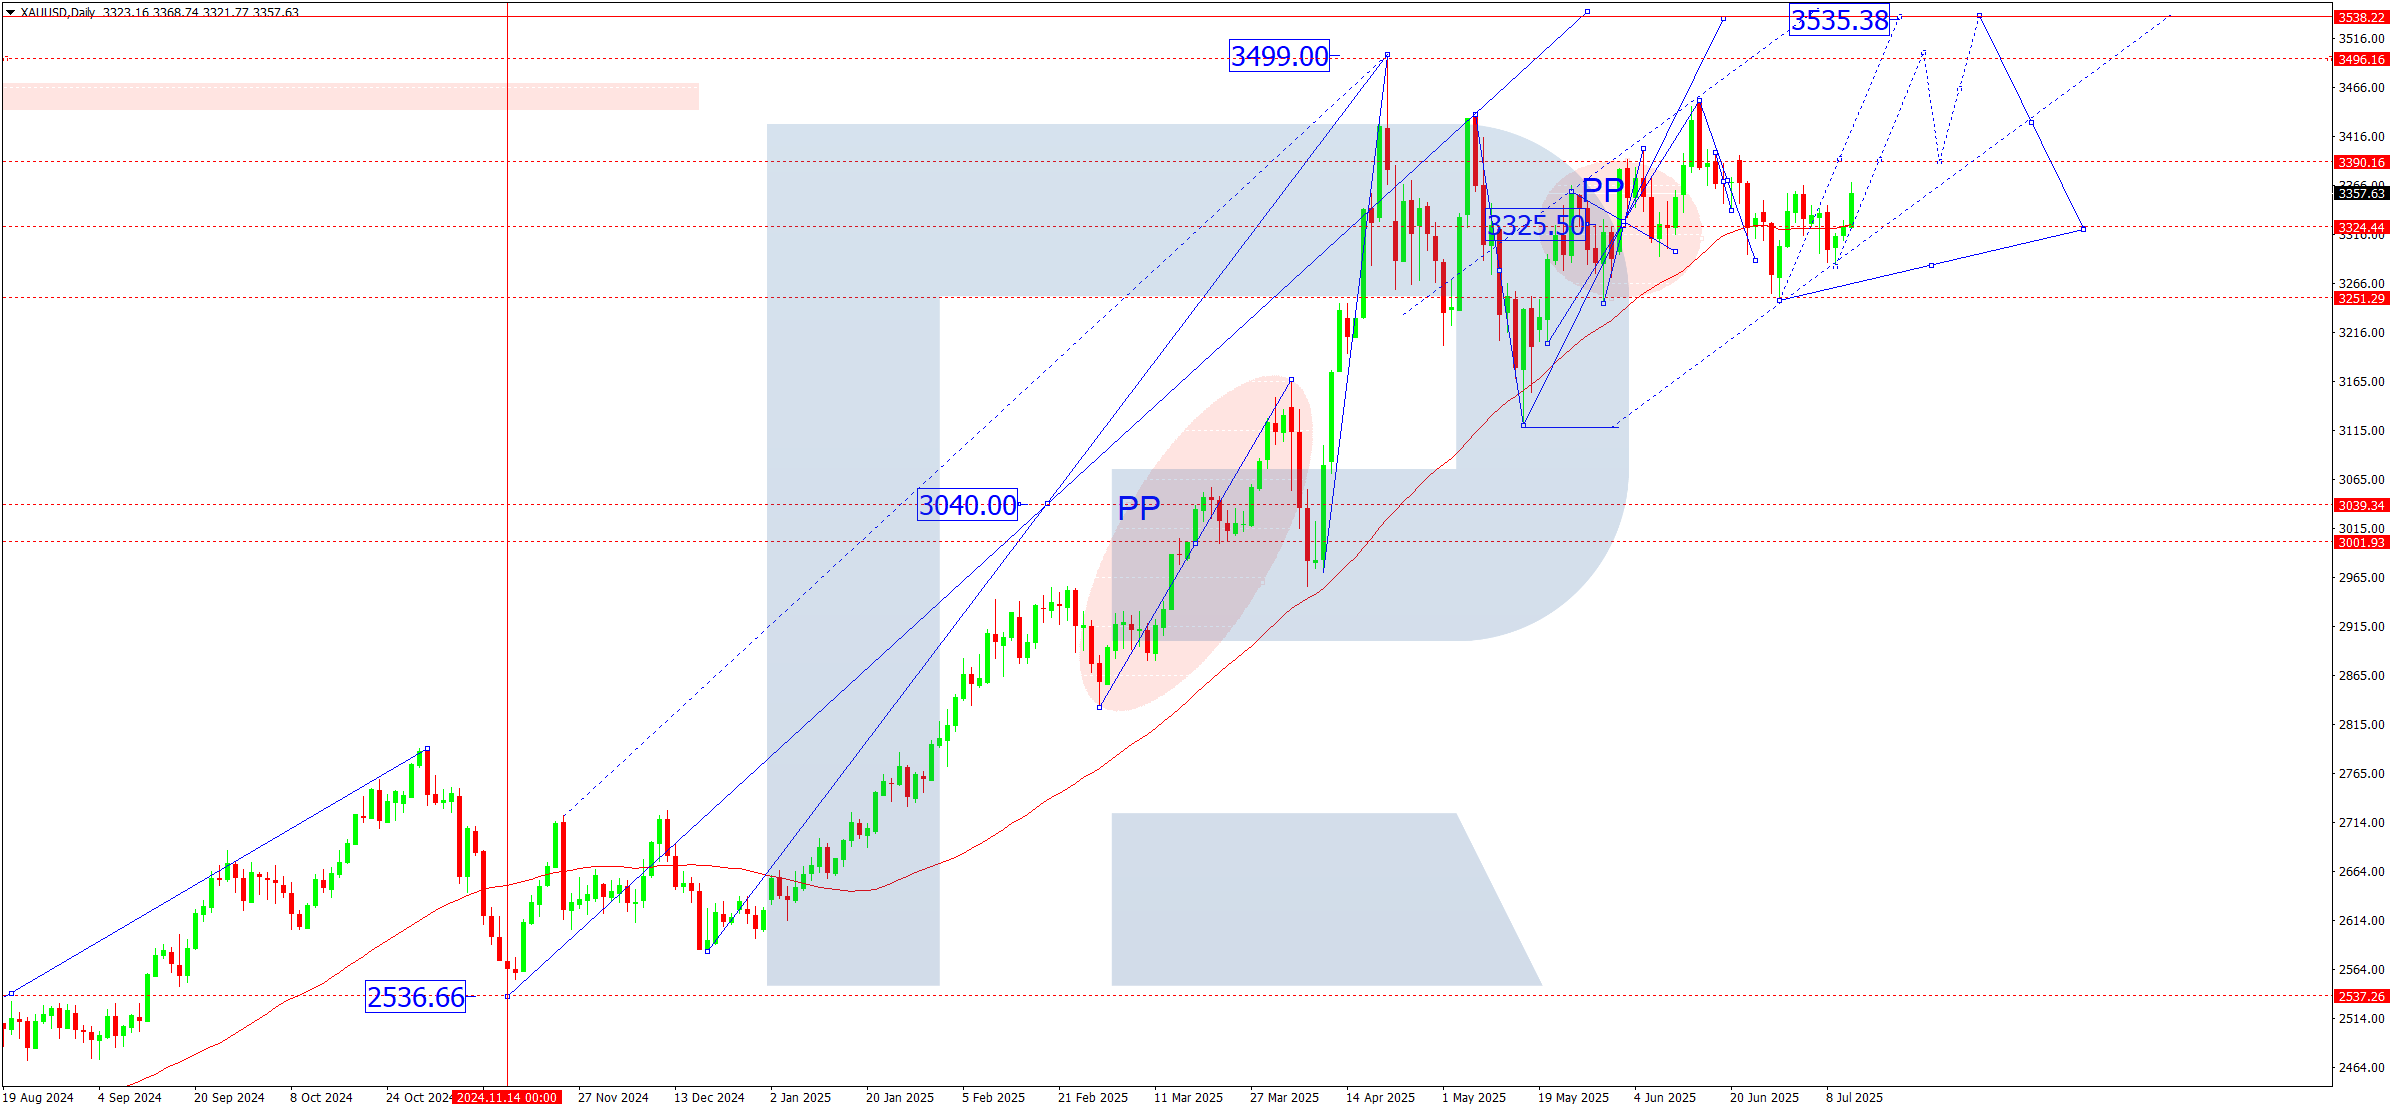
XAUUSD forecast
Weekly XAUUSD outlook for 14-18 July 2025
Gold remains resilient amid ongoing global macroeconomic uncertainty. Key fundamental drivers this week include:
- Fed rate cut expectations: recent Federal Reserve comments suggest a cautious approach. Markets are pricing in a potential rate cut as early as September, pressuring Treasury yields and supporting gold as a safe-haven asset
- Rising geopolitical risks: tensions in Eastern Europe and the Middle East remain elevated, boosting demand for safe-haven assets like gold
- Falling real yields: with moderate inflation in the US and eurozone, and stable or declining interest rates, gold’s appeal as a non-yielding asset increases
- Weaker US dollar: the dollar index remains under pressure due to anticipated Fed policy easing – a favourable factor for XAUUSD
Technical analysis:
From a technical point of view, the uptrend that began in November 2024 remains intact. The price found support at 3,251 and broke above 3,330. The SMA50 prevented a deeper correction. This week, the focus shifts to a potential continuation of the upward wave towards 3,390. A breakout above this level could extend the wave towards 3,535. That area may mark the exhaustion point of the current rally. Afterwards, a deeper correction down to at least 3,040 may follow.
Forecast scenarios:
Bullish scenario:
- Consolidation above 3,390 will strengthen bullish momentum, with key targets:
- 3,500, a psychological resistance and May high
- 3,535, a potential top of the fifth wave
Bearish scenario:
- A breakout and consolidation below 3,250 will open the path for a correction to 3,050-3,040, technical and fundamental correction area
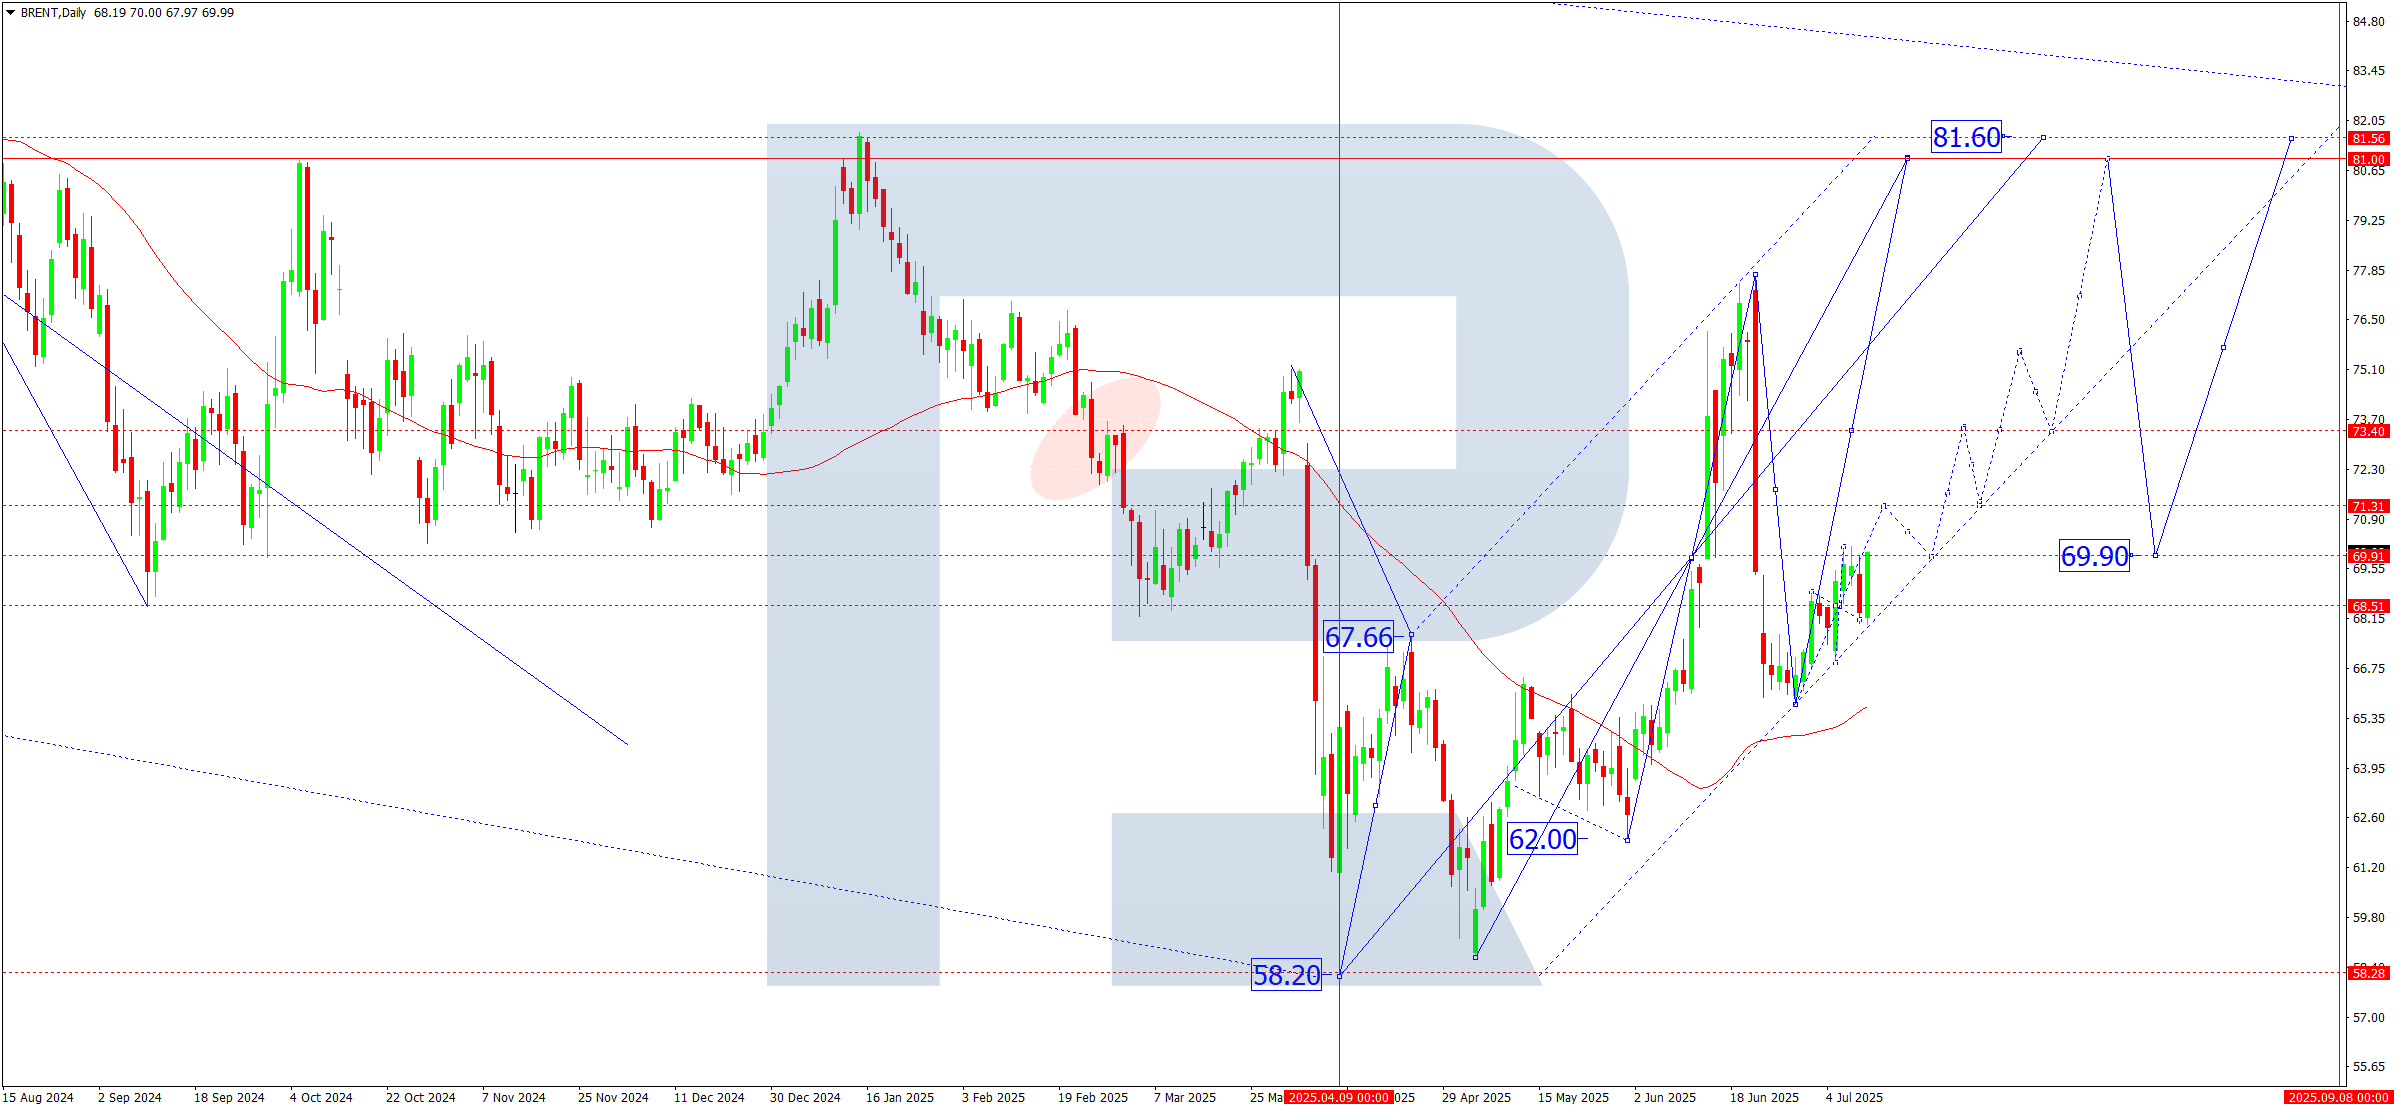
Brent forecast
Weekly Brent outlook for 14-18 July 2025
The fundamental backdrop remains supportive for oil prices. Key bullish drivers:
- OPEC+ forecasts stable demand for the second half of the year
- US crude stockpiles dropped according to the latest EIA data
- Seasonal demand growth is expected in summer, especially across Asia and the US
However, downside risks persist:
- Slowing activity in China, the world’s second-largest oil consumer
- US dollar strength, driven by hawkish Fed rhetoric
- Geopolitical uncertainty, including the Middle East and potential easing of sanctions on certain producers
Technical analysis:
On the daily chart, Brent confidently broke through 69.90, marking the start of a fifth wave of growth. Holding above this level sparked buyer interest. The current structure remains bullish, with the SMA50 acting as dynamic support, suggesting a stable uptrend.
A breakout above 69.90 triggered a move to the first target at 71.30. Further upside may push Brent towards 76.00, where prices previously consolidated. The main target of the third wave lies at 81.00, aligning with a local peak and the upper boundary of the long-term channel.
Forecast scenarios:
Bullish scenario: holding above 69.90 activates further upside.
Targets:
- 71.30, the nearest resistance level
- 76.00, a medium-term level
- 81.00 – a target of the third wave
Bearish scenario: a breakout below 68.50 would be the first warning sign for buyers. In this case, a pullback may follow to:
- 62.00, support from the previous structure
- 58.00, lower boundary of the March consolidation range, if pressure increases
Forecasts presented in this section only reflect the author’s private opinion and should not be considered as guidance for trading. RoboForex bears no responsibility for trading results based on trading recommendations described in these analytical reviews.