Monthly technical analysis and forecast for October 2025
In this monthly technical analysis, we examine key chart patterns and levels for the EURUSD, USDJPY, GBPUSD, AUDUSD, USDCAD pairs, gold (XAUUSD), and Brent crude oil to forecast potential developments for October 2025.
Major technical levels to watch in October 2025
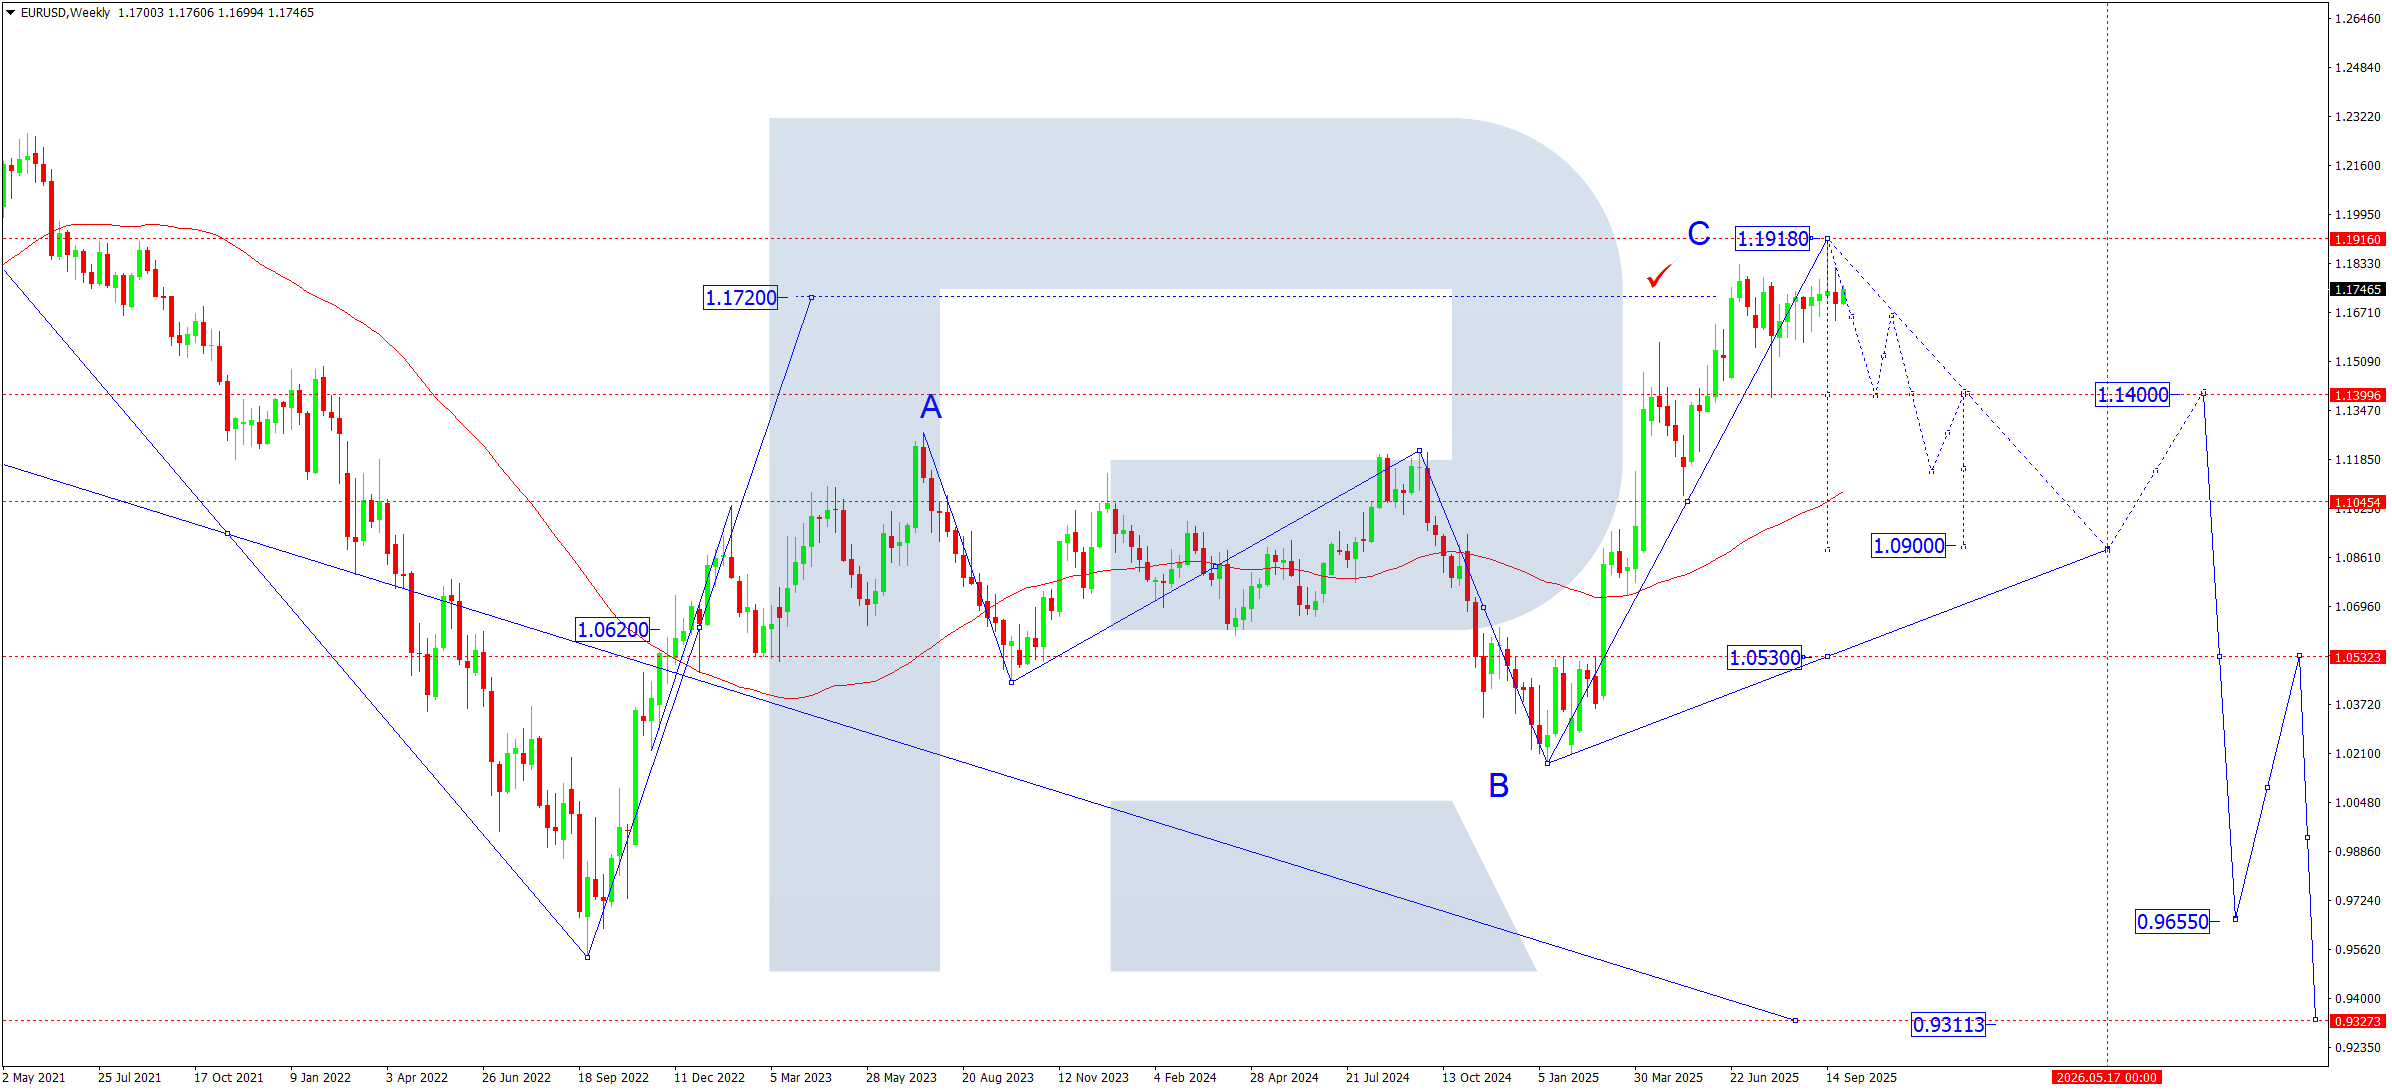
- EURUSD: Support 1.1400, 1.114Resistance 1.1830, 1.2000
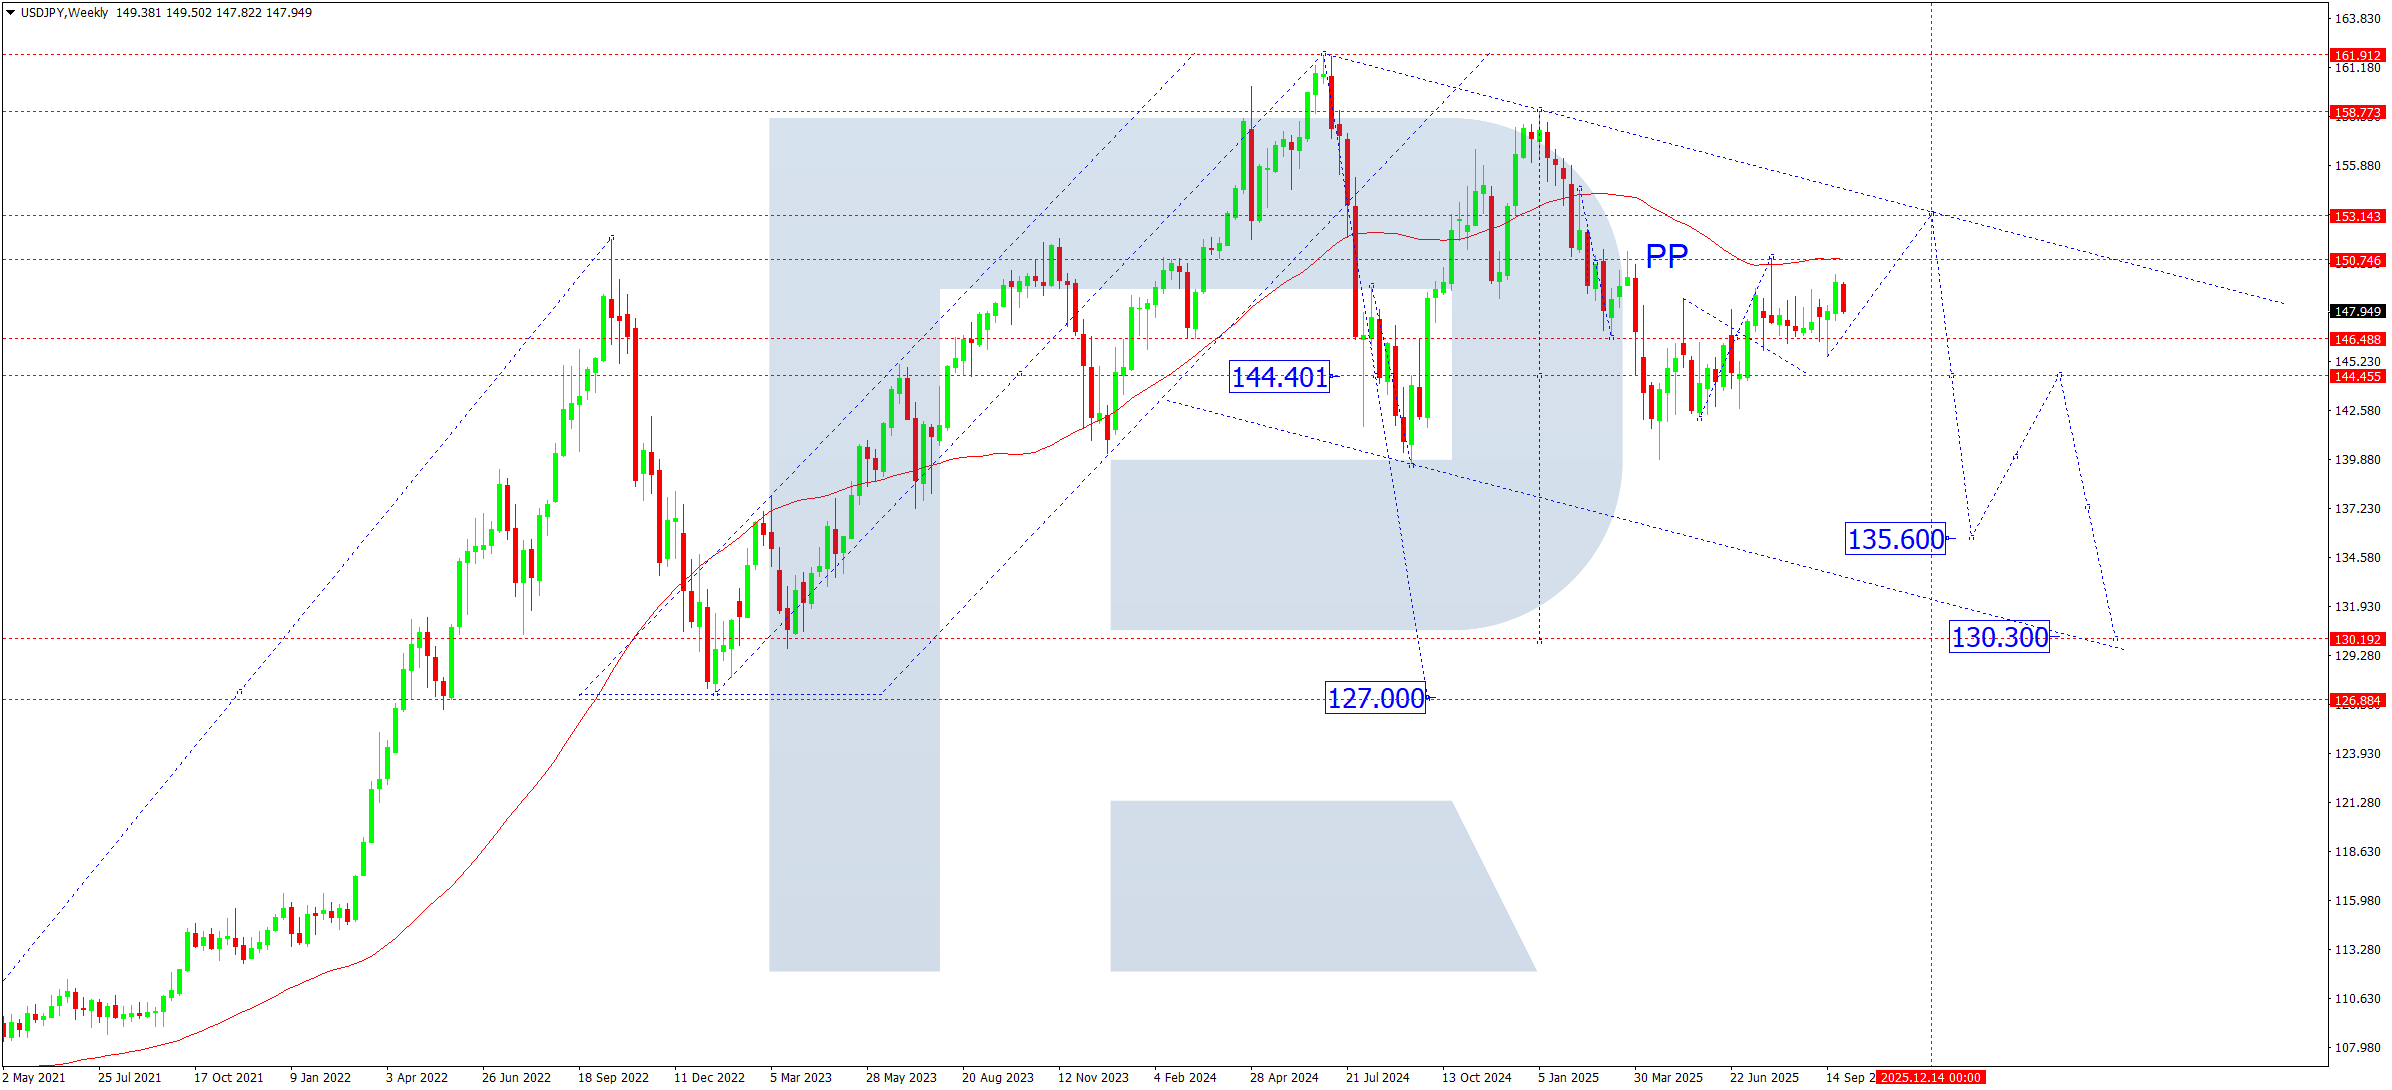
- USDJPY: Support 146.50, 144.4Resistance 150.75, 153.15
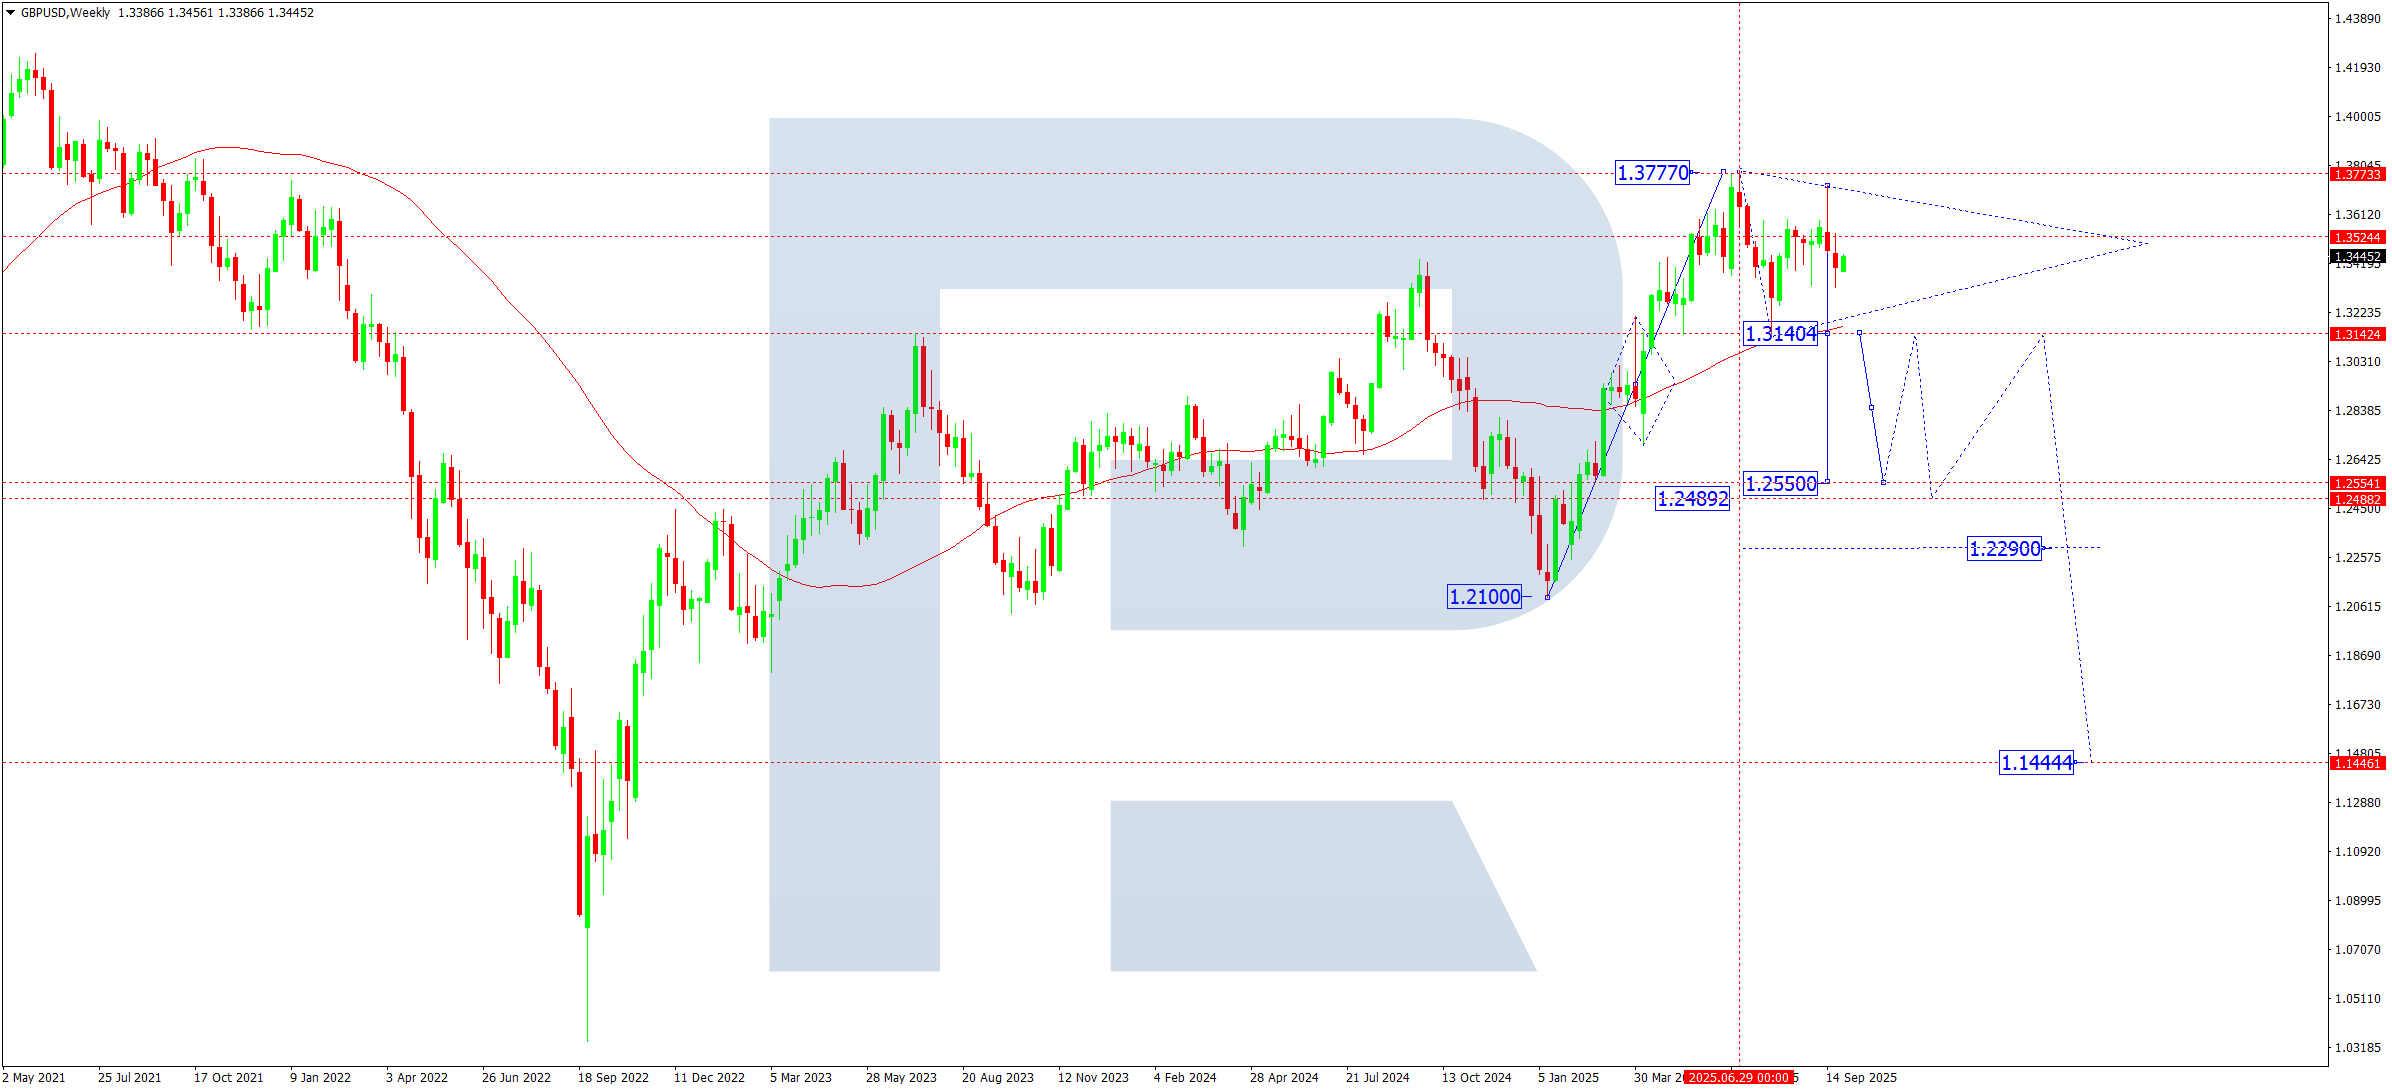
- GBPUSD: Support 1.3330, 1.314Resistance 1.3600, 1.3800
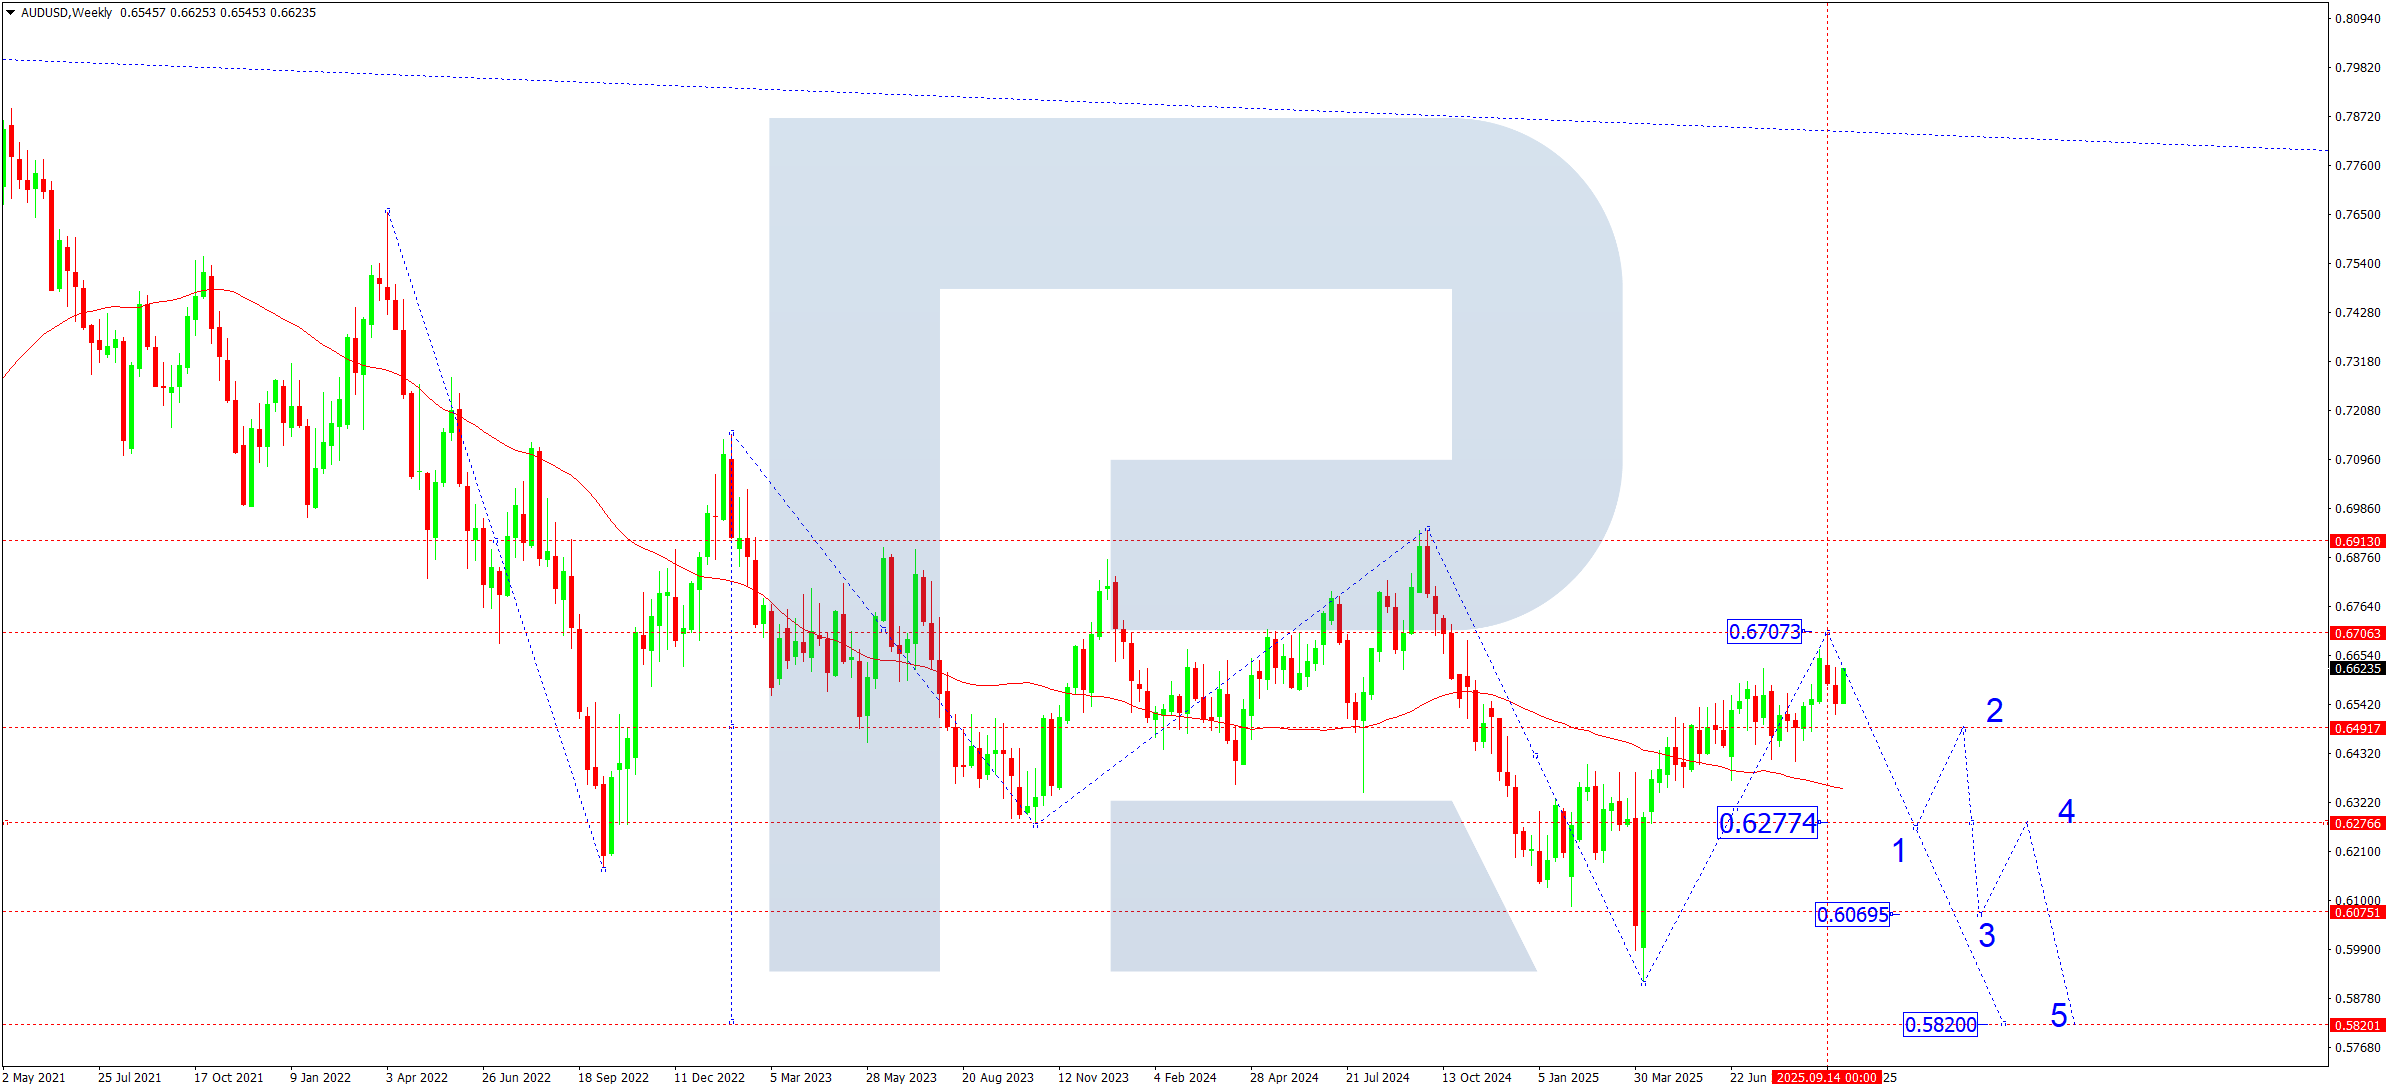
- AUDUSD: Support 0.6280, 0.606Resistance 0.6700, 0.6915
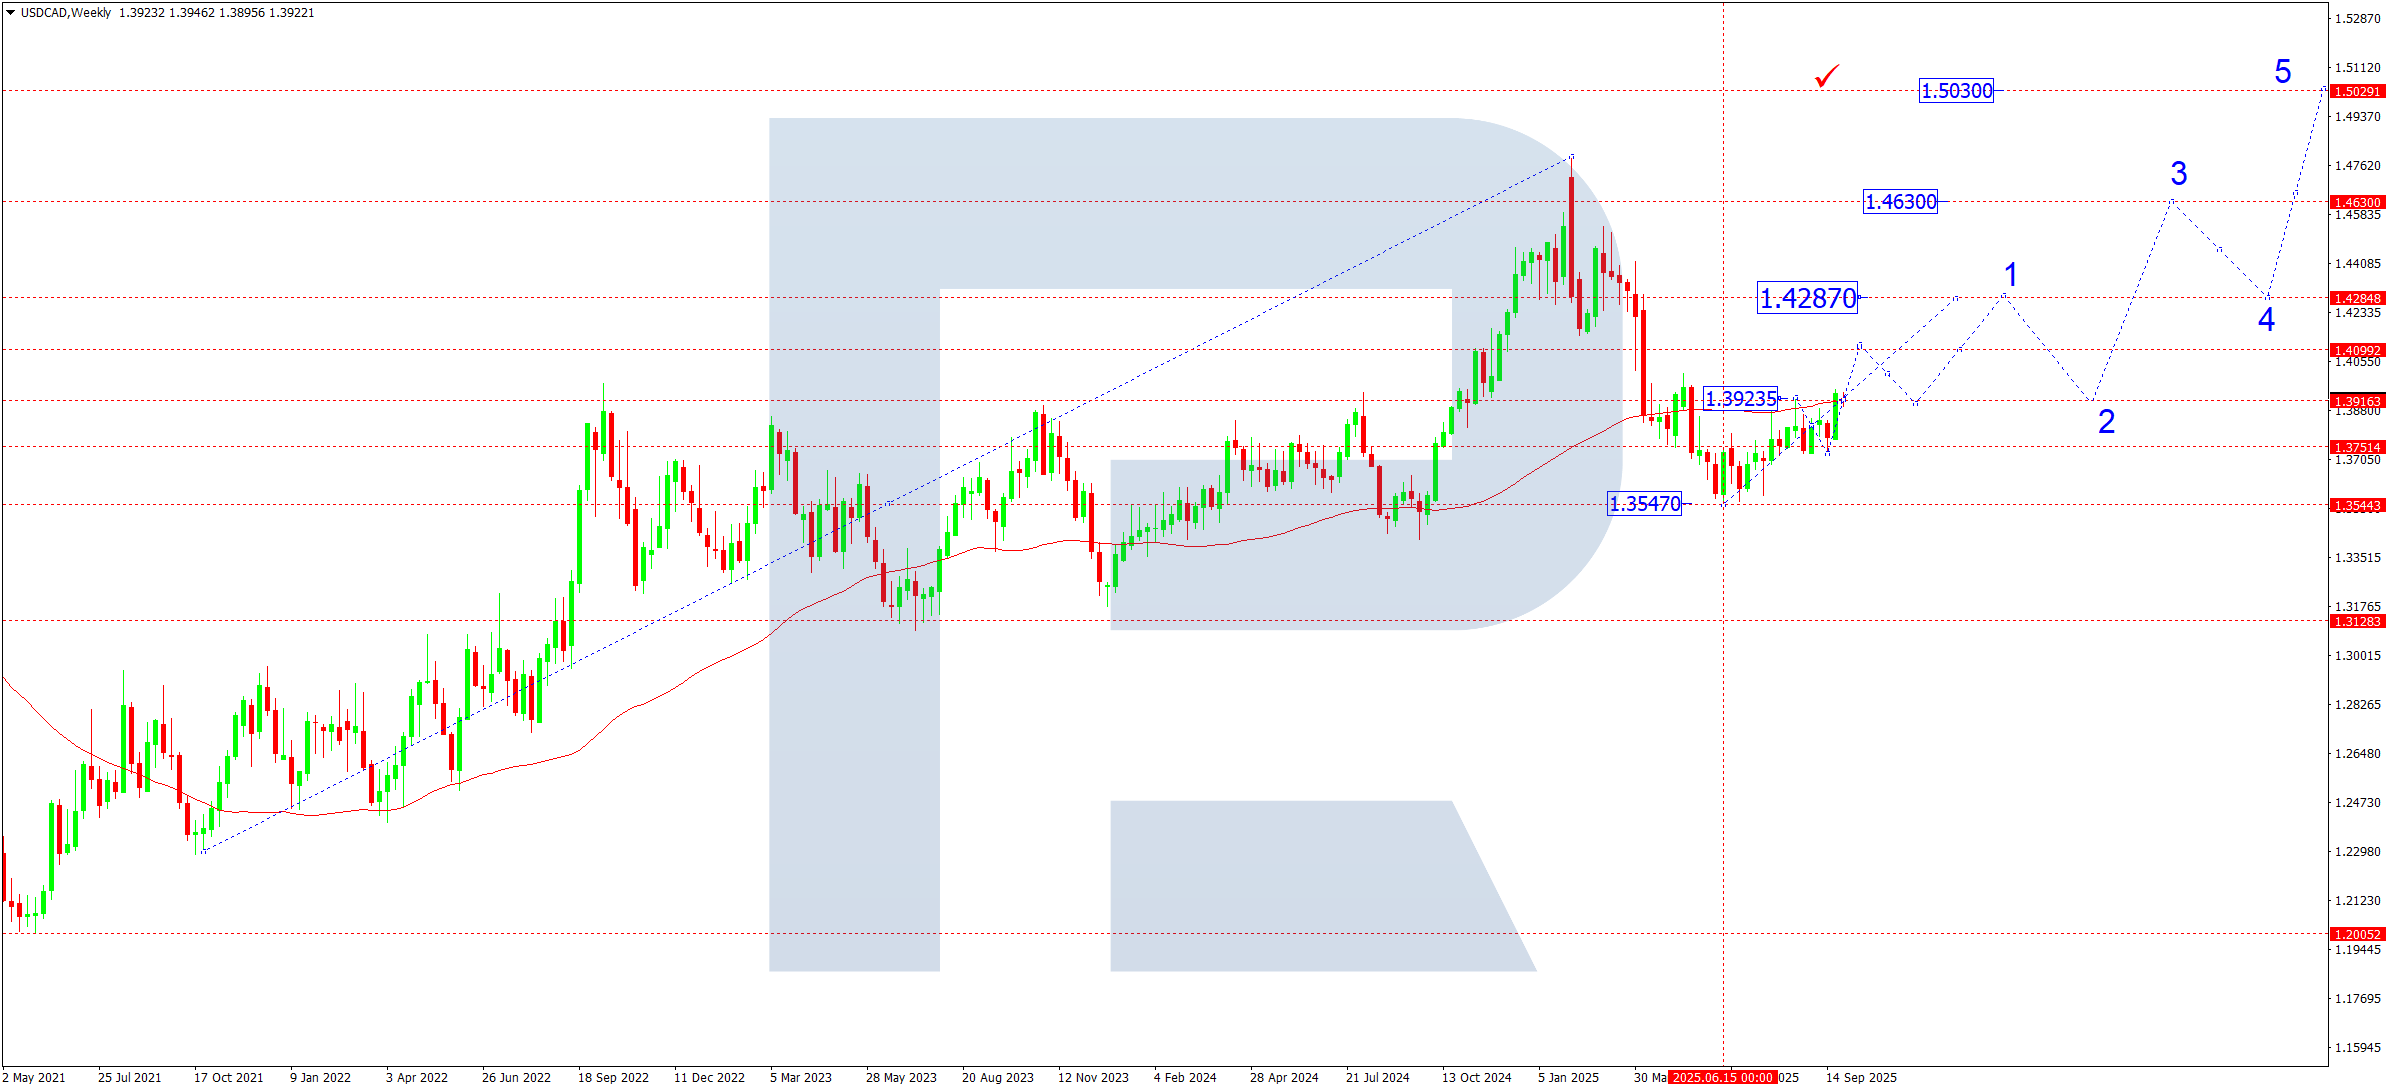
- USDCAD: Support 1.3750, 1.355Resistance 1.4100, 1.4280
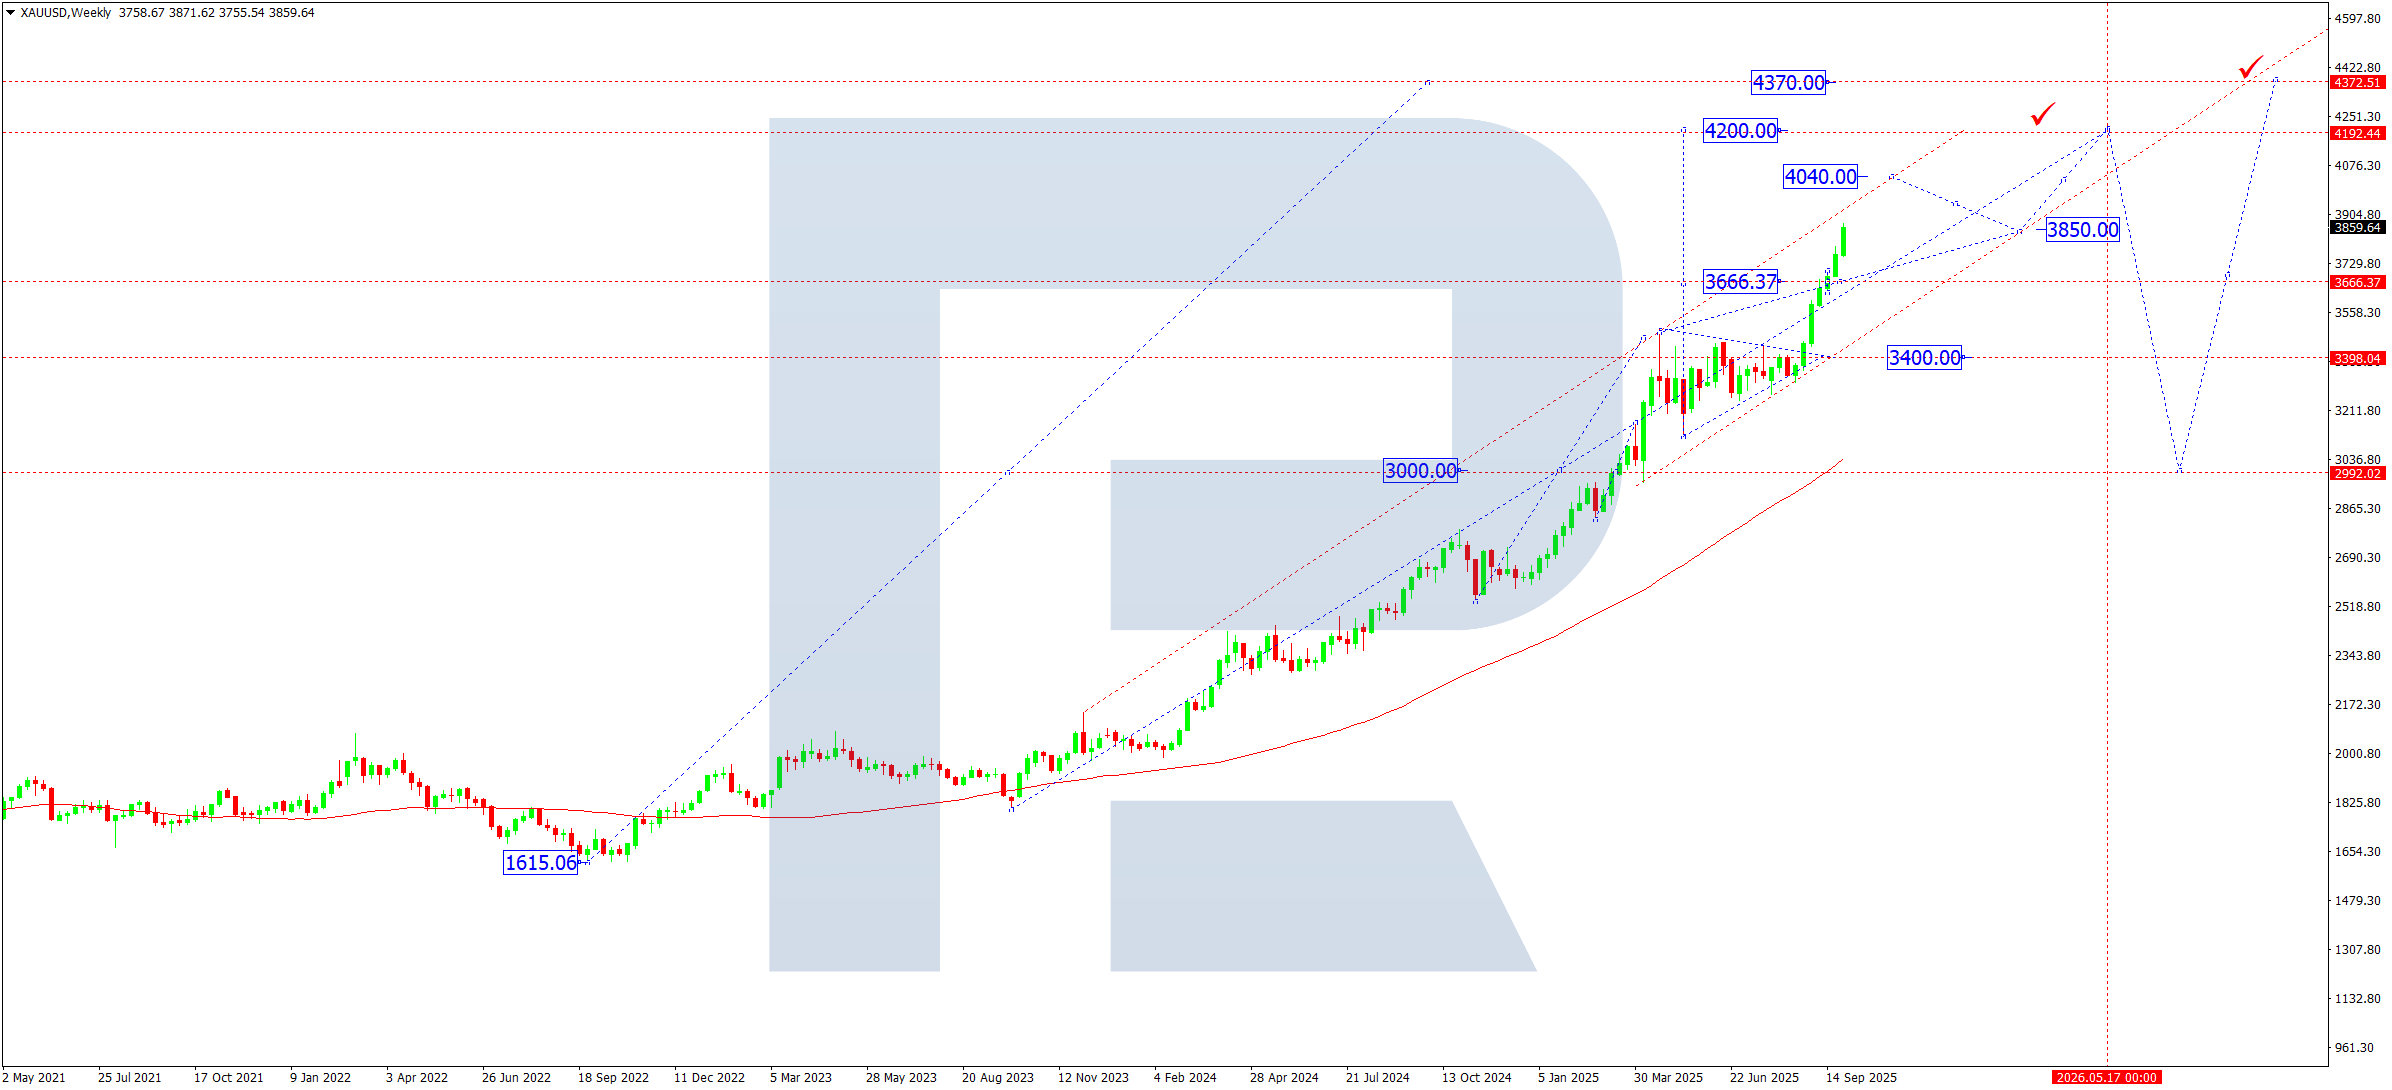
- Gold (XAUUSD): Support: 3,850, 3,66Resistance: 4,040, 4,200
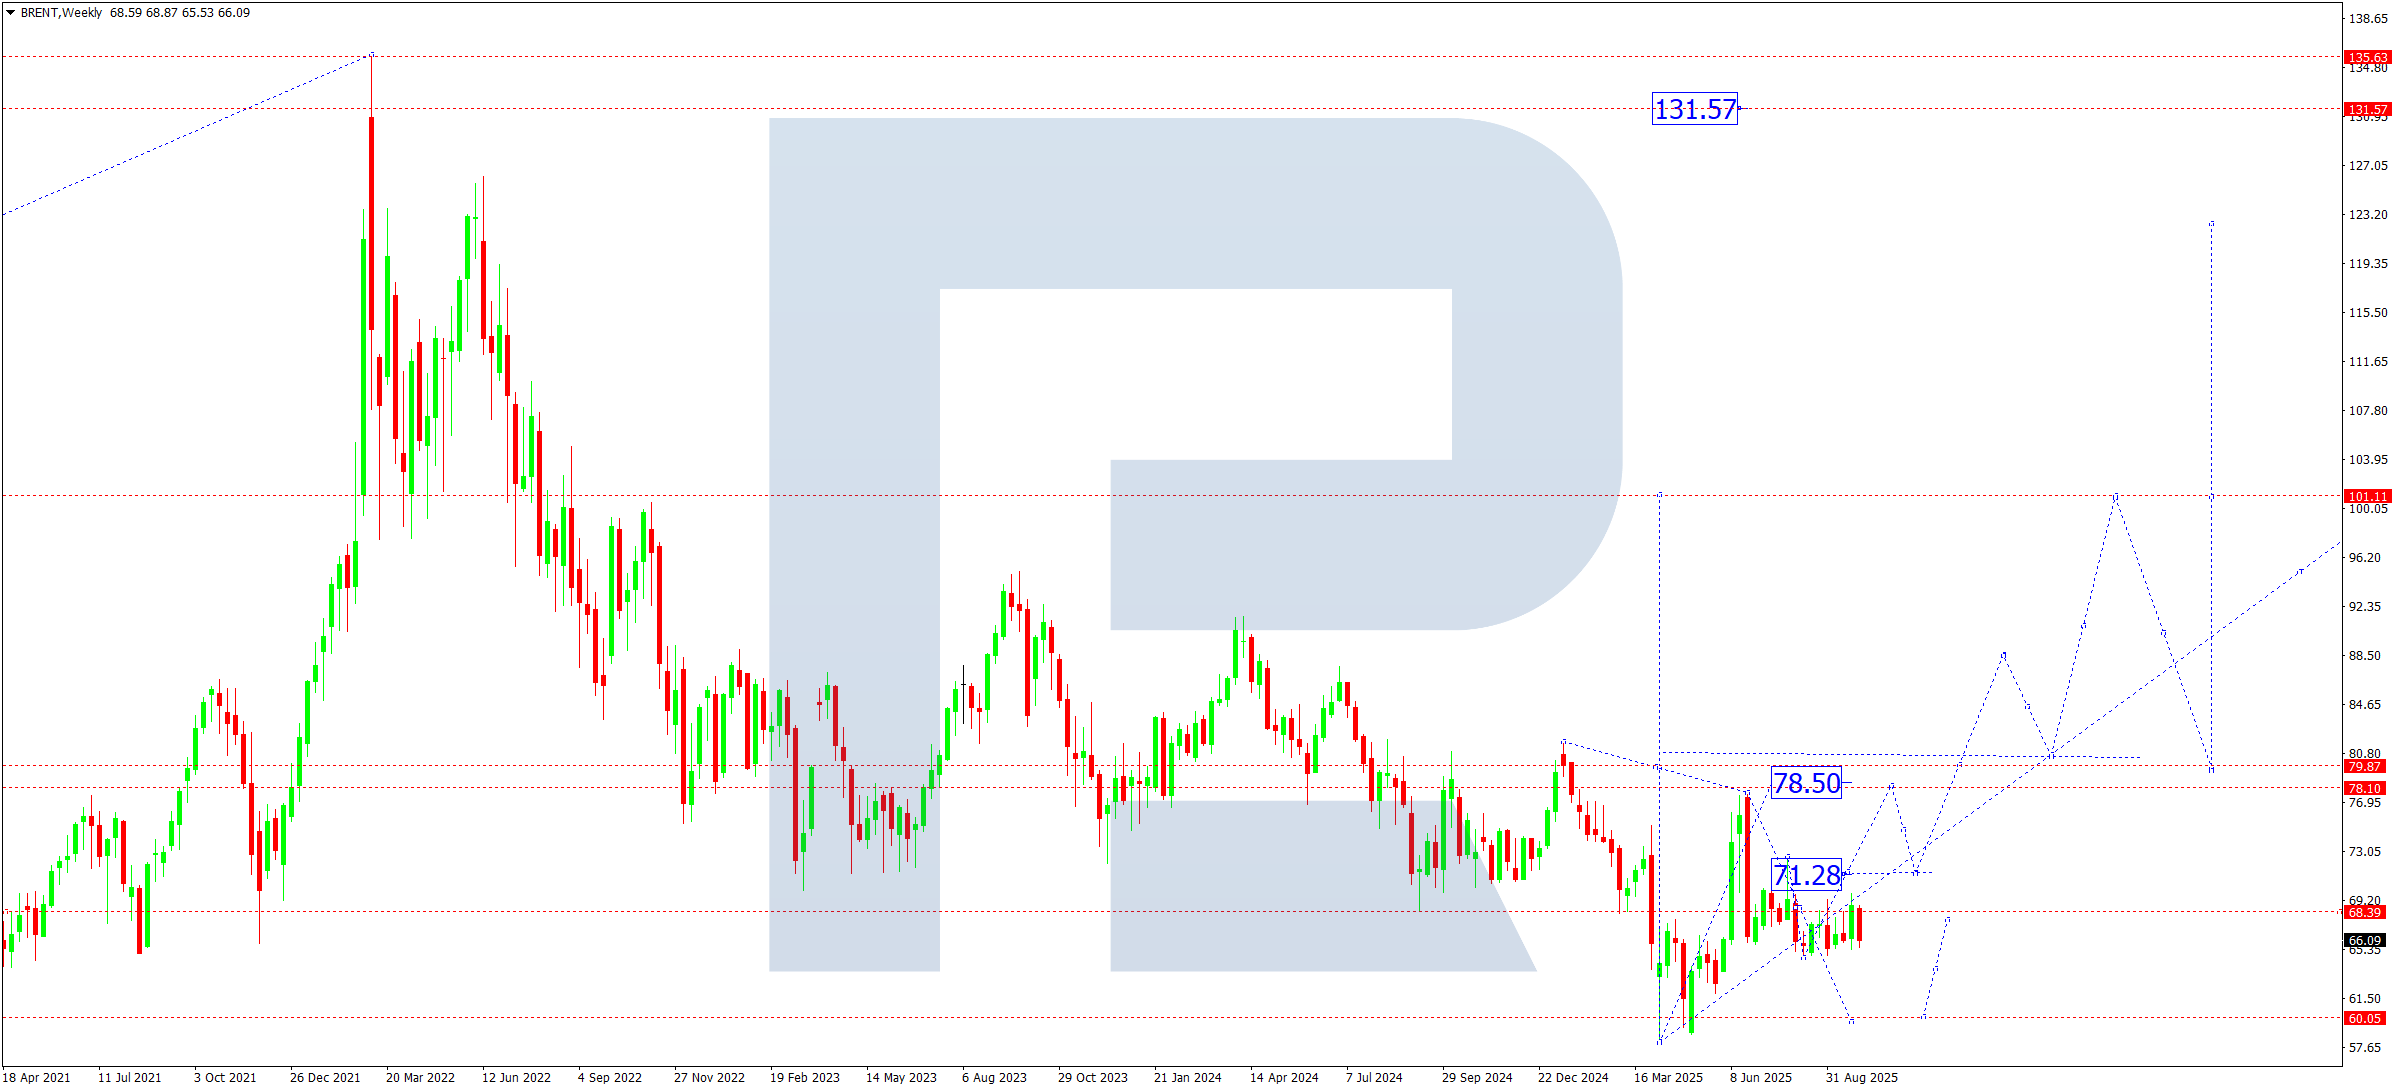
- Brent: Support: 65.50, 61.7Resistance: 68.70, 71.50
EURUSD forecast
October for EURUSD starts amid political and economic turbulence in the US (shutdown + Trump’s speech).
The US Congress stands on the verge of a partial or full shutdown if no continuing resolution passes by midnight on 30 September.
If a shutdown happens, federal agencies will suspend (or switch to “non-essential” mode) many programmes and operations, except for mandatory spending items (for example, Medicare, social security).
Some departments will sideline a significant share of staff (furlough). For example, the Department of Health plans to dismiss more than 40% of personnel.
The Pentagon also prepares to suspend part of its civilian staff.
The White House has already issued instructions for agencies to prepare plans for mass layoffs (not just temporary furloughs).
The main effect: higher uncertainty, worsening market sentiment, risk of capital outflows, and increased volatility, especially in the US dollar and related assets.
In reality, markets already show caution: European equities decline, US futures trade lower, while gold and “safe” assets gain support.
EURUSD technical analysis
On the weekly chart, EURUSD completed an extended five-wave structure of wave C that began in January 2025 at 1.0180–1.1918. The market formed a downside impulse to 1.1645. In October, we expect a correction of this impulse towards 1.1770. After that correction ends, we look for a new downside impulse to 1.1400. We treat this level as the first leg of the first wave down. The full calculated wave structure appears on the chart.
1.0900 — first wave of decline.
1.1400 — second corrective wave.
1.0530 — PP (Pivot Point) of the entire decline.
- 0.9655 — third wave of decline.
1.0530 — fourth corrective wave.
- 0.9310 — fifth wave along the trend down.
EURUSD forecast scenarios for October 2025
Bullish scenario (alternative):
The US runs a chronic deficit; tariff “triumphs” do not fix the budget; debt burdens grow. In the medium term, this undermines the dollar’s resilience.
A confident break and hold above 1.1830 will confirm a continuation of the uptrend. Upside targets:
- #.1.2000
- #.a pullback to 1.1825
- #.then a move to 1.2600.
Bearish scenario (base):
A rejection from 1.1770 followed by a break of 1.1645 and a hold below 1.1600 will signal the start of the first wave down towards the main target at 1.0900.
USDJPY forecast
- #.US: The key factor is the threat of a budget shutdown and political rhetoric. In this uncertainty, the dollar draws safe-haven demand, but debt burdens and Fed expectations create counter-pressure. If a shutdown happens, it may temporarily boost USDJPY volatility.
- #.Japan: The Bank of Japan proceeds cautiously with normalisation. After steps to adjust yield curve control (YCC) and exiting negative rates, the market awaits fresh signals on further tightening. However, with the yield gap versus the US intact, the yen stays vulnerable.
US Treasury yields: In recent weeks, the 10-year UST yield remains elevated, which limits yen gains. Yet any dollar weakening on a shutdown or dovish Fed signals can quickly strengthen JPY.
Geopolitics: The yen traditionally behaves as a safe-haven. When global risks rise, demand for JPY can increase, which raises the probability of the bearish scenario for the pair.
USDJPY technical analysis
USDJPY continues to shape a wide consolidation range around 144.40. At this stage, the market holds within another range anchored at 146.46.
A rise to 150.75 is possible. If price breaks that level, a move to 153.15 — the upper boundary of the descending channel — cannot be ruled out.
However, the entire rise looks like a corrective Flag, which raises the probability of a downside rejection after hitting resistance.
If price breaks 144.40 on growing volumes, the downside scenario activates with targets at 135.60 and 130.30.
USDJPY forecast scenarios for October 2025
Bearish scenario (base):
A break of 146.50 and a hold below 145.00 will open potential for a move to 139.87.
If the bearish impulse strengthens, the decline may extend to 135.60.
Bullish scenario (alternative):
A break and hold above 150.80 opens potential for growth to 153.15 — the upper boundary of the descending channel.
GBPUSD forecast
- #.United Kingdom: The Bank of England has taken a cautious stance in recent months. Inflation remains above target, but the economy shows signs of slowing. The chance of a rate cut stays limited, which generally supports the pound. However, weak consumer demand and production data can add pressure on the currency.
- #.US: The threat of a budget shutdown, elevated Treasury yields, and Fed rhetoric create a mixed backdrop for the dollar. On one hand, USD acts as a safe haven; on the other, uncertainty in Washington undermines confidence.
- #.Politics: Trump’s statements and US domestic risks can increase volatility in the pair.
GBPUSD technical analysis
GBPUSD completed a rise from 1.2100 to the 1.3777 target. A consolidation range forms at the top of this wave.
The market printed a drop to 1.3140 and a correction to 1.3590.
In September, the market made a fresh impulse down to 1.3330.
In October, we expect a correction to 1.3520, after which we consider a continuation of the downward wave to 1.3140.
A break of 1.3140 will open potential for a decline to 1.2550 (local target).
GBPUSD forecast scenarios for October 2025
Bearish scenario (base):
A rejection from 1.3520 and a break of 1.3330 will activate sellers.
The nearest target is 1.3140, then 1.2550.
An extra driver: higher UST yields and a stronger dollar.
Bullish scenario (alternative):
Holding above 1.3590 and breaking 1.3600 will open the path to a continued uptrend.
The target is 1.3920, with scope to 1.4000 if UK macro data delivers solid support.
AUDUSD forecast
- #.Australia: The RBA keeps a hawkish tone, but the market prices a possible pause in tightening. The economy slows: weaker consumer demand and a cooling housing market put pressure on the Australian dollar. Australia’s reliance on exports to China, where the industrial sector softens, remains an additional risk.
- #.US: Elevated US bond yields and the possible budget shutdown increase demand for the dollar as a safe haven. Fed guidance about keeping rates high for longer than expected also supports USD.
- #.Commodity factor: Instability in commodity markets (notably metals and energy) can amplify AUD volatility, as it remains a “commodity currency”.
AUDUSD technical analysis
On the weekly chart, AUDUSD completed a downside impulse to 0.6520.
In October, we expect a corrective leg of that impulse to 0.6633.
After the correction ends, a new downward wave looks likely with the nearest target at 0.6280.
The main target of the current downtrend stands at 0.5820.
AUDUSD forecast scenarios for October 2025
Bearish scenario (base):
A break of 0.6500 and a hold below will activate a move to 0.6280, then 0.6060.
If pressure on commodity markets intensifies, the move can stretch to 0.5820.
Bullish scenario (alternative):
A break of 0.6700 will signal growth.
The first target is 0.6915.
USDCAD forecast
Key drivers for the pair in October remain oil price dynamics and expectations for Fed and Bank of Canada policy. US dollar strength draws support from safe-haven demand and hawkish Fed rhetoric. For CAD, pressure on oil prices and possible signs of Canada’s economic slowdown pose risks. The balance of these factors will define the depth of corrections within the rising structure.
USDCAD technical analysis
On the weekly chart, USDCAD built a rise to 1.3923 and corrected to 1.3700. The market then produced a new rise to 1.3930. In October, we expect a break above 1.3930 and a continuation of the up wave with a local target at 1.4100. After reaching this level, a correction towards 1.3930 may follow as a fourth wave. A firm hold above 1.4100 will open potential for a fifth wave up towards 1.4280. We view this entire rise as the first growth wave in the trend towards 1.5030.
USDCAD forecast scenarios for October 2025
Bullish scenario (base):
A break and hold above 1.3950 will confirm the market’s intention to continue higher. Targets:
- #.1.4100 — local target
- #.1.4280 — target of the first trend wave up.
Bearish scenario (alternative):
A break and hold below 1.3750 on higher volumes will open potential to extend the wave to 1.3550 and then 1.3500.
XAUUSD forecast
In October, uncertainty in the US remains the key factor for gold. The threat of another budget shutdown increases demand for safe-haven assets, and political rhetoric from the Trump administration raises nerves in financial markets.
Expectations of imminent Fed rate cuts add pressure on the dollar, which supports gold demand. Central banks continue to build gold reserves, reinforcing the diversification trend away from the dollar. Geopolitical risks and high equity volatility increase gold’s appeal as a capital preservation tool.
XAUUSD technical analysis
On the weekly chart, gold broke a “Pennant” and continues to move towards the upper boundary of the rising channel at 4,040. In October, the market retains potential to reach that target, after which the trend may extend to 4,200 — the nearest local objective.
However, hitting 4,040–4,200 can mark the final phase of the current impulse. In that case, we expect a corrective pattern to form. The first downside target stands at 3,400; the main target at 3,000. After the correction completes, the uptrend may resume with potential towards 4,370.
XAUUSD forecast scenarios for October 2025
Bullish scenario (base):
Support above 3,850 opened the path to growth and a test of the 4,040 high. This level acts as the nearest key target and psychological marker. After a short correction to 3,850, the market may continue towards 4,200.
Bearish scenario (alternative):
After reaching 4,040, gold may enter a deeper correction. A break of 3,850 will be the first sign of weakness. Focus then shifts to 3,400 and 3,000, where stabilisation and a new base for an uptrend may form.
Brent forecast
In October, several opposing forces weigh on oil. On one side, US shutdown risks and the Trump administration’s policy increase global market instability. On the other, investors focus on OPEC+ meetings, whose decisions will set the supply balance for the coming months.
Rising tensions in Venezuela represent a separate risk. The probability of ground military actions in the region raises concerns about production and export stability. For the market, this can trigger a sharp supply cut and extra support for oil prices.
Demand remains under pressure: industrial data in China and Europe signal a slowdown, which limits upside potential. Even so, the overall balance still favours Brent holding at elevated levels on any first sign of geopolitical escalation.
Brent technical analysis
On the weekly chart, Brent builds a rising wave with the nearest target at 78.50. The market currently develops the fourth corrective wave, consolidating around 68.40.
While price trades below the SMA50, the short-term outlook still allows a decline towards 60.00. After the correction ends, a fifth growth wave may unfold targeting 78.50 and then 101.00. The long-term trend potential still points to 131.57.
Brent forecast scenarios for October 2025
Bullish scenario (base):
Holding above 68.70, alongside persistent geopolitical tensions (including escalation risks in Venezuela) and possible OPEC+ quota changes, can lead to a breakout of the consolidation near 80. In that case, the growth target is 101, with scope to 125.
Bearish scenario (alternative):
With weak global data and no fresh OPEC+ decisions, Brent may return to the 68–65 range. A break of 65 opens the way to 60, which remains the fundamental floor — below breakeven for several exporters.
Forecasts presented in this section only reflect the author’s private opinion and should not be considered as guidance for trading. RoboForex bears no responsibility for trading results based on trading recommendations described in these analytical reviews.