Monthly technical analysis and forecast for November 2025
In this monthly technical analysis, we examine key chart patterns and levels for the EURUSD, USDJPY, GBPUSD, AUDUSD, USDCAD pairs, gold (XAUUSD), and Brent crude oil to forecast potential developments for November 2025.
Major technical levels to watch in November 2025
- EURUSD: Support 1.1250, 1.1040. Resistance 1.1720, 1.1820
- USDJPY: Support 151.00, 146.40. Resistance 158.00, 161.00
- GBPUSD: Support 1.2828, 1.2580. Resistance 1.3150, 1.3460
- AUDUSD: Support 0.6350, 0.6200. Resistance 0.6630, 0.6700
- USDCAD: Support 1.3933, 1.3727. Resistance 1.4160, 1.4333
- Gold (XAUUSD): Support: 3660, 3200. Resistance: 4100, 4400
- Brent: Support: 60.00, 59.00. Resistance: 78.30, 94.00
EURUSD forecast
In November, the key driver for the EURUSD pair remains the divergence between the monetary cycles of the Fed and the ECB.
- Federal Reserve: the latest comments from US policymakers point to a gradual softening of rhetoric without abrupt policy reversals. The base-case scenario expects the first rate cut closer to Q1 2026. However, the market is closely watching inflation dynamics and the labour market. Slowing consumer activity and a decline in the new job index fuel speculation about a soft pivot
- ECB. In the eurozone, core inflation is holding below the US level, the economy is technically stagnant, but the ECB is trying to avoid premature policy easing. The main focus is on the stability of the banking sector and support for manufacturers affected by a strong euro in the first half of the year
- Geopolitics. EU-US relations continue to balance between tariff disagreements and attempts to coordinate trade quotas. European industry is sensitive to weak demand, while budget constraints in the US raise questions about the dollar’s medium-term sustainability
- Capital flows. Interest in safe-haven assets in early November supports the dollar, but structural problems in the US (budget deficit and debt) periodically weaken its impulses
Overall picture: the dollar remains strong in the short term but is fundamentally overheated in the medium term
EURUSD technical analysis
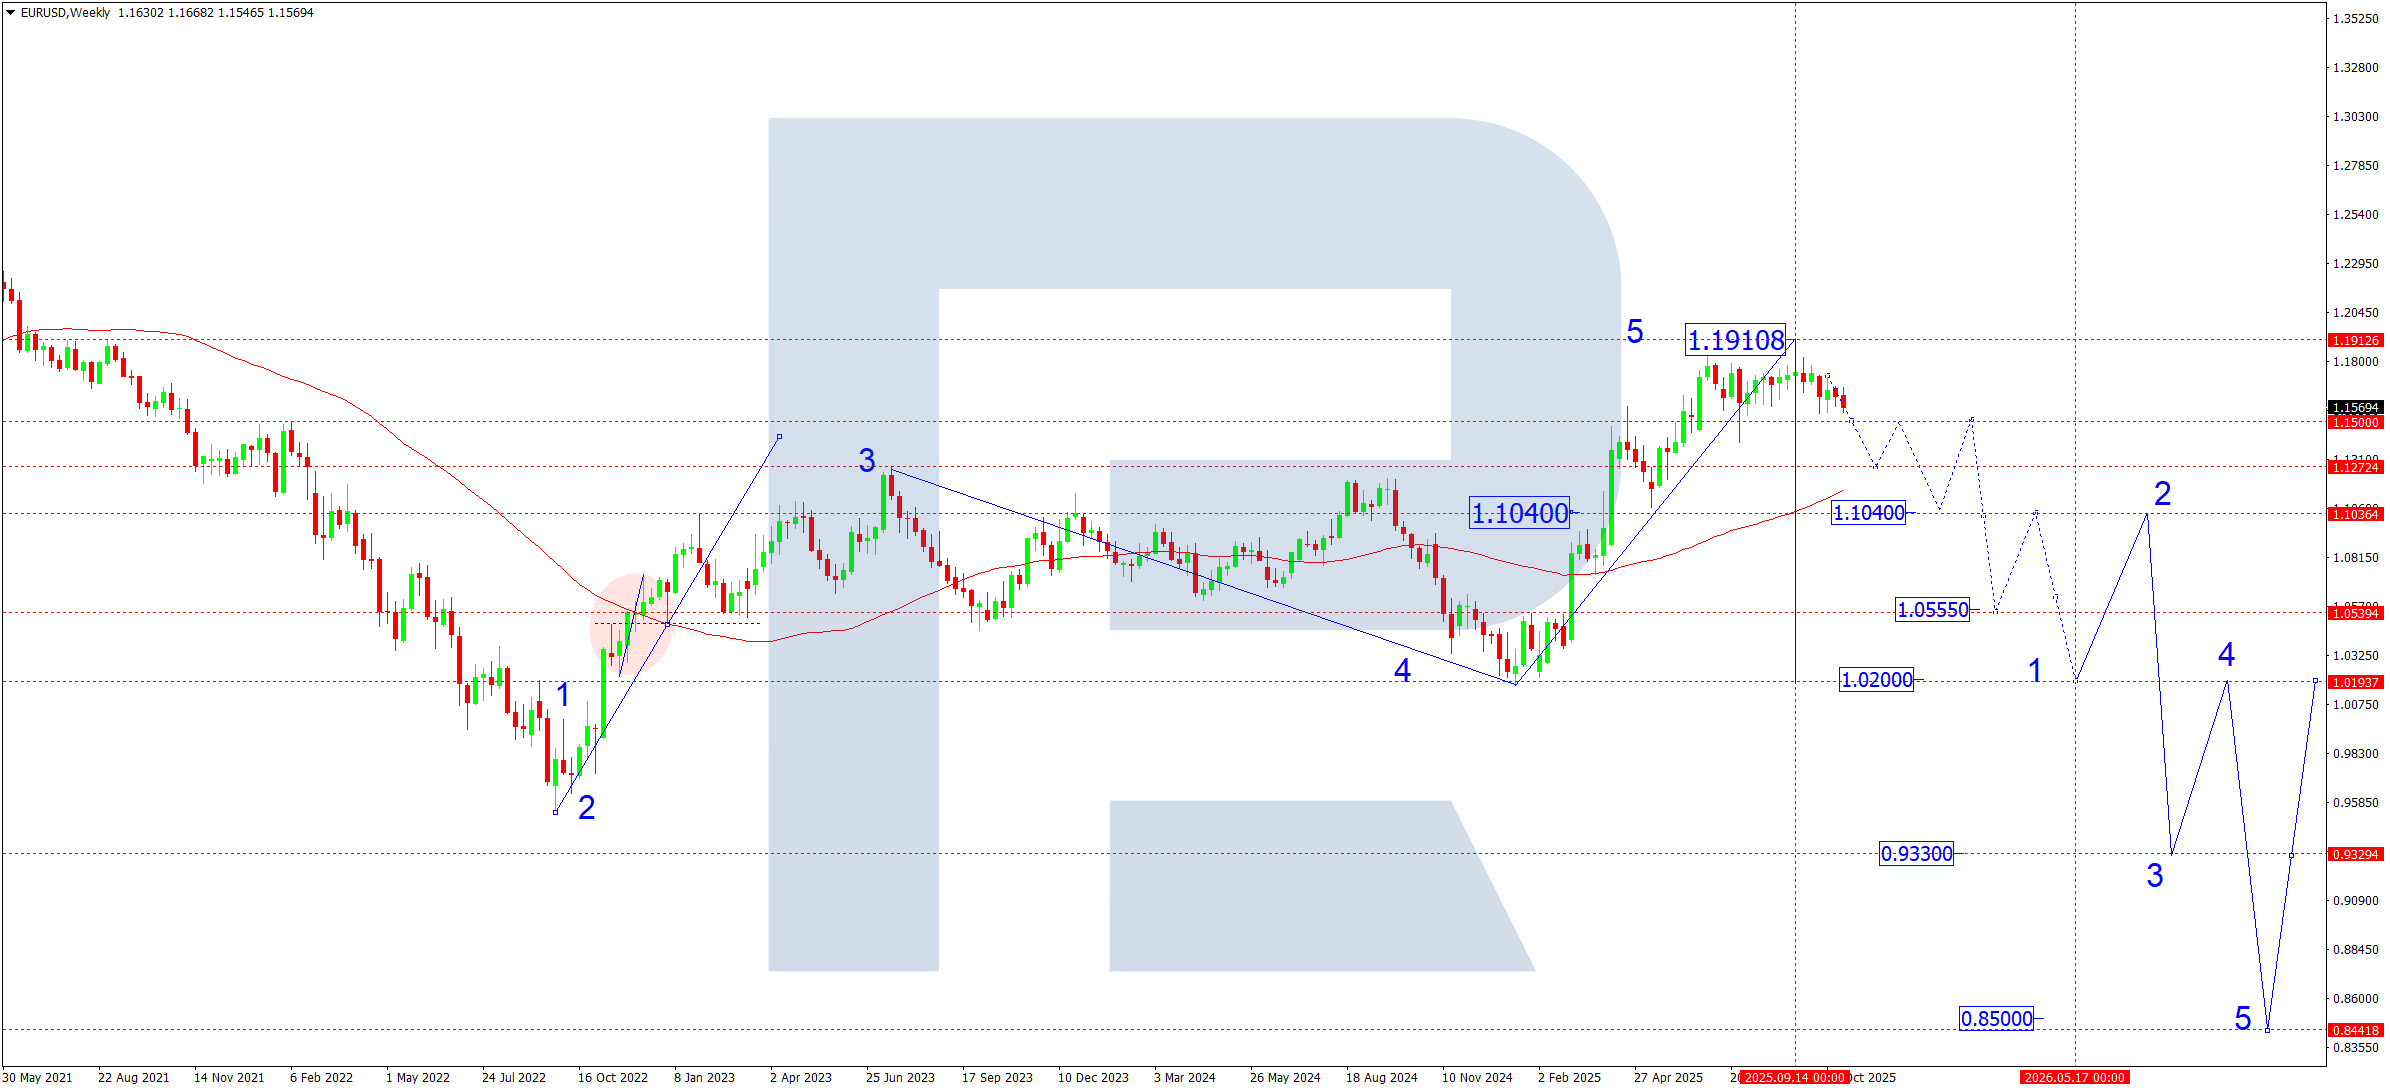
On the weekly chart, the EURUSD pair has begun to develop the first structure in the first wave of a global decline. The estimated wave structure is shown on the chart and implies the formation of a full five-wave downtrend.
Current movement structure:
- The target of the first downward wave is 1.1040
- Over the coming month, we expect a move towards 1.1250, where the market may temporarily stabilise
- Subsequently, a correction towards 1.1500 may follow as a second-type leg
- A final decline to 1.1040, completing the first wave
Layout of the entire estimated structure (higher timeframe)
- 1.2000 – 1.0200 – first downward wave
- 1.0200 – 1.1040 – second corrective wave
- 1.1040 – 1.0200 – pivot point of the entire downward wave
- 1.0200 – 0.9330 – third wave down
- 0.9330 – 1.0200 – fourth corrective wave
- 1.0200 – 0.8500 – fifth wave of the trend decline
The structure keeps the bears in priority over the long term
EURUSD forecast scenarios for November 2025
Bearish (base-case) scenario: a rebound from 1.1720 and a breakout below the 1.1500 support level with a consolidation lower will signal the start of the first wave down to the main target at 1.1040. This scenario is synchronised with the global wave structure and is the monthly priority.
Bullish (alternative) scenario: medium-term risks for the dollar persist, including chronic US deficit, rising debt service costs, and diminishing effectiveness of tariff policy.
If the price breaks and consolidates above the 1.1720 level:
- rise to 1.1820
- corrective pullback to 1.1720
- then development of the next leg higher towards 1.2000
For now, this scenario has a low probability, but it cannot be ruled out, provided there are strong fundamental triggers.
USDJPY forecast
In November, the USDJPY pair remains under the influence of mixed factors:
- US Fed policy
The market prices in a longer period of elevated rates due to a resilient US labour market and slowing yet still sticky inflation pressures. Late-October Fed rhetoric indicates readiness to keep rates longer, which supports the dollar.
- Bank of Japan
Despite gradual hints of normalising monetary policy, the BoJ maintains ultra-loose conditions. JGB yields continue to rise, but within ranges comfortable for the regulator. The lack of aggressive BoJ action to curb yen weakness remains a strong driver of the uptrend.
- Japan macroeconomic backdrop
Inflation in Japan has slightly accelerated but remains below the target in the medium term. GDP shows signs of stabilisation, but domestic demand remains weak. A persistent trade-balance deficit also weighs on the yen.
- Geopolitics and safe-haven demand
Volatility in safe-haven assets in early November is moderate. Demand for the dollar remains steady, continuing to support the USDJPY pair even during local corrections.
Bottom line: the fundamental backdrop remains bullish for USDJPY, with any pullbacks still viewed as corrective within the dominant trend.
USDJPY technical analysis
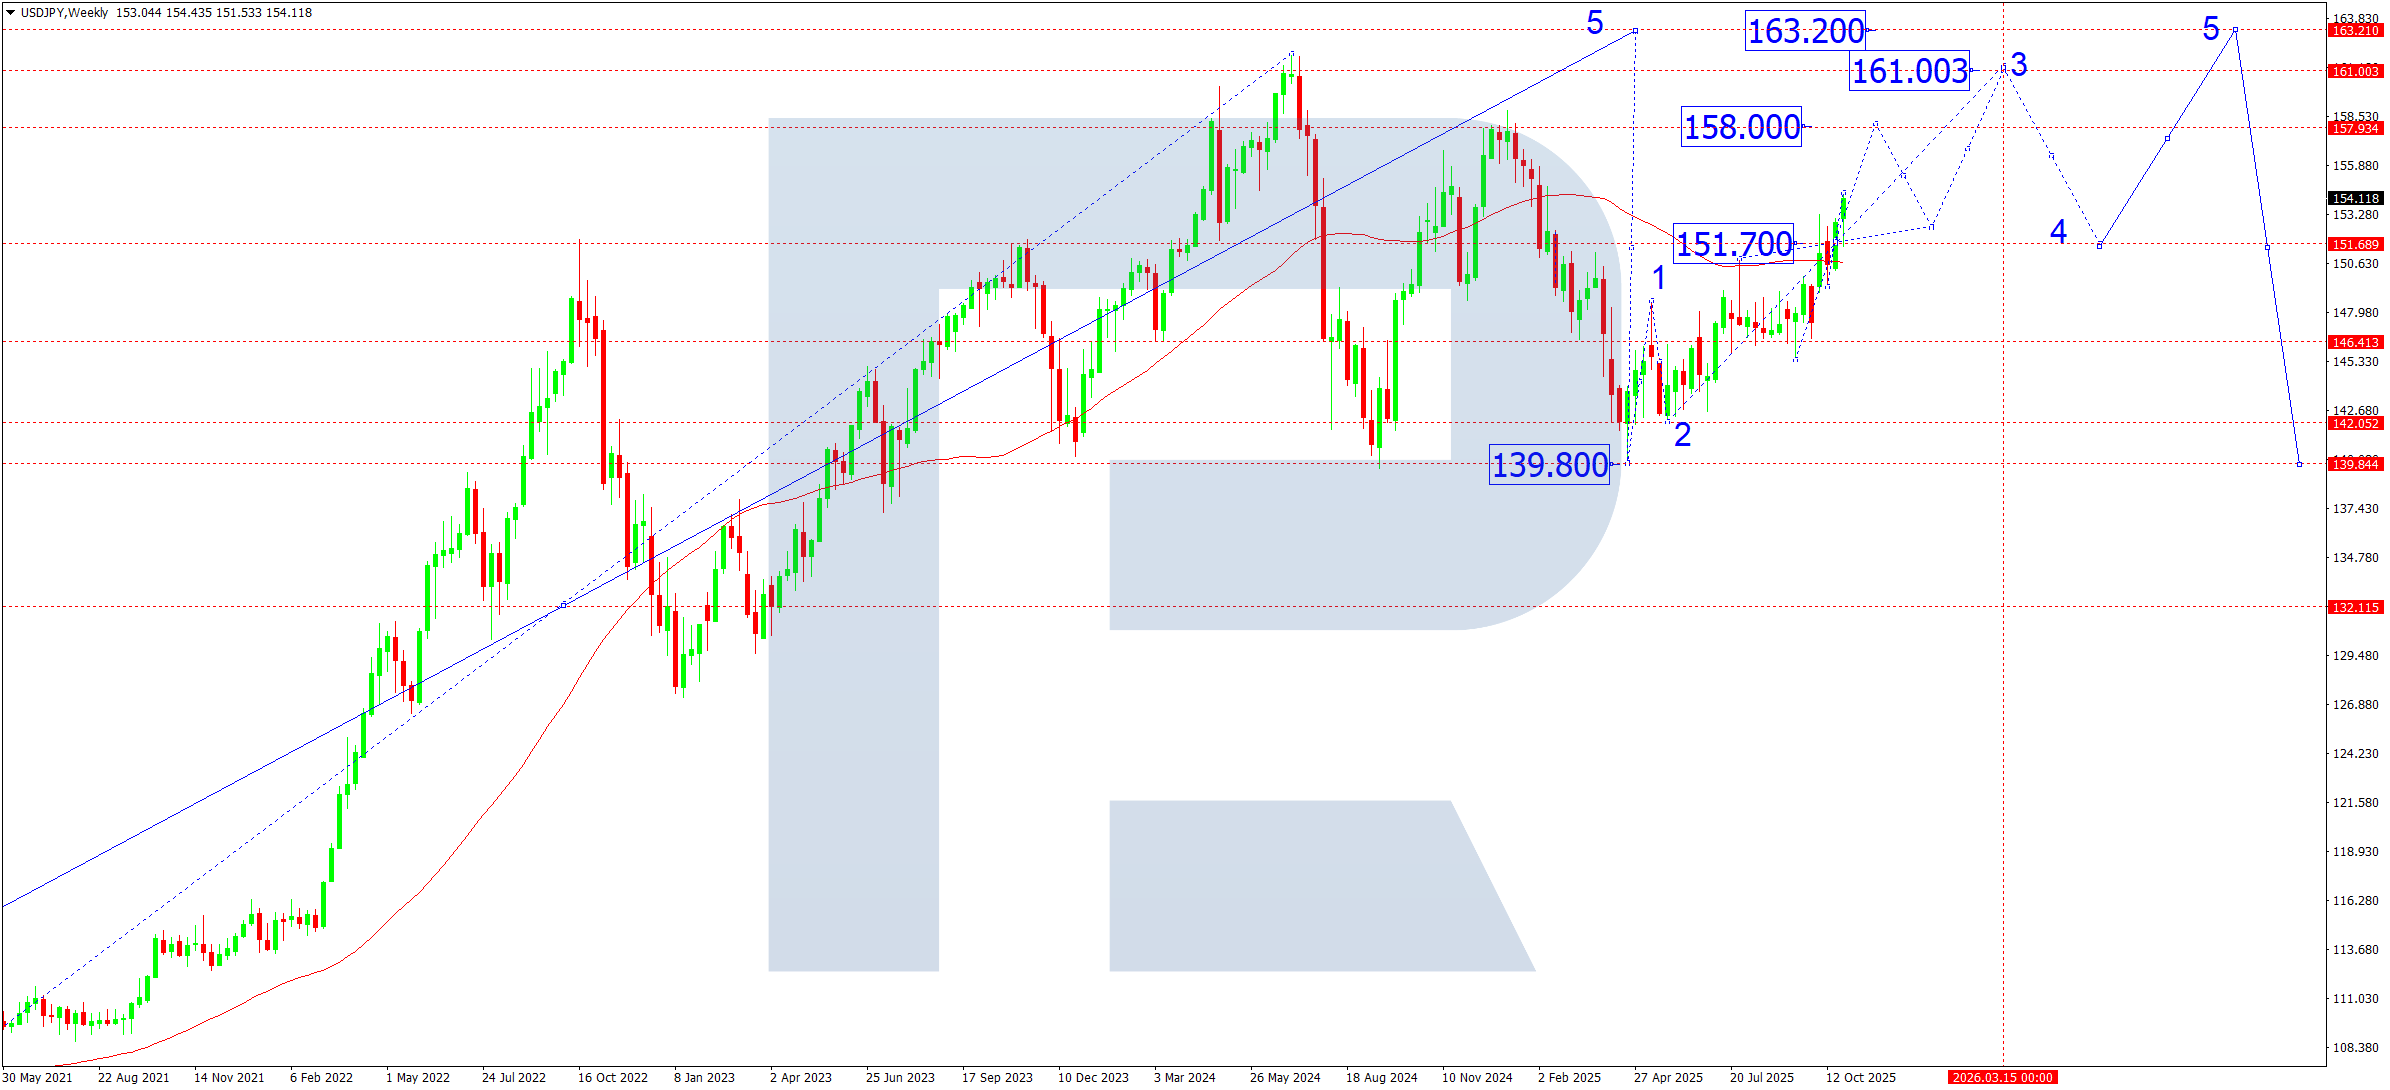
The USDJPY pair broke the key 151.70 zone and completed the expected move up to 154.43. On the weekly chart, a third-wave structure of the rising cycle is forming.
Movement structure as per the layout:
- The 151.70 level serves as a key pivot – from there, the SMA50 and the medium-term trendline were broken
- The current upward move is viewed as the development of the third structure within the third wave
- Correction scenario: after reaching 154.43, the pair could pull back to 151.70
- Subsequently, the price is expected to resume growth towards target levels of 158.00 – 161.00
- The 161.00 level is the local estimated target of the third wave, from which a correction to 153.30 is possible
- The final target of the fifth wave of the main impulse is 163.20 (extended estimated wave)
Thus, the movement structure remains upward and fairly predictable as per the wave model.
USDJPY forecast scenarios for November 2025
Bullish (main) scenario: the uptrend holds while the market trades above 151.70.
Expected stages:
- Correction towards 151.70 (or limited consolidation above)
- Resumption of growth towards 158.00
- If the 158.00 level breaks, the pair could gain momentum towards 161.00
- Next – formation of a pivot point and preparation for growth to 163.20 (final target)
Probability: high
Bearish (alternative) scenario: becomes relevant if:
- the pair breaks and consolidates below the 151.00 level on rising sell volumes
In this case:
- another leg of the corrective wave develops; the nearest downside target is 146.40 (mirror level, boundary of the previous structure).
Probability: low, given the fundamentals and current trending formation.
GBPUSD forecast
The fundamental picture for the pound in Q4 remains predominantly negative. Pressure on the GBP persists due to weak UK inflation dynamics, a cooling labour market, and ongoing expectations that the Bank of England may shift to a looser policy earlier than previously thought. An additional risk factor is steady demand for the US dollar amid firmer price pressures in the US and cautious Fed rhetoric, which widens the yield differential in favour of the USD. Geopolitical uncertainty and high commodity-market volatility also increase demand for safe-haven assets, supporting the dollar. Thus, the fundamental backdrop aligns with the technical scenario of further medium-term weakening in the GBPUSD pair.
GBPUSD technical analysis
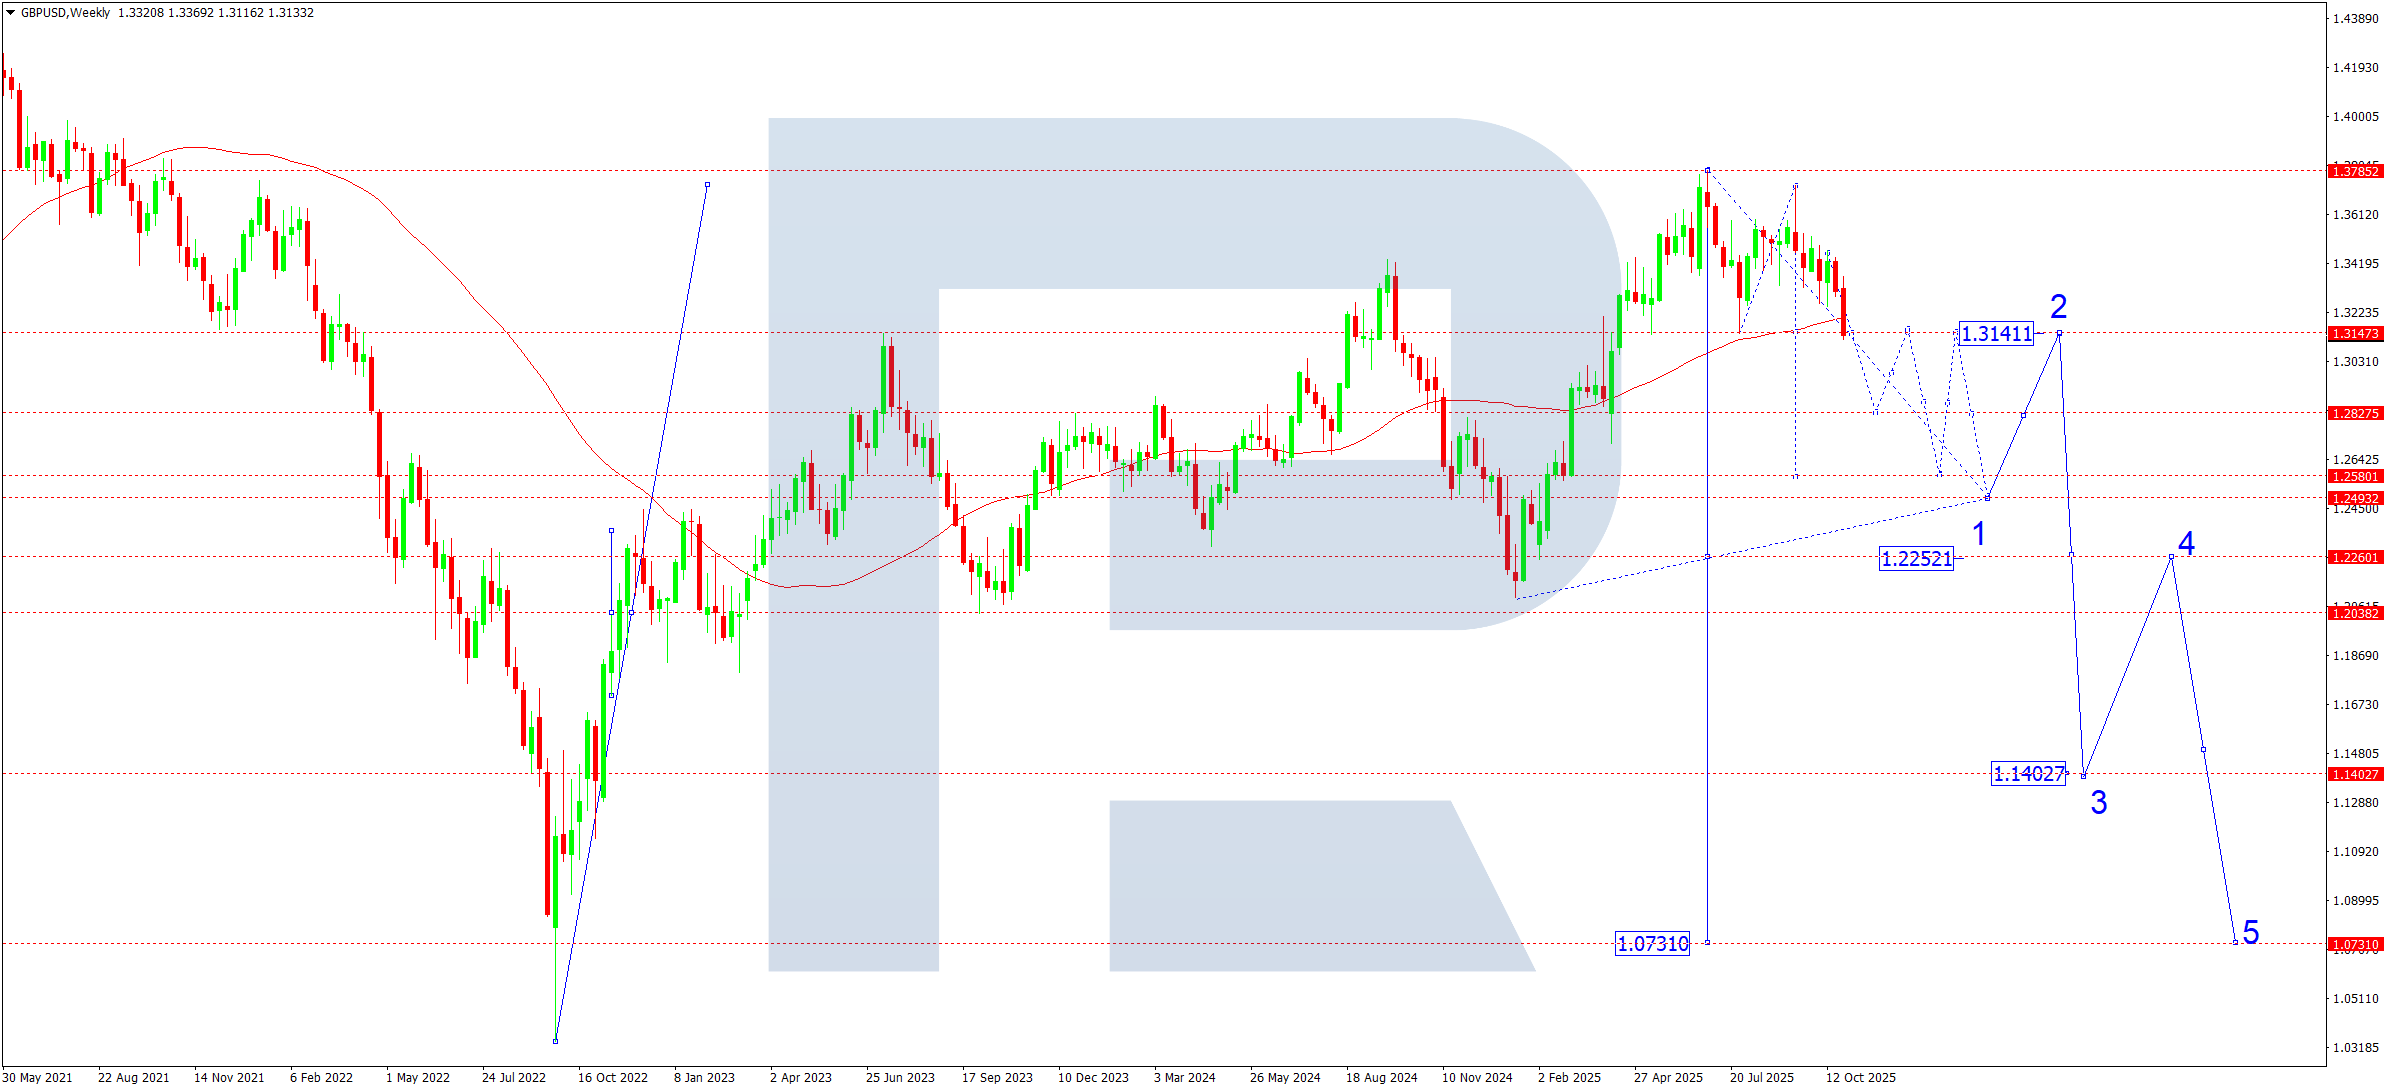
Technically, on the weekly chart, the GBPUSD pair formed a wide consolidation range around 1.3380 and decisively broke below it in October. The breakout below the 1.3140 level confirmed the completion of the corrective structure and opened potential for the development of the third downward wave in trend.
In November, the downward momentum could continue lower with a local target at 1.2580. After the pair reaches it, a corrective move up to 1.3140 could follow – a test of the breakout level from below.
Afterwards, the main downward wave could resume, aiming for 1.2490, and the next medium-term bearish impulse could form with a long-term target at 1.0731.
GBPUSD forecast scenarios for November 2025
Bearish (baseline) scenario: the impulsive move down after breaking below the 1.3140 level creates potential for declines to:
- 1.2828
- 1.2580 (main target for November)
After a correction towards 1.3140, the pair will likely continue its downward trajectory towards:
- 1.2490
- long-term trend target of 1.0731
Probability: high
Bullish (alternative) scenario: formation of a reversal impulse and a consolidation above 1.3460 on rising volumes will open the door for a move to:
- 1.3700 (corrective scenario, against the main trend)
Probability: low
AUDUSD forecast
In recent months, the Australian dollar has come under pressure amid a widening divergence in rate expectations:
- The Fed maintains a hawkish tone, keeping the likelihood of a longer period of high rates, which supports the USD as a yield-bearing currency
- The RBA, by contrast, signals a pause, fearing the impact of tightening on domestic demand and the labour market. The probability of further hikes is minimal, with the market pricing in possible policy easing in 2026
This monetary divergence creates a steady capital flow towards the USD, intensifying pressure on the AUD and supporting the bearish technical scenario.
- China remains Australia’s largest trading partner, so any slowdown in Chinese manufacturing or a decline in construction activity feeds directly into AUD dynamics
AUDUSD technical analysis
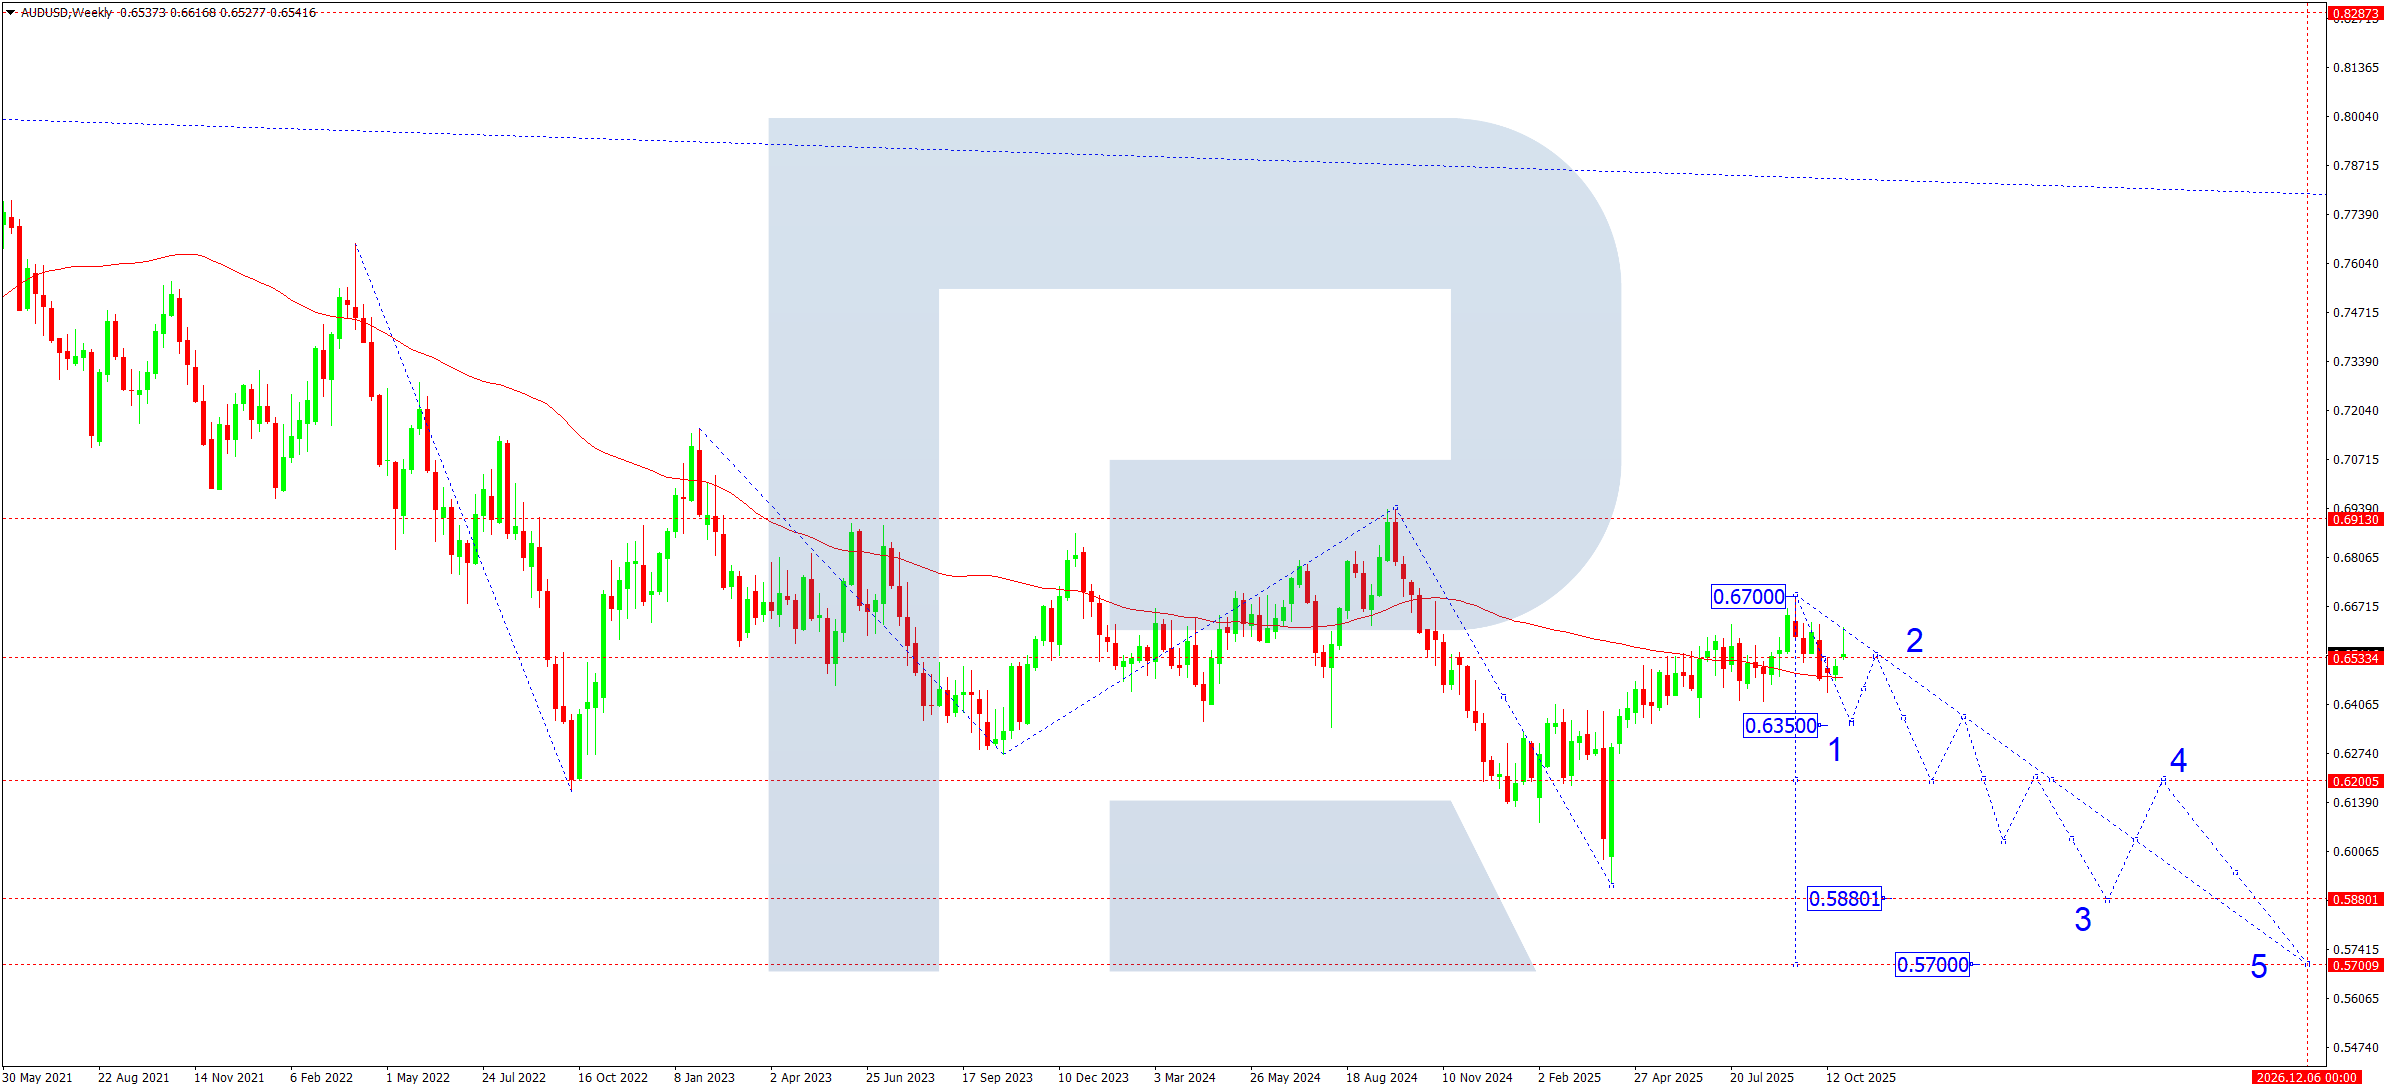
On the weekly chart, the AUDUSD pair completed a downward move to 0.6434 and built a corrective leg up to 0.6533. A local consolidation range has formed around this level, which the market uses as a potential pivot point for November’s structure.
In November, we expect:
- The decline to continue towards 0.6350 as the first target.
This completes the first part of the current impulse
- A corrective move up to 0.6533 (testing from below). A compact correction is expected to form within the wave-2 structure
- A new decline towards 0.6200. This is the base target for the third wave
- Continued fall to 0.5880 as the local target of the entire current structure
The level corresponds to the lower boundary of the medium-term fifth wave shown on the chart. The 1–2–3–4–5 movement structure on the chart fully aligns with the outlook for a downtrend into year-end.
AUDUSD forecast scenarios for November 2025
Bearish (baseline) scenario: consolidation below 0.6530 opened potential for a decline towards 0.6350. Additional pressure from commodity markets can accelerate the impulse, increasing the likelihood of reaching 0.5880 as the key monthly target.
Bullish (alternative) scenario: a breakout above the 0.6630 resistance level may push the market into a medium-term correction. The upside target lies at 0.6700, an important technical and psychological zone.
USDCAD forecast
November opens under conditions of sustained US dollar dominance and a weak Canadian dollar. The fundamental picture creates a pronounced bias towards further USDCAD gains.
- Federal Reserve
The US economy remains robust: strong labour market, resilient consumption, and slow easing of core inflation. The Fed maintains hawkish rhetoric and does not plan near-term policy easing. Demand for the USD remains steady.
- Bank of Canada
Canada is slowing in key sectors. The BoC maintains a dovish tone, and the market already prices in a high risk of a rate cut in Q1 2026. US-Canada policy divergence increases pressure on the CAD.
- Oil
In November, CAD’s correlation with oil is weaker. Weak global demand, OPEC+ uncertainty, and rising US inventories cap commodities. Oil is not providing a base for CAD strength. The November backdrop points to USD’s advantage over the CAD and supports development of an upward wave in the USDCAD pair with a view to trend continuation.
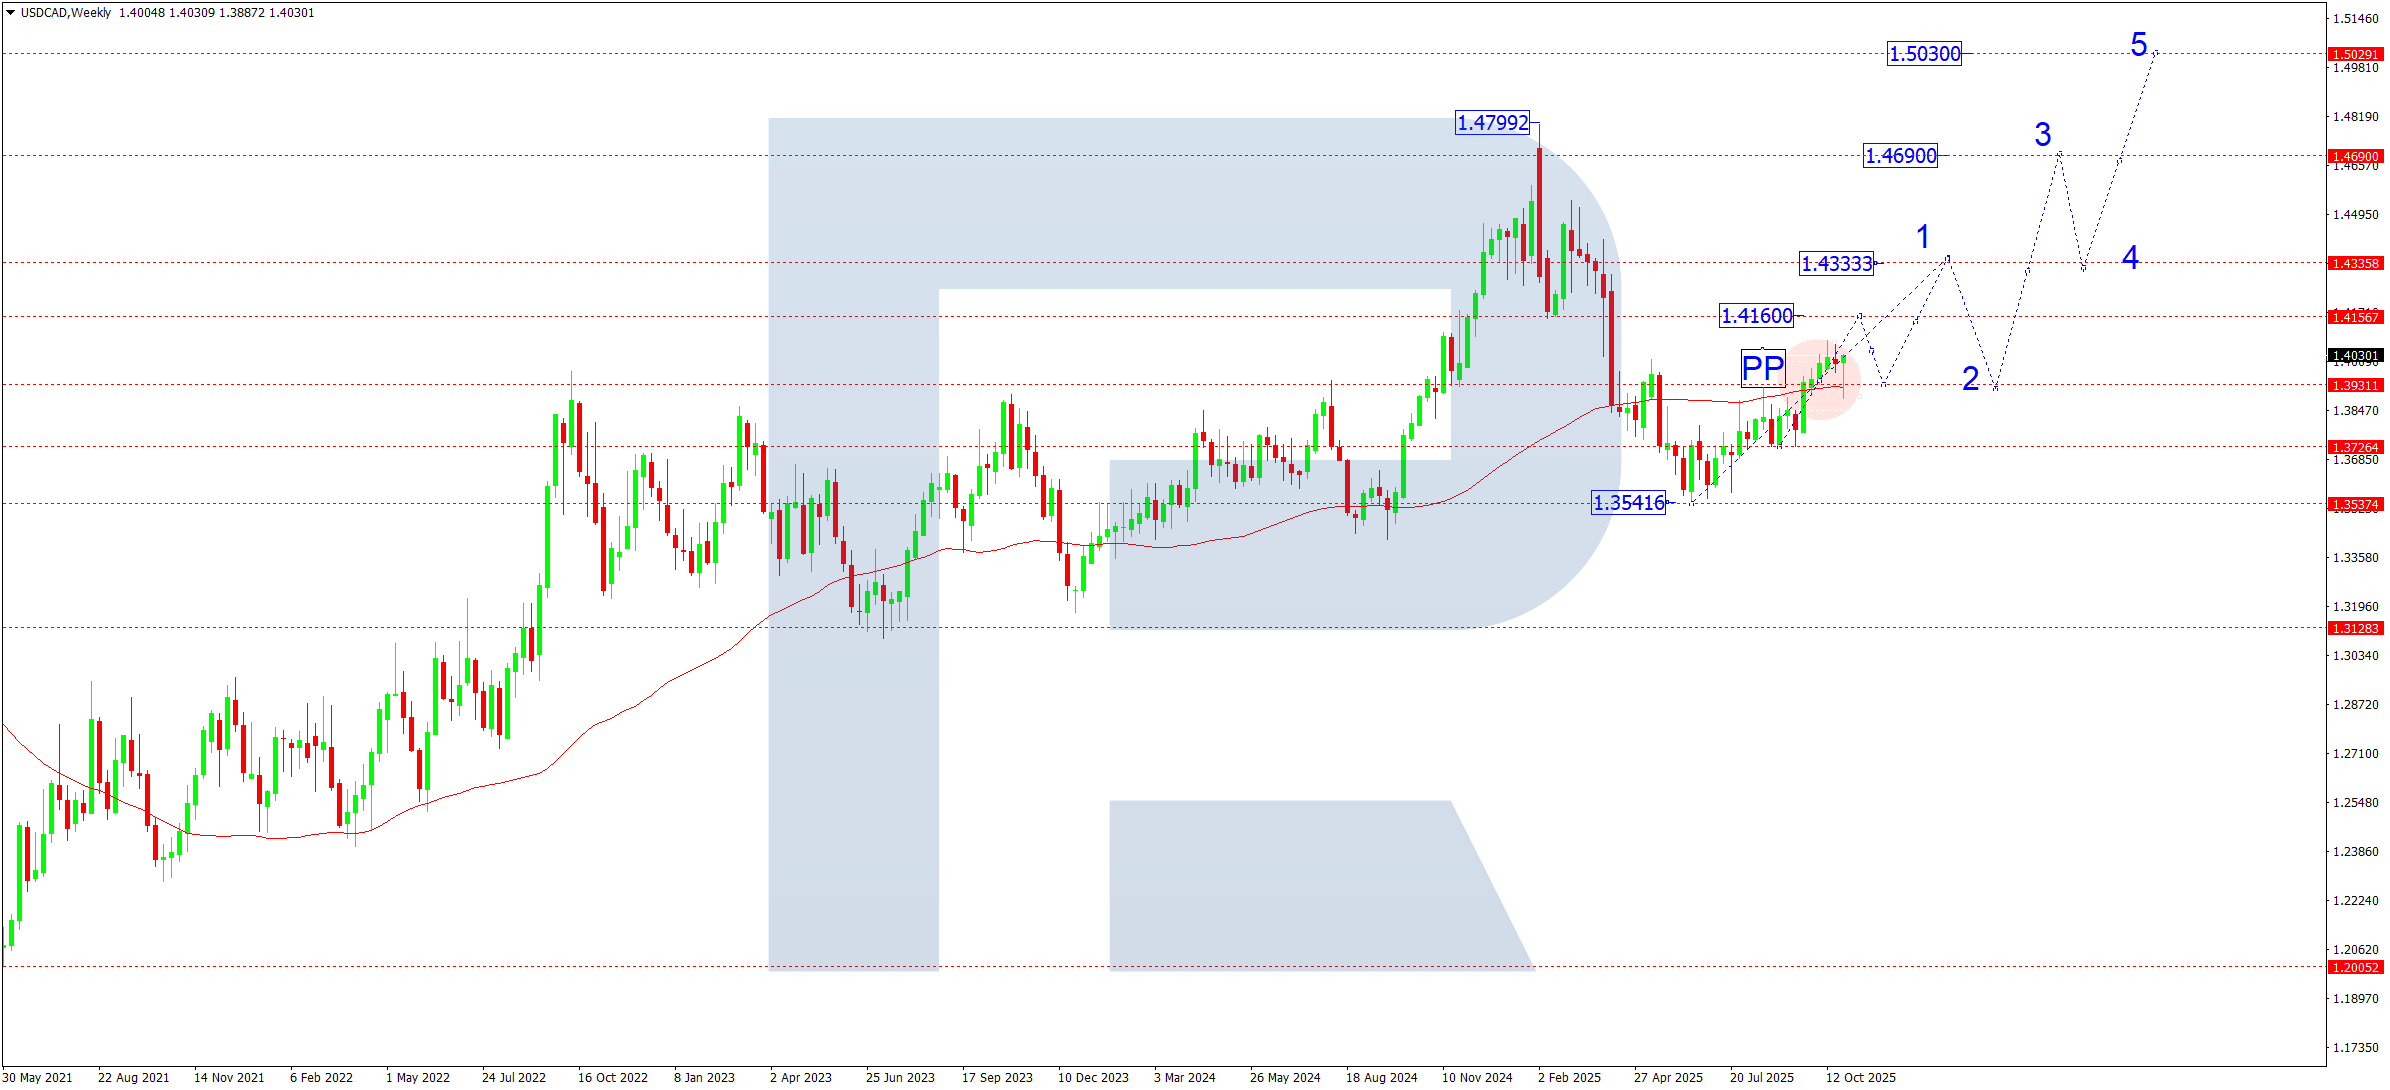
USDCAD technical analysis
The USDCAD pair broke 1.3930 (SMA50) and formed a consolidation range around this level. The market structure remains bullish.
In November, we expect:
- an upside breakout from the consolidation and development of the first growth wave to 1.4333, the month’s local target
- after reaching 1.4333, a corrective move to 1.3933 (test of the SMA50 zone) is possible. Once the correction is complete, the next upward wave is anticipated, targeting 1.4690
- the long-term structure retains expansion potential to 1.5030
The uptrend remains intact as long as the price trades above the SMA50.
USDCAD forecast scenarios for November 2025
Bullish (main) scenario: a breakout and consolidation above the 1.3930 area confirm further development of the growth structure with targets at 1.4160, 1.4333, 1.4690, and 1.5030. The bullish structure holds while the price is above the SMA50.
Bearish (alternative) scenario: a breakout and consolidation below 1.3930 on rising volumes will open potential for a continuation down to 1.3730.
XAUUSD forecast
Markets expect the Fed to keep rates in a tight range for a while longer. Inflationary pressure in the US remains above target, and Fed officials’ comments stay hawkish. For gold, this creates short-term downside risks, as high rates make the dollar more attractive. However, as the US economy slows, the probability of policy easing in early 2026 rises, which would be a strong catalyst for a new major upswing in the precious metal.
Global flashpoints persist: the Middle East, Asia, and Europe. Any increase in geopolitical risk instantly boosts demand for safe-haven assets, including gold. This is a supportive factor in the medium term.
Central banks in developing countries continue to increase gold reserves. Gold purchases remain steady in 2025, offsetting partial pressure from a strong dollar. The US stock market remains overheated, increasing the likelihood of a correction. Any new downward movement in stock indices tends to push gold higher.
Conclusion: the fundamental backdrop is mixed, with headwinds (high rates) dominating in the short term. However, in the medium term, gold has a strong base to rise to new all-time highs.
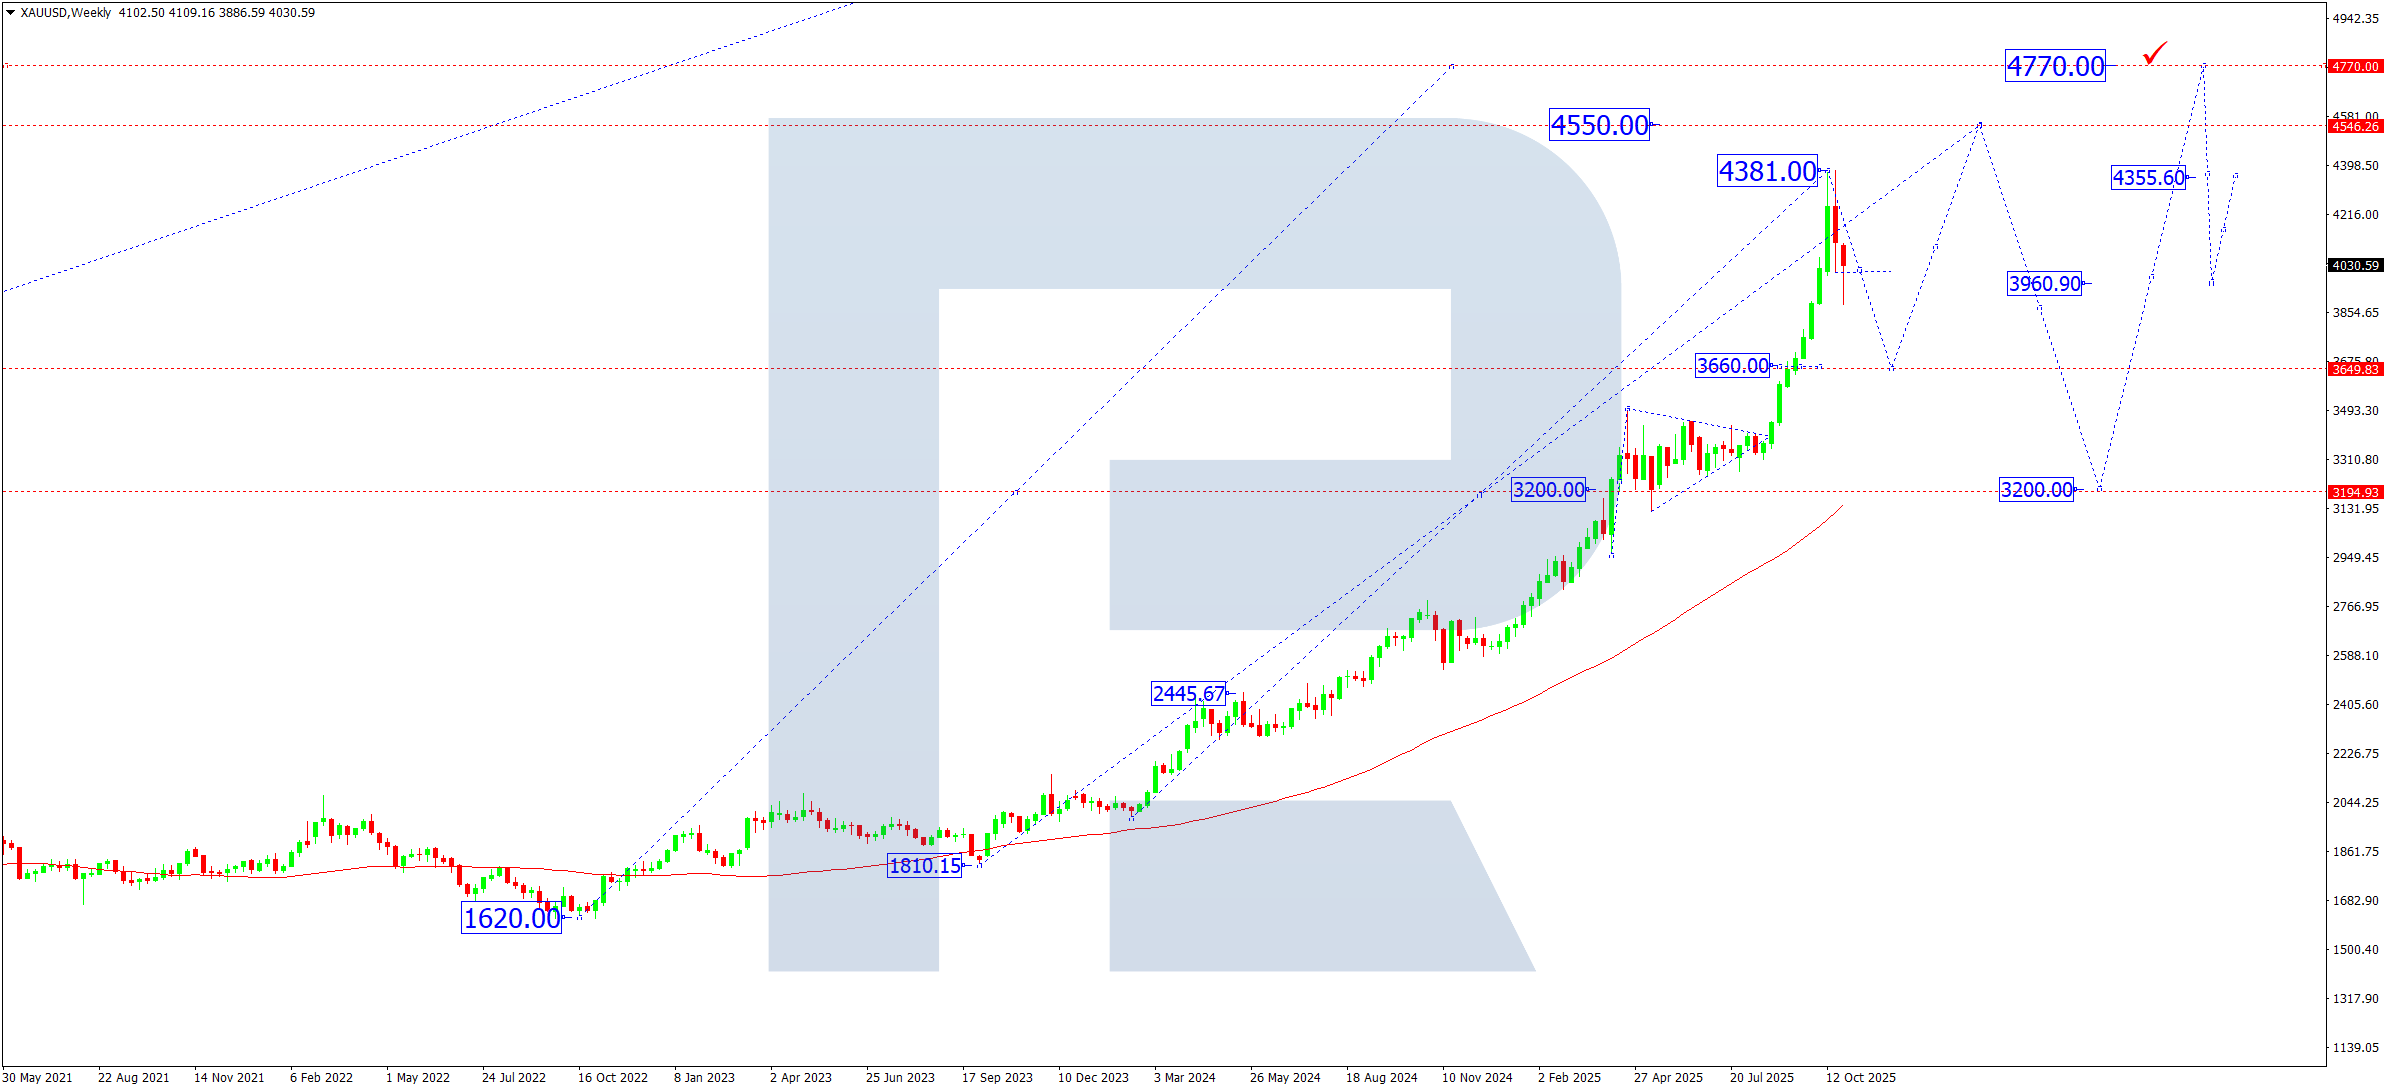
XAUUSD technical analysis
On the weekly chart, the market broke below the 4,004 level and formed a reversal structure for a correction. In the current phase, gold is consolidating around 4,004, gradually expanding the range lower. In November, the market suggests considering the chance of another impulse down towards 3,660. This level is a key support zone both in the wave structure and in the market’s matrix model. After this correction completes at 3,660, a base is expected to form for a new medium-term trending move with targets at 4,550 and then 4,770.
XAUUSD forecast scenarios for November 2025
Bullish (baseline) scenario: the decline to 3,660 is viewed as the completion of the entire correction. A rebound from this level opens upside potential to 4,550, and, in case of a breakout, to the medium-term target at 4770. This scenario aligns with the fundamental expectation of Fed easing in 2026.
Bearish (alternative) scenario: the breakout below the 4,004 level has already activated a medium-term correction. If pressure on the metal increases, the decline may extend to the next support zone at 3,200. This option is possible with a stronger dollar and no signs of a US slowdown.
Brent forecast
In November, the oil market remains sensitive to the balance between OPEC+ decisions and global economic dynamics. Market participants’ main focus:
- OPEC+:
Key producers within the alliance continue to adhere to strict quota discipline. However, against a backdrop of falling commercial inventories in the US, pressure is increasing for a possible review of restrictions at the start of the winter season. The 100 USD per barrel level remains a psychologically significant benchmark for the cartel – above it, discussions of loosening quotas are likely; below it, rhetoric to support the market intensifies.
- Demand from major importers:
China shows signs of stabilising industrial activity, which supports a recovery in oil imports. India maintains historically high demand, partly offsetting Europe’s weakness.
- Macroeconomic conditions:
Markets expect looser monetary conditions in H1 2026, which provides additional support for commodities. Geopolitical risks in the Middle East remain elevated, increasing the risk premium and supporting oil prices.
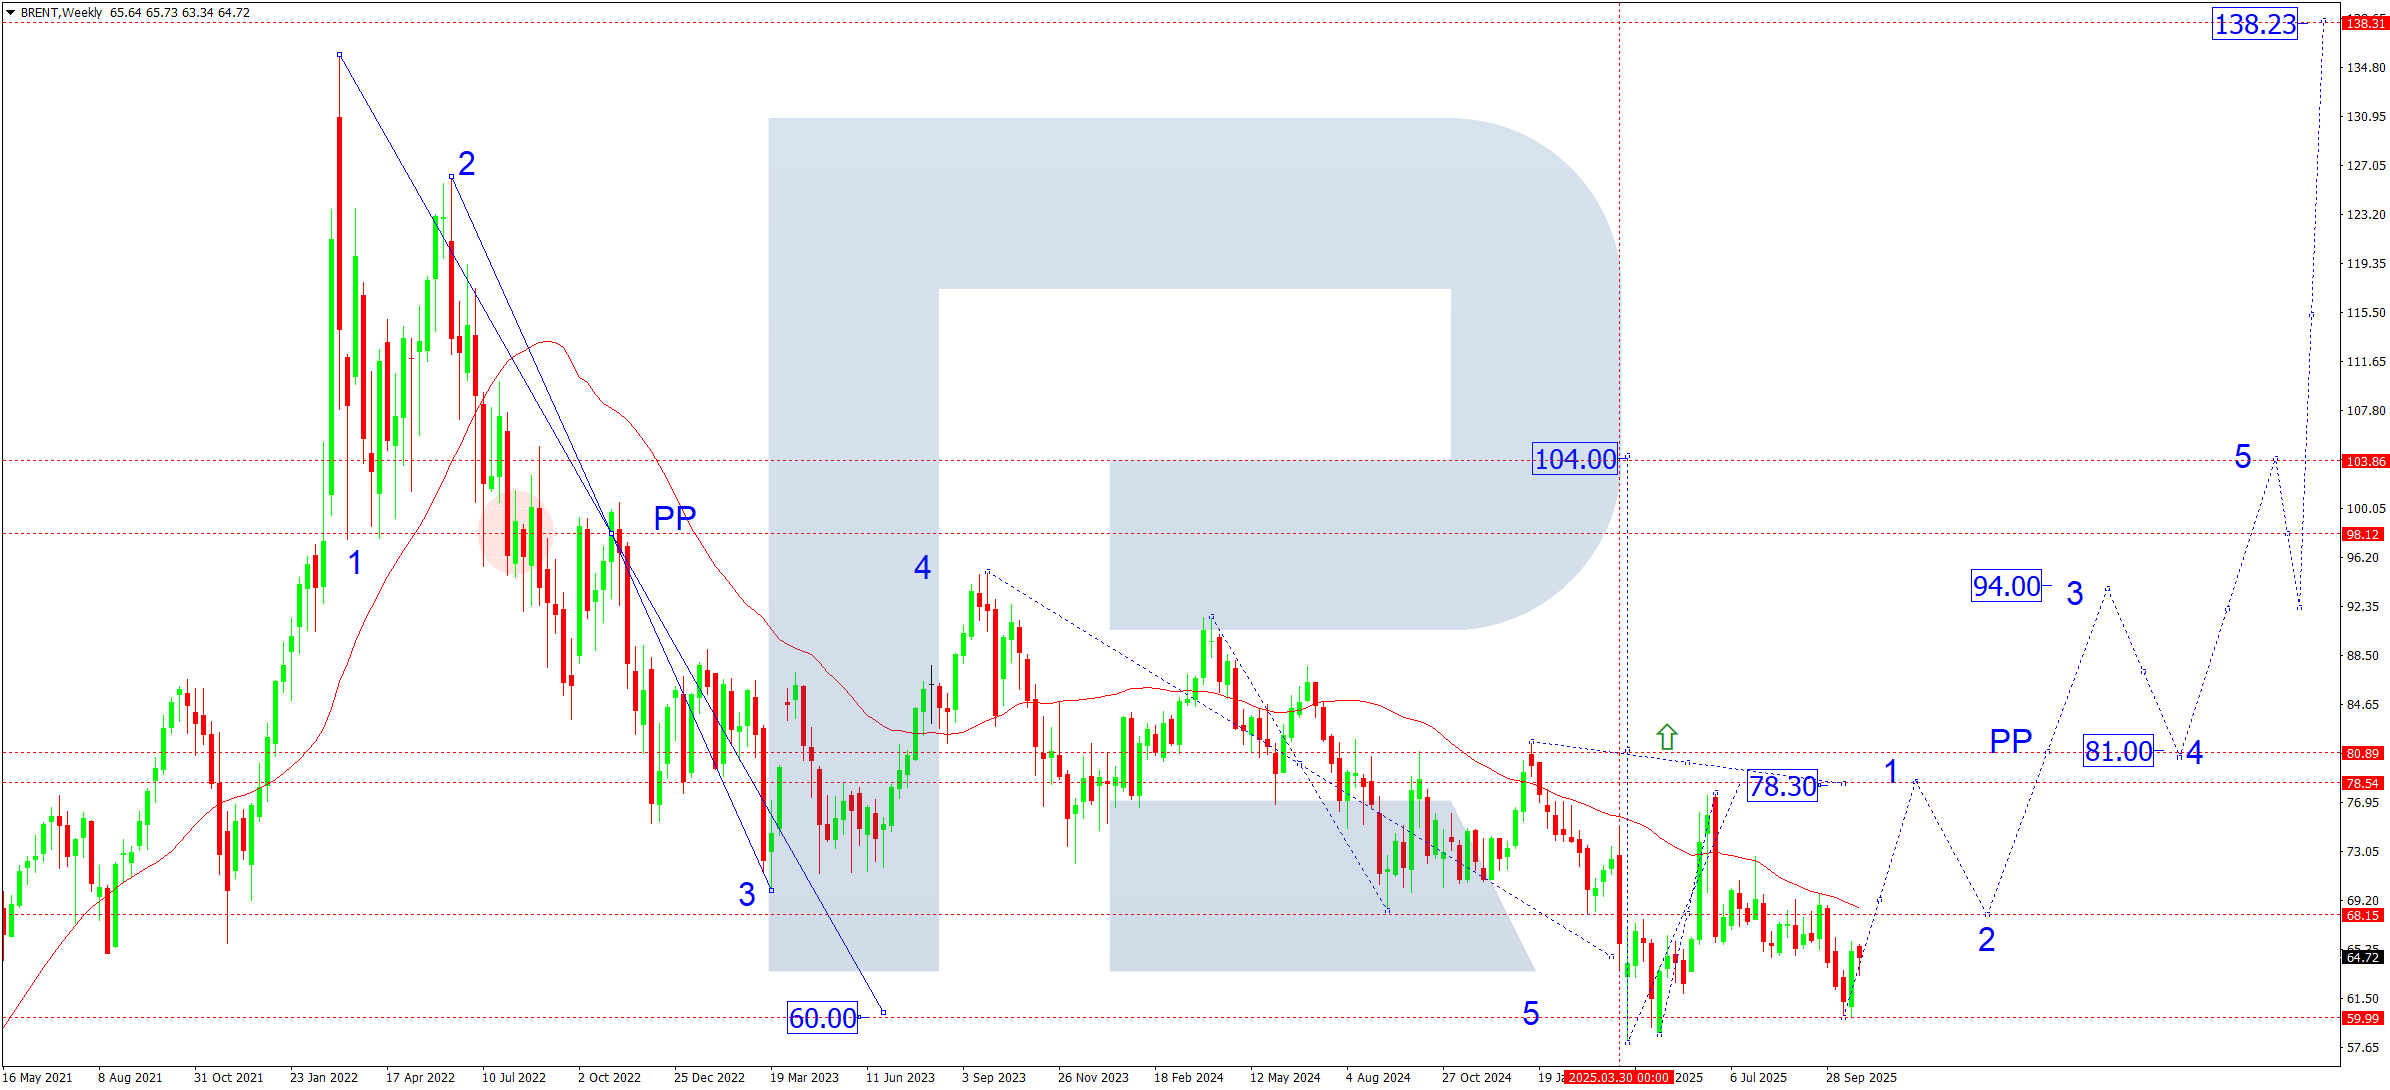
Brent technical analysis
On the weekly chart, Brent has completed the fourth corrective wave and moved on to developing the fifth wave of growth. The upward move is confirmed by breaks of local resistance levels and a steady formation of higher lows. In October, an impulse formed towards 69.20, which is the nearest local target. The five-wave upward structure remains valid, with the main strategic target at 104.00.
In November, we expect:
- A rise to 69.20, the first target of the month
- After it is reached, a corrective pullback to 68.00 is likely as the second target within the structure. If the broader uptrend persists, the market will aim for the key levels of 78.30, 94.00, and 104.00
Brent forecast scenarios for November 2025
Bullish (main) scenario: if prices hold above 69.00 and geopolitical instability persists, the market may continue to rise. If Brent crude breaks the 81.00 consolidation zone, trend acceleration becomes likely:
- first target: 78.30
- second target: 94.00
- third target: 104.00
The 100.00 level, traditionally important for OPEC+, remains the boundary for possible quota changes.
Bearish (alternative) scenario: with weak global economic data and no new OPEC+ initiatives, the market may return to the 60.00 area, with a possible deeper test of the 59.00 level
Forecasts presented in this section only reflect the author’s private opinion and should not be considered as guidance for trading. RoboForex bears no responsibility for trading results based on trading recommendations described in these analytical reviews.