Daily technical analysis and forecast for 20 February 2026
Here is a detailed daily technical analysis and forecast for EURUSD, USDJPY, GBPUSD, AUDUSD, USDCAD, XAUUSD, and Brent for 20 February 2026.
EURUSD forecast
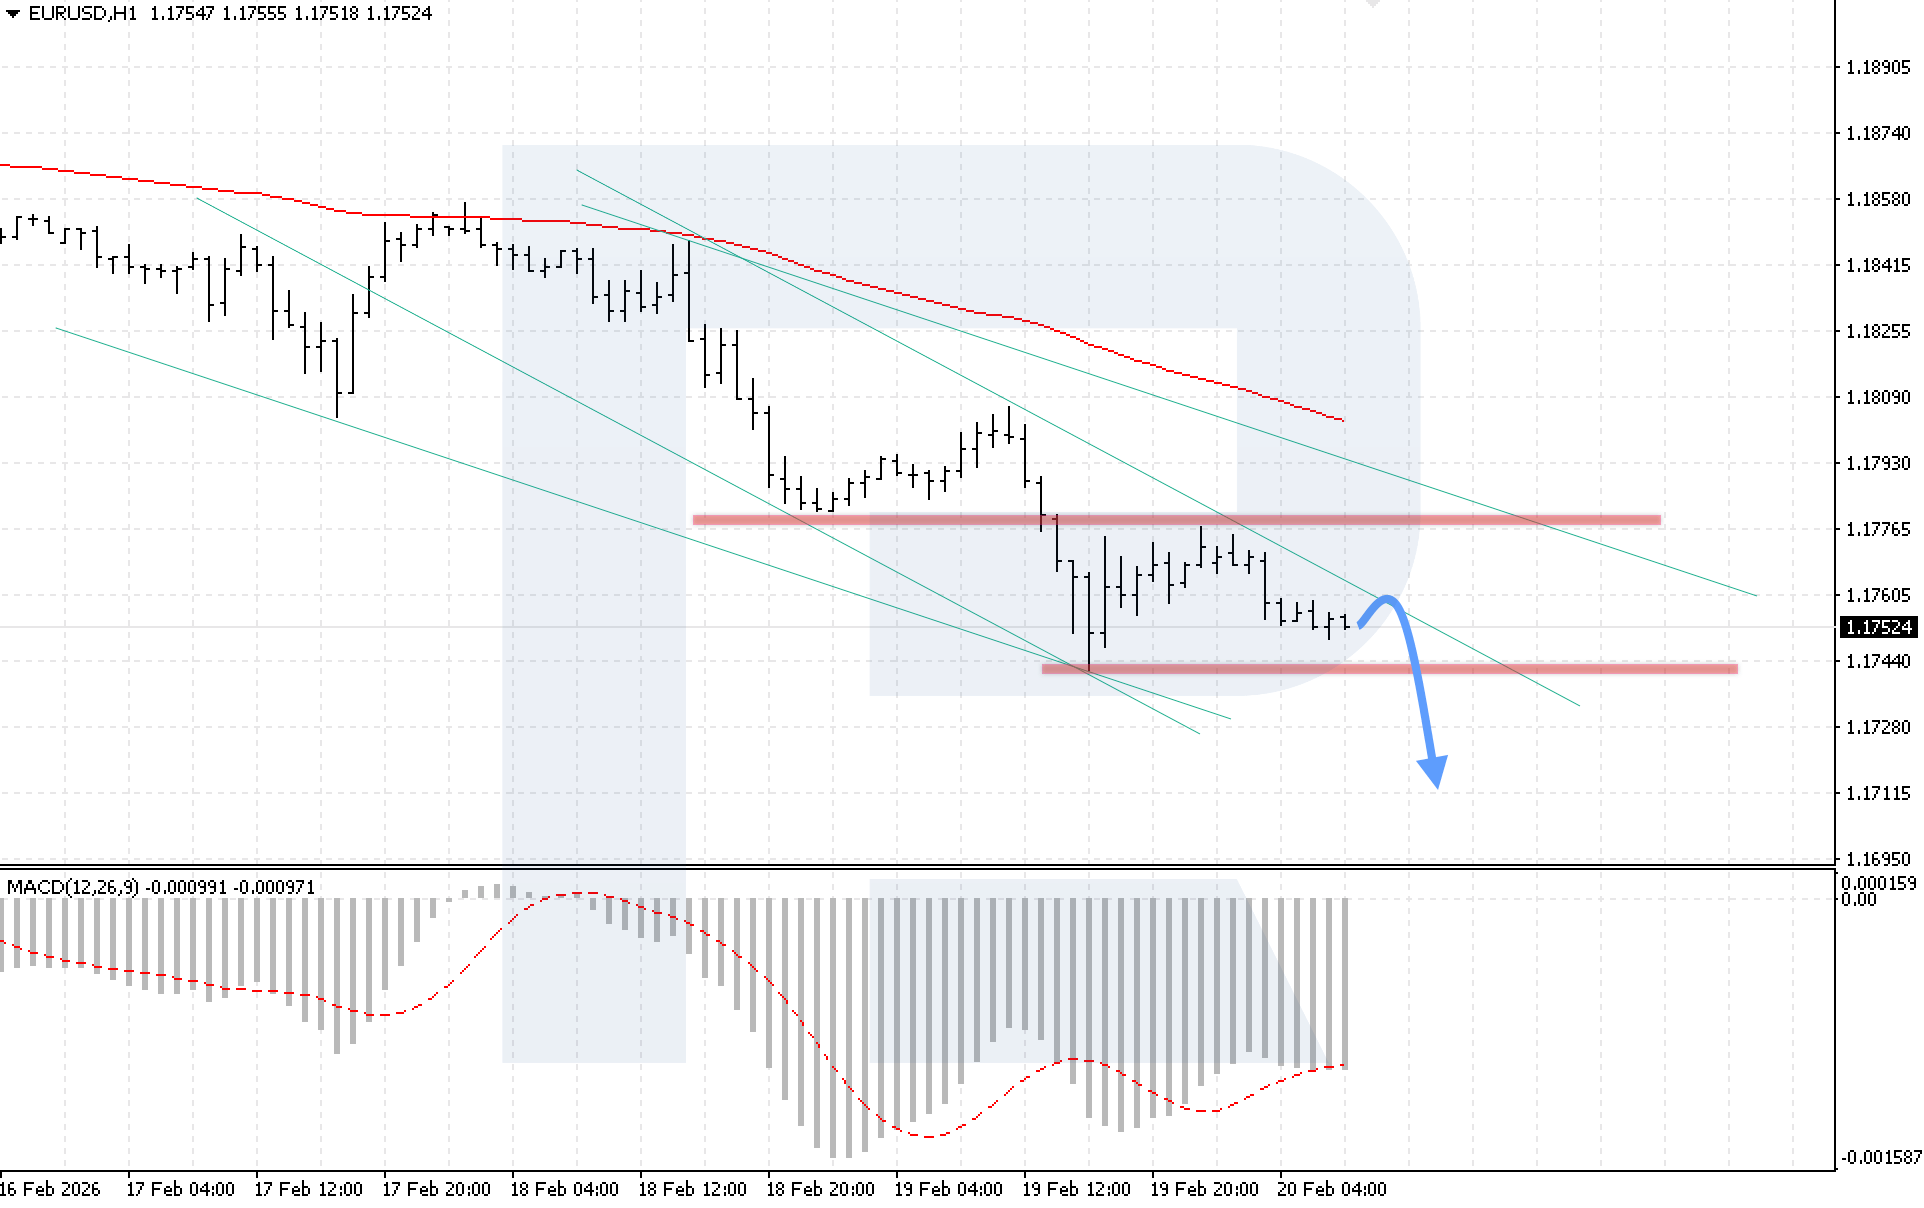
On the H1 chart of the EURUSD currency pair, the market continues its downward momentum despite the formation of a bullish divergence on MACD amid positive US data. Today, 20 February 2026, the baseline scenario remains a rebound from the upper boundary of the descending channel, followed by a decline towards 1.1710.
The technical picture confirms this scenario. The MACD histogram is contracting, indicating strengthening bearish pressure. The key condition for further decline will be firm consolidation below the local support level at 1.1745.
The alternative scenario is possible if quotes rise above 1.1775. In this case, a breakout above the upper boundary of the channel will add to bullish pressure and may lead to renewed upward momentum.
USDJPY forecast
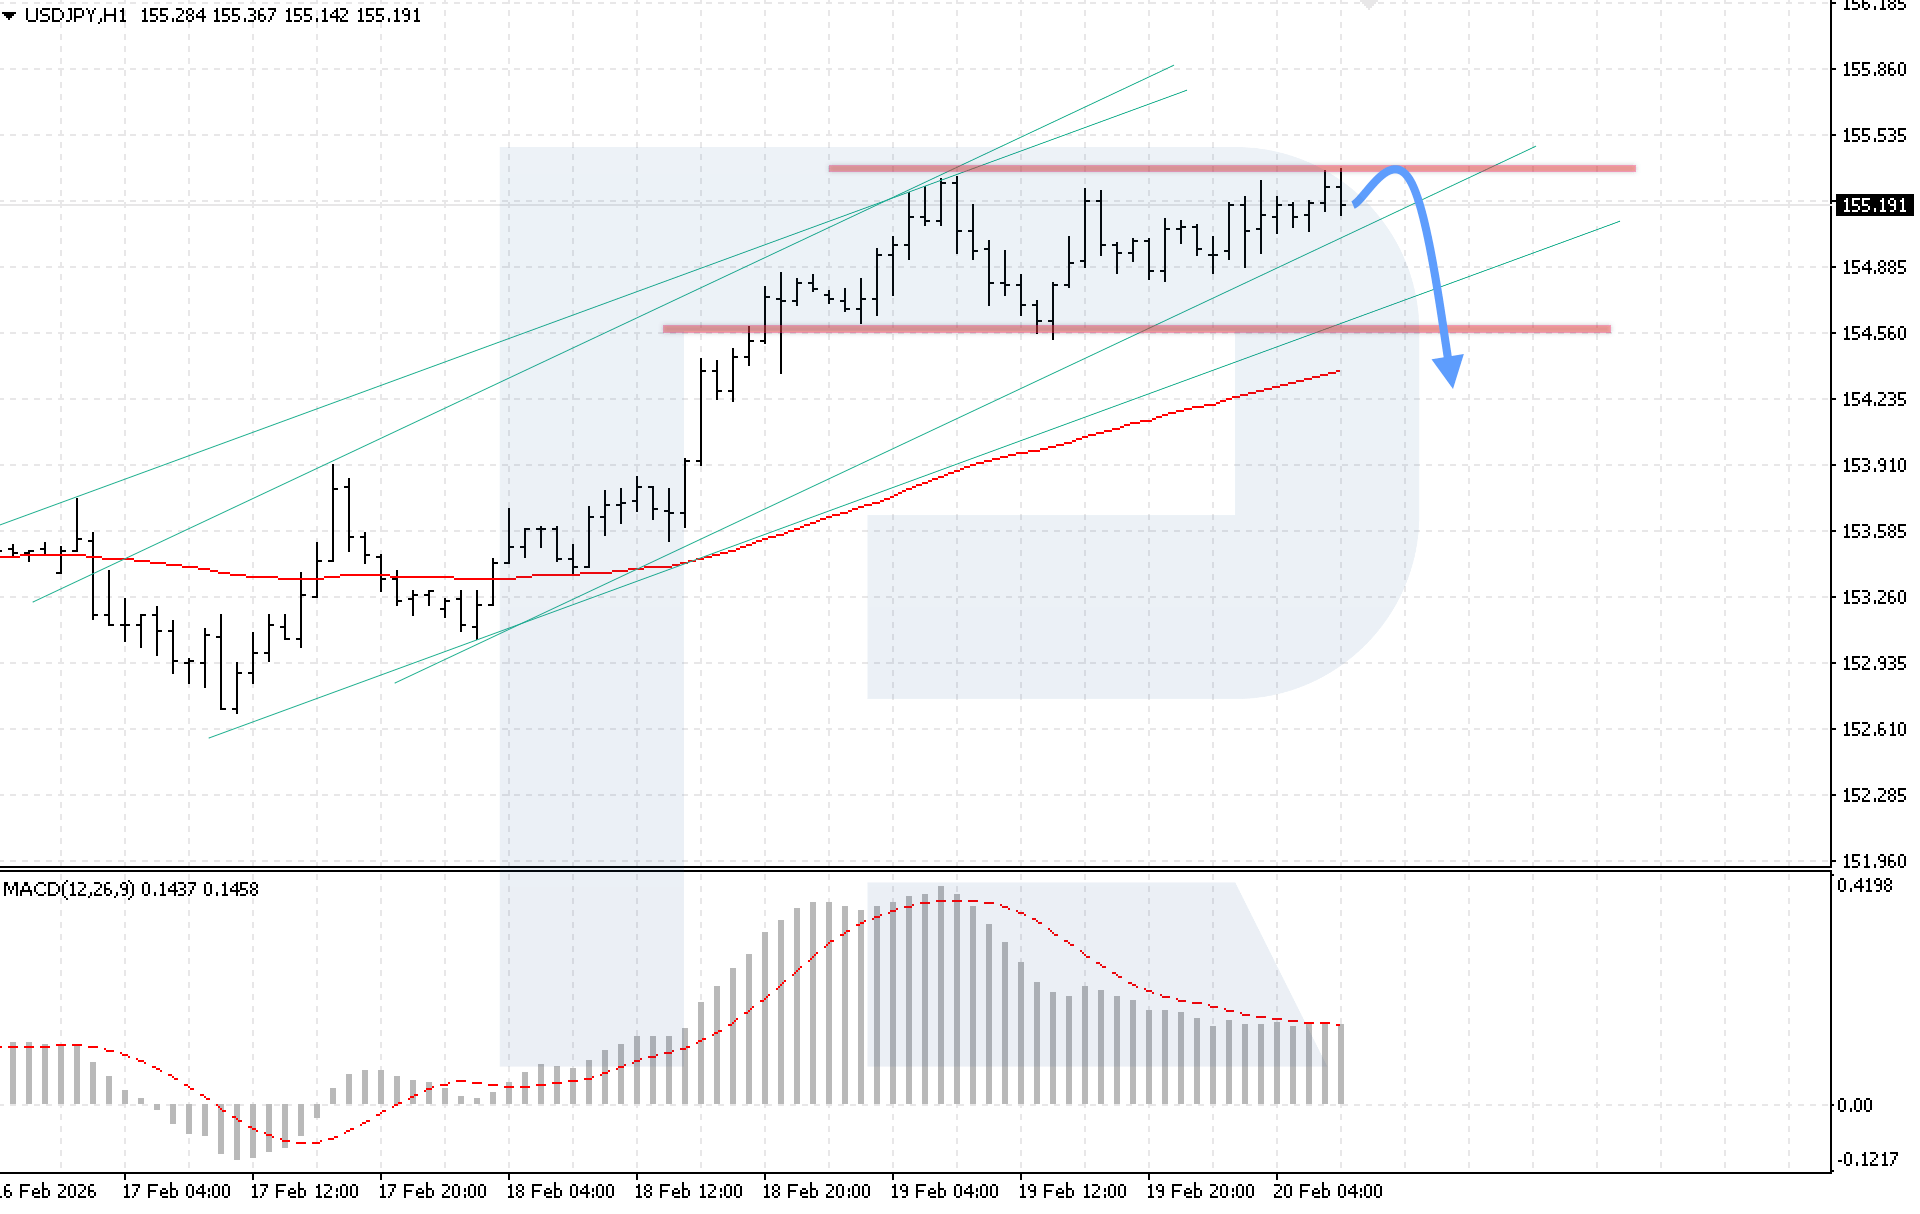
On the H1 chart of the USDJPY currency pair, the market is testing the key resistance level; however, there is a risk of a decline following the formation of a bearish divergence on MACD. Today, 20 February 2026, the baseline scenario remains a rebound from resistance, followed by a decline towards the 155.25 support level and a possible move further down to 154.25.
The technical picture confirms the bearish scenario. The MACD histogram is contracting, while a bearish divergence is observed. The key condition for the decline will be a breakout below the lower boundary of the bullish channel with consolidation below 154.85.
The alternative scenario will activate if the price breaks above the resistance level and consolidates above 155.55. Such a signal would indicate renewed upward momentum in USDJPY.
GBPUSD forecast
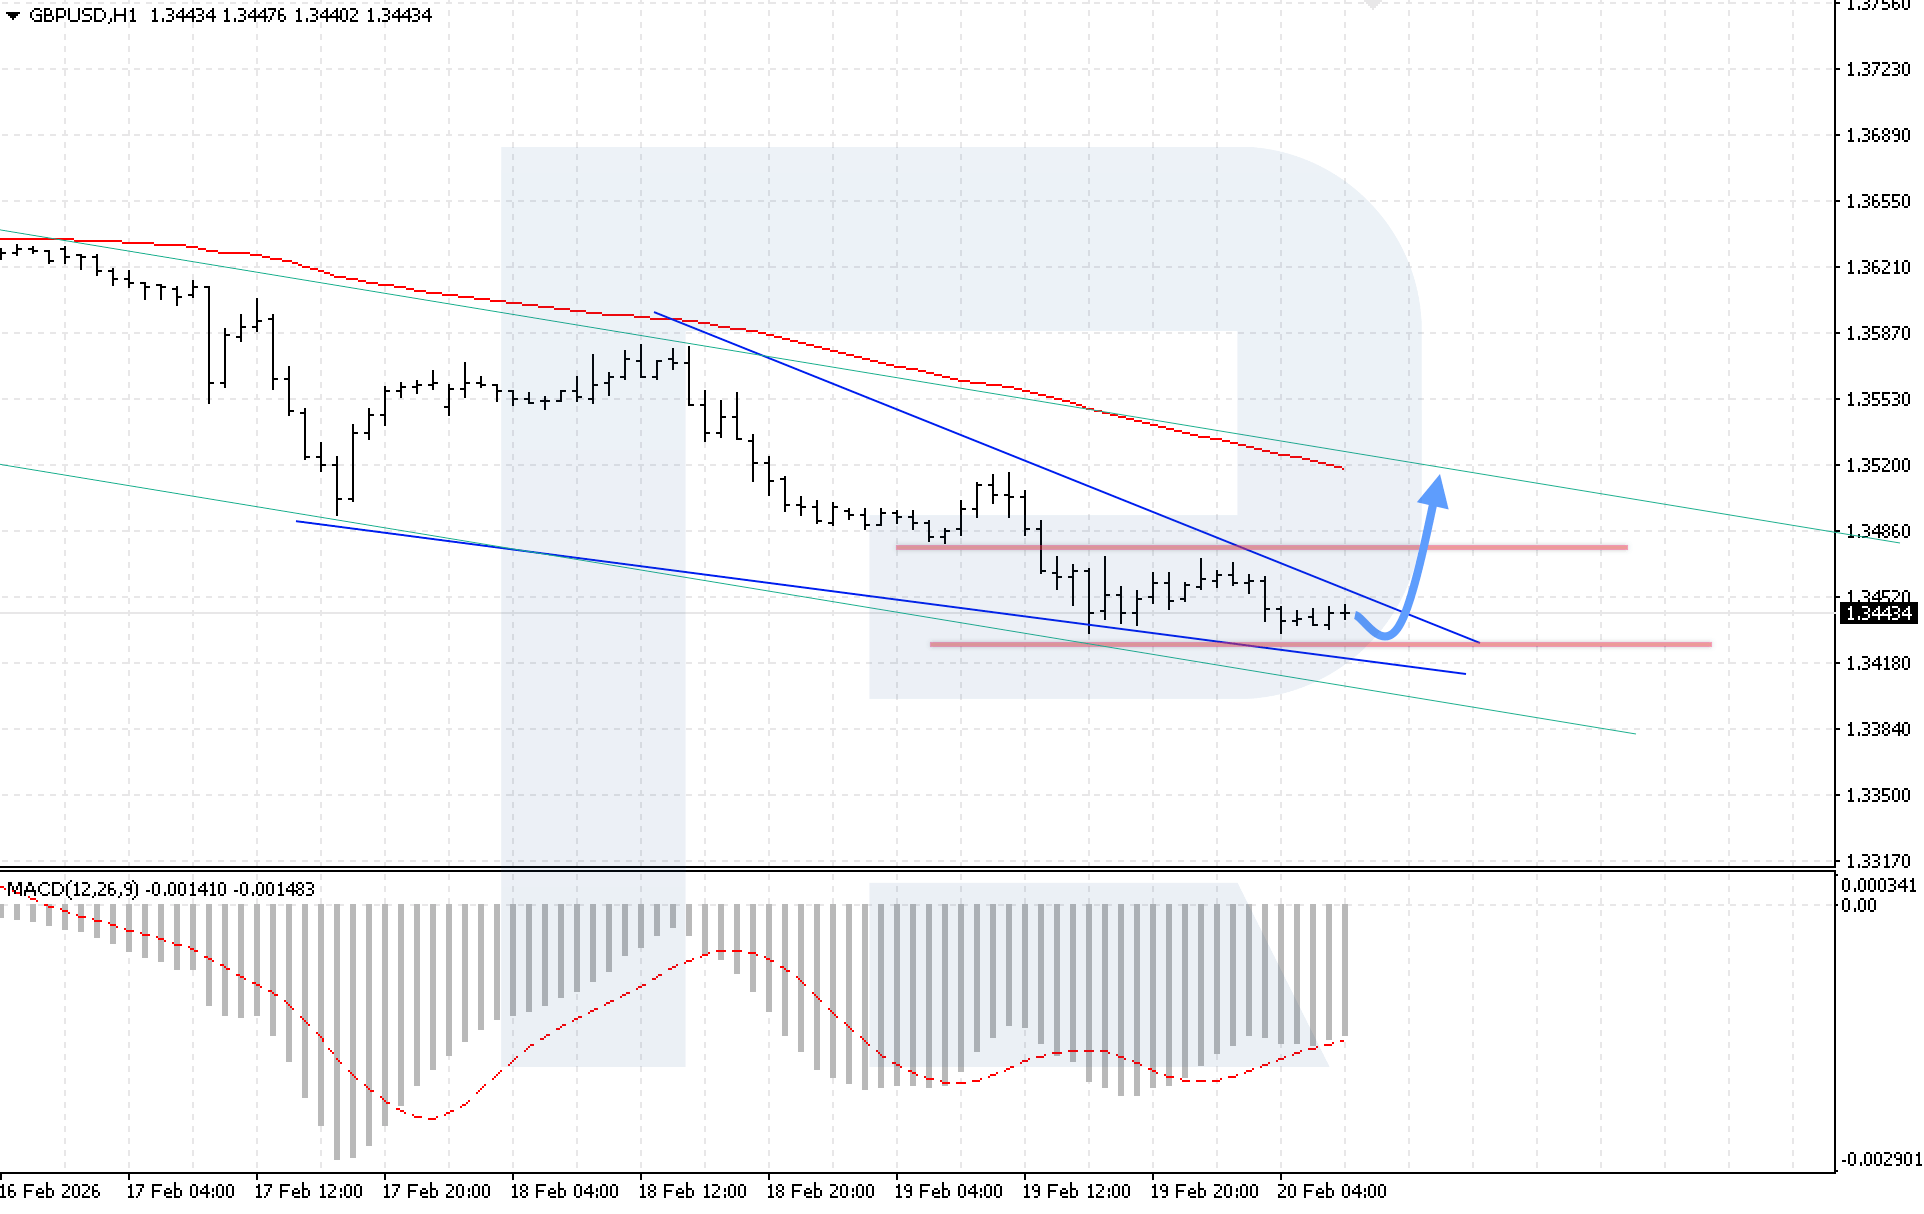
On the H1 chart of the GBPUSD currency pair, quotes continue to move downwards while forming a Wedge reversal pattern. Today, 20 February 2026, buyers have rebounded from the lower boundary of the formation. The baseline scenario suggests growth with subsequent implementation of the pattern and a target at 1.3520.
The technical picture confirms this scenario. The MACD indicator shows a rising histogram and the formation of a bullish divergence. The key condition for continued growth will be consolidation above 1.3465, confirming a breakout above the upper boundary of the Wedge.
The alternative scenario will activate if the lower boundary of the reversal pattern is broken with consolidation below 1.3415. Such a signal would indicate renewed downward movement in GBPUSD.
AUDUSD forecast
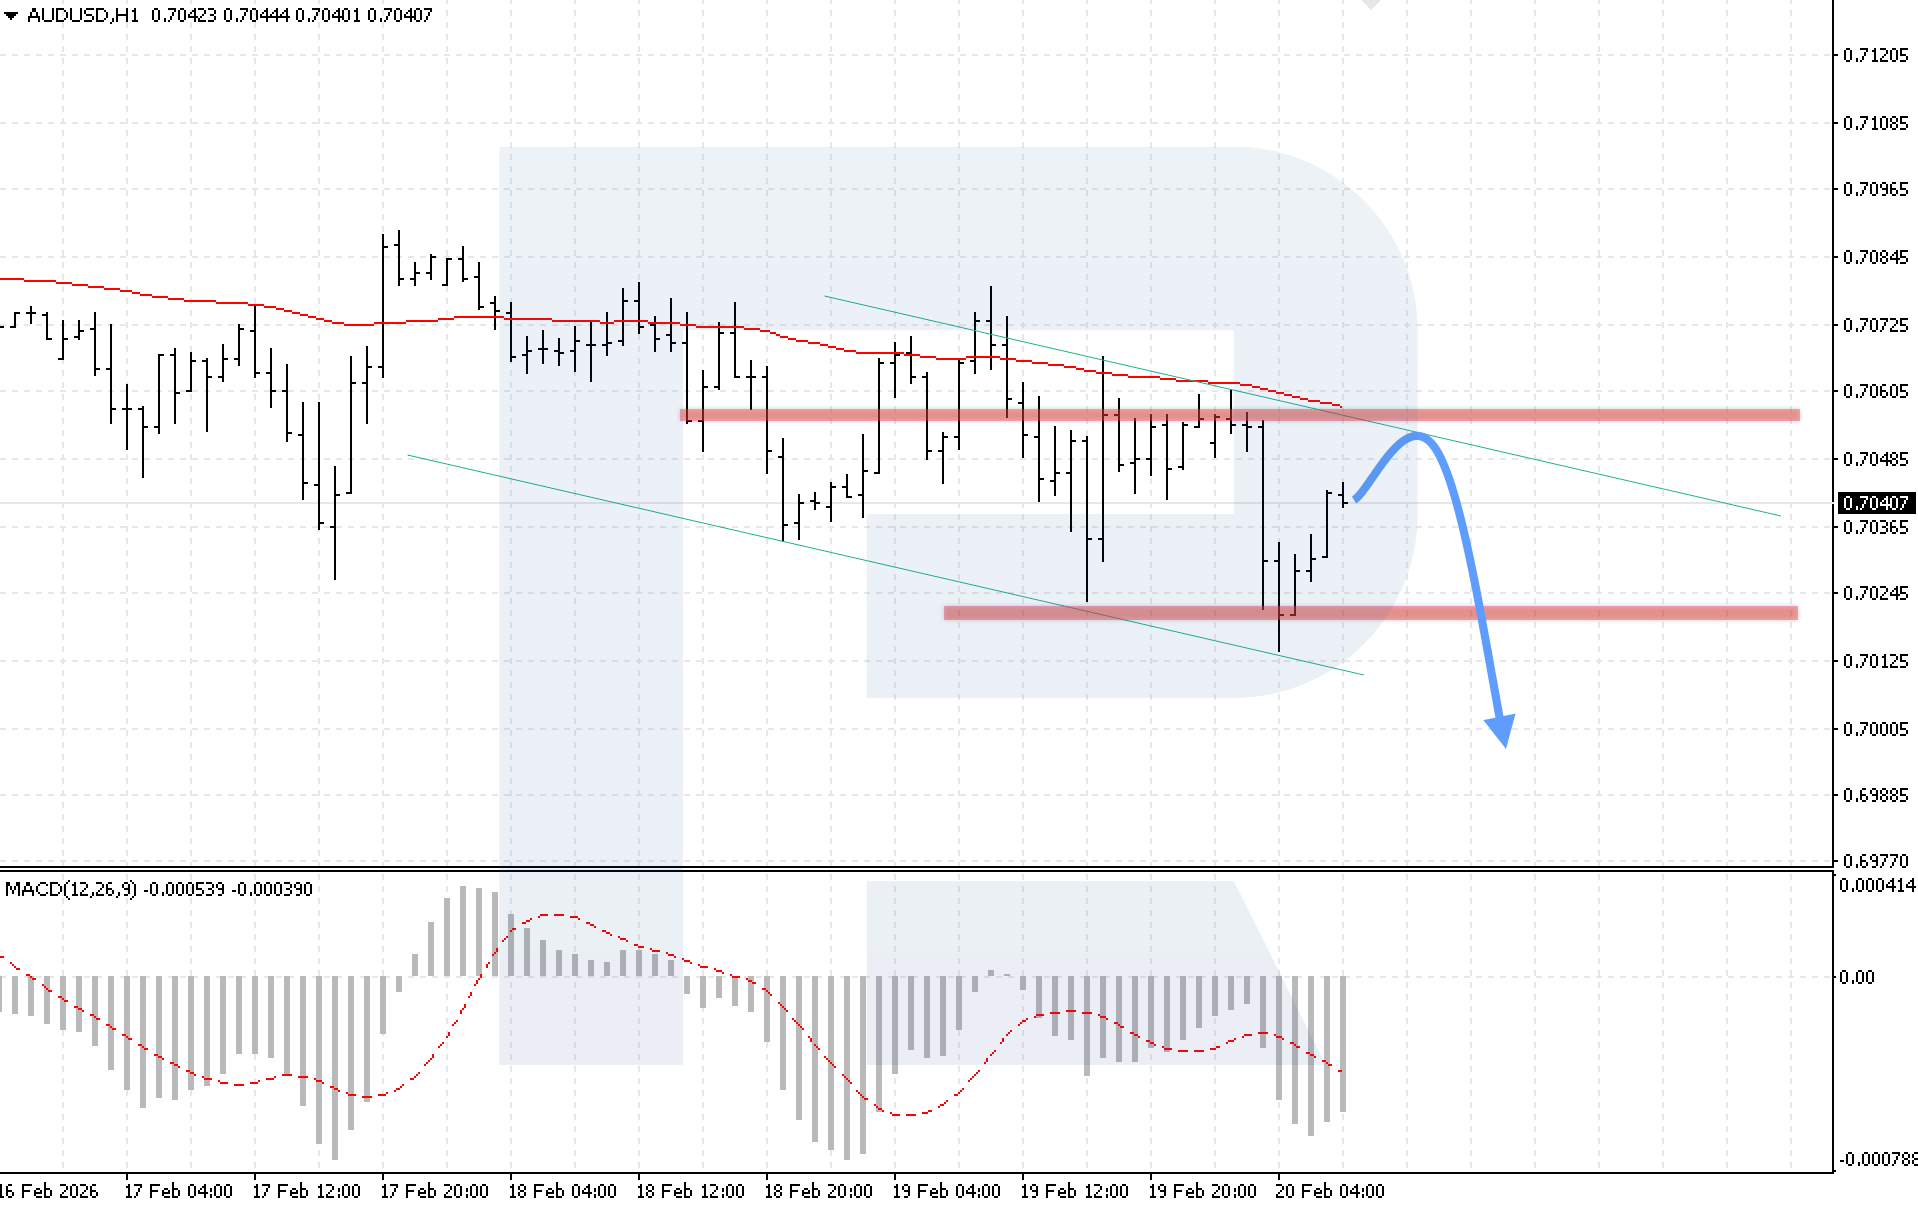
The H1 chart of the AUDUSD currency pair shows a correction after a rebound from the upper boundary of the descending channel. For today, 20 February 2026, the baseline scenario suggests further decline towards 0.7005.
The technical picture confirms this scenario: the MACD indicator shows that bears have invalidated the bullish divergence, increasing pressure on the price. The key condition for the decline will be consolidation below 0.7025.
The alternative scenario will activate if the price rises sharply and breaks above 0.7065. Such a signal would indicate a possible breakout above the upper boundary of the descending channel in AUDUSD.
USDCAD forecast
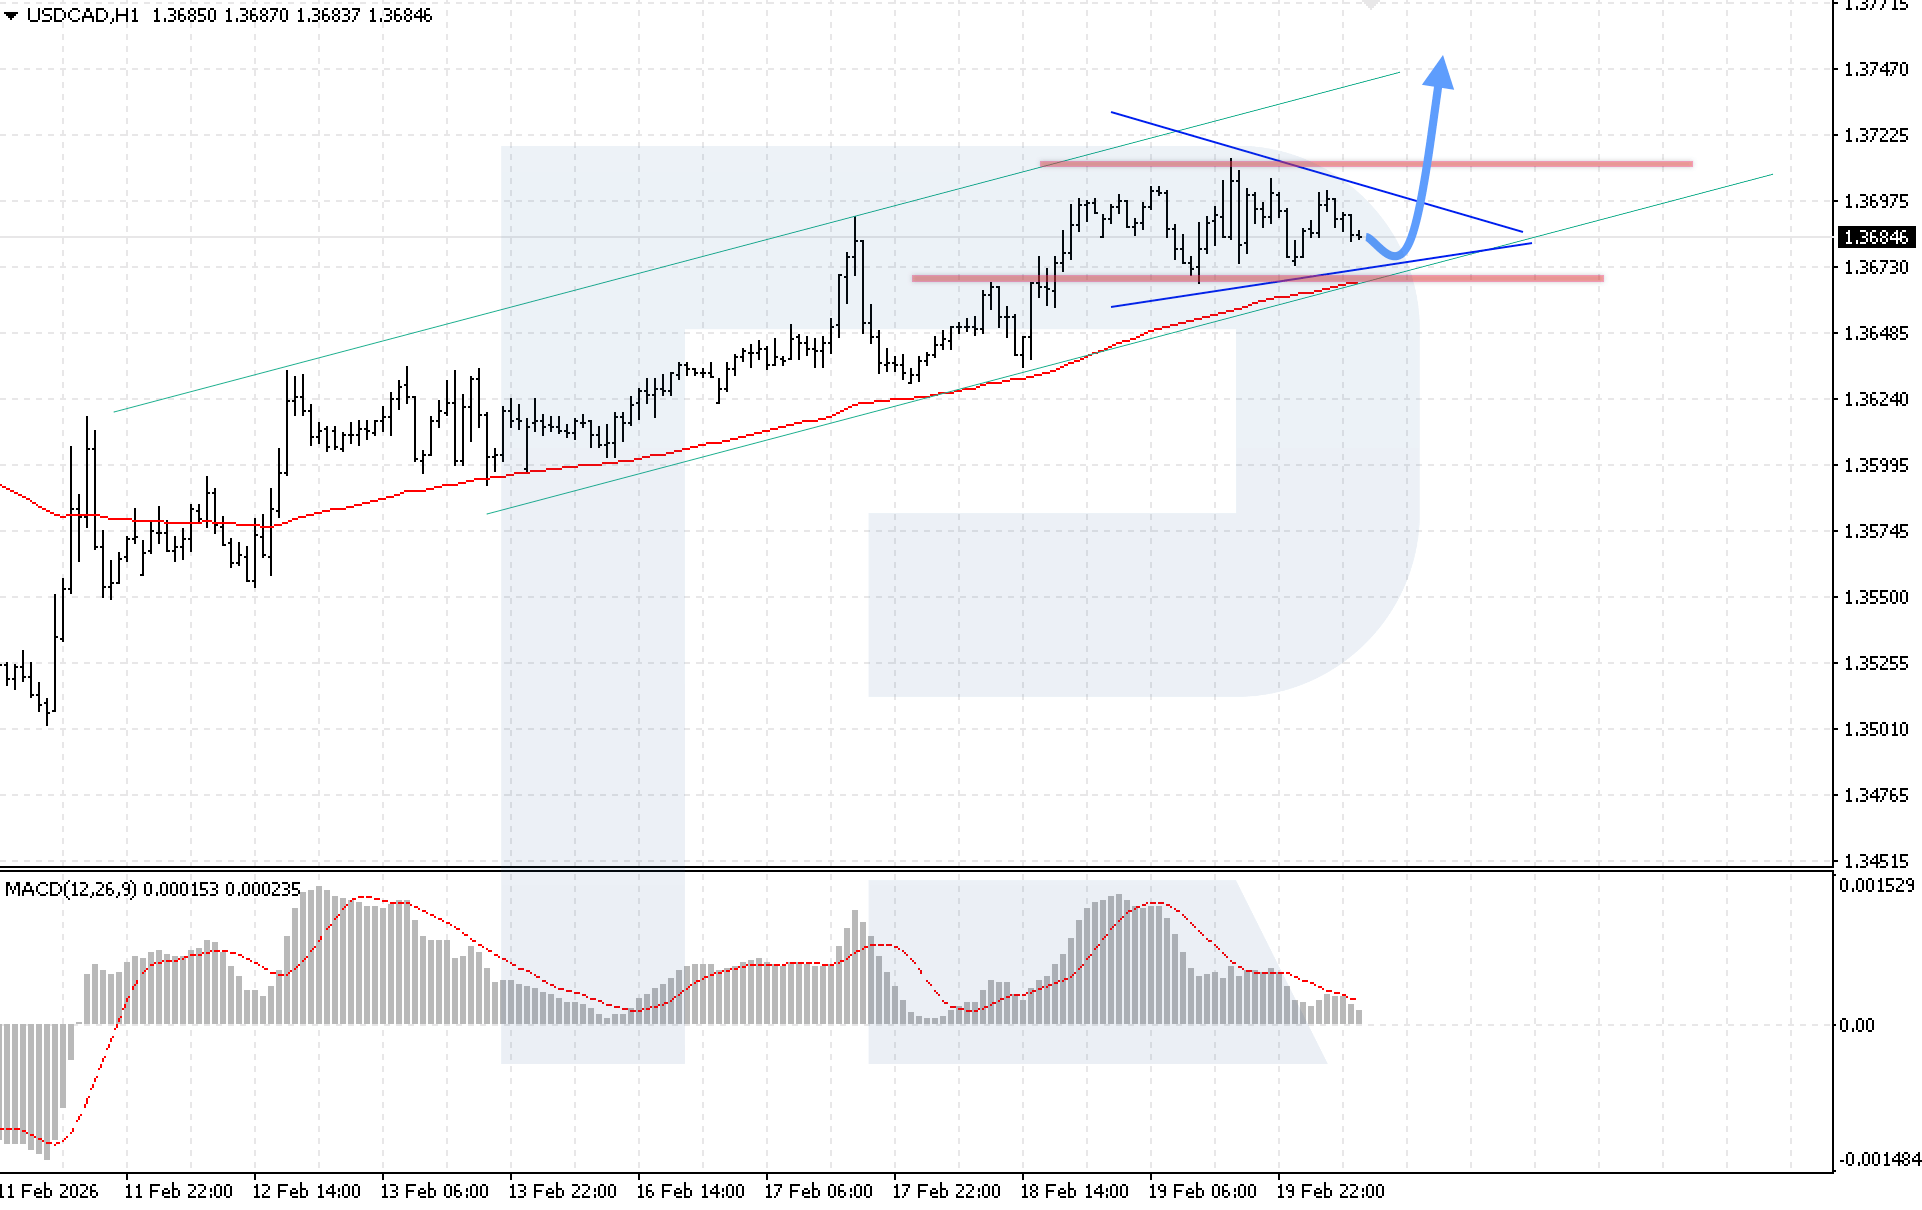
On the H1 chart of the USDCAD currency pair, the market continues to move within a correction while forming a Triangle pattern. Today, 20 February 2026, the baseline scenario suggests continued growth after a rebound from the pattern’s lower boundary, with a target at 1.3785.
The technical picture confirms the bullish scenario. The MACD indicator shows a slight slowdown in histogram growth, indicating that the potential for further upward movement remains. The key condition for growth will be consolidation above the upper boundary of the Triangle at 1.3705.
The alternative scenario will activate if the lower boundary of the pattern is broken with consolidation below 1.3645. Such a signal would indicate the start of a deeper correction in USDCAD.
XAUUSD forecast
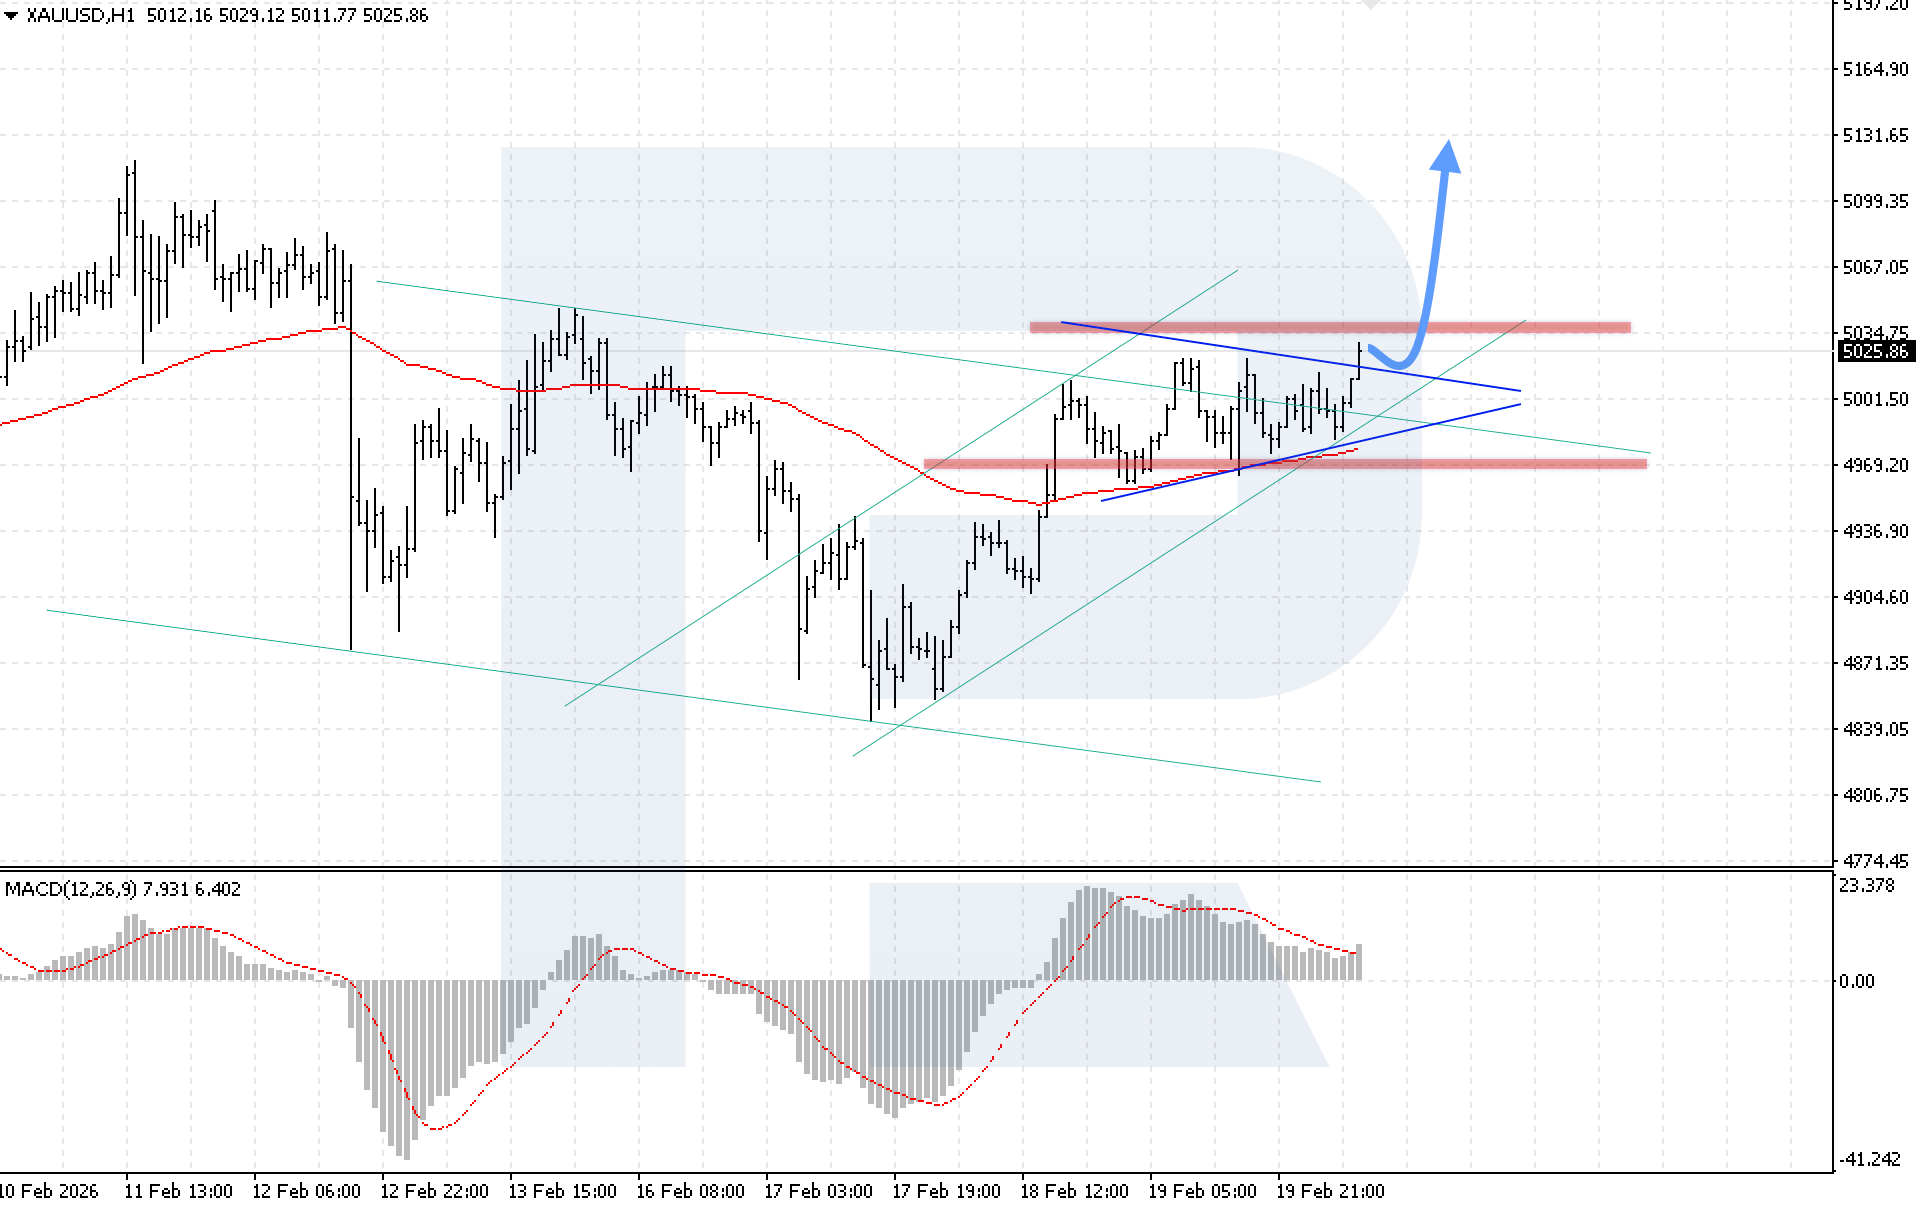
On the XAUUSD H1 chart, the market has secured positions above the upper boundary of the Triangle pattern, creating conditions for bullish momentum. Today, 20 February 2026, the baseline scenario suggests continued growth after a rebound from the pattern’s upper boundary, with a target at 5,135.
The technical picture confirms the bullish scenario. The MACD indicator shows active growth; however, a bearish divergence has formed, which may limit further upside potential. The key condition for continued growth will be consolidation above the local resistance level at 5,035.
The alternative scenario will activate if prices break below the support level and consolidate below 4,965. Such a signal would indicate a breakout of the lower boundary of the bullish channel and open the potential for further decline in XAUUSD quotes.
Brent forecast
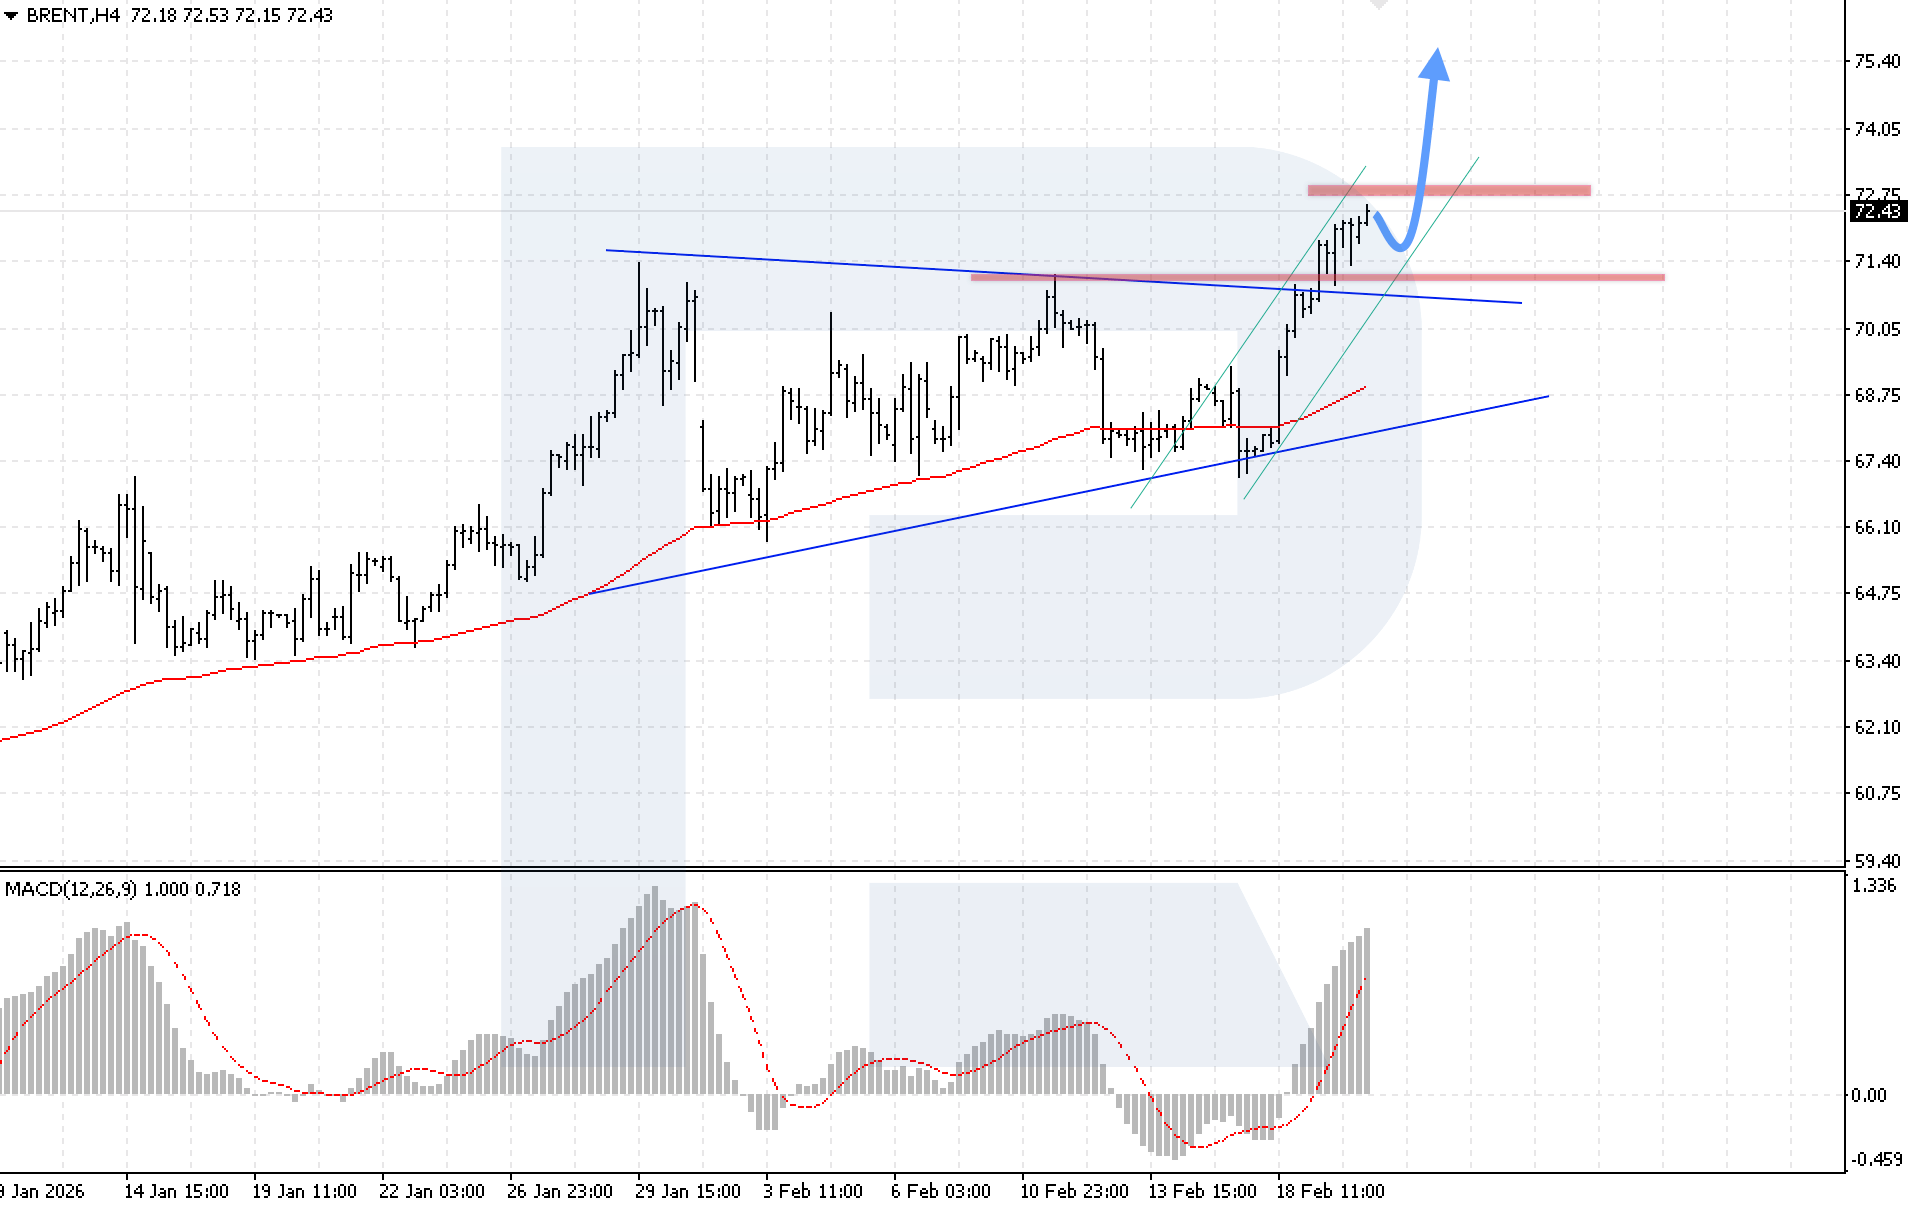
On the H4 chart of Brent crude oil, the market continues to rise actively after breaking above the upper boundary of the Triangle pattern. Buyers have confidently secured positions above the 71.35 resistance level. Today, 20 February 2026, the baseline scenario suggests a rebound from the lower boundary of the bullish channel, followed by growth towards 75.45.
The technical picture confirms the bullish scenario. The MACD indicator shows active growth, supporting the potential for continued upward movement. The key condition for growth will be consolidation above the local 72.75 resistance level.
The alternative scenario will activate if local support is broken with consolidation below 68.70. Such a signal would indicate a return to the Triangle pattern and create conditions for a possible decline in Brent prices.
Editors’ picks
 EURUSD 2026-2027 forecast: key market trends and future predictions
This article provides the EURUSD forecast for 2026 and 2027 and highlights the main factors determining the direction of the pair’s movements. We will apply technical analysis, take into account the opinions of leading experts, large banks, and financial institutions, and study AI-based forecasts. This comprehensive insight into EURUSD predictions should help investors and traders make informed decisions.
 Gold (XAUUSD) forecast 2026 and beyond: expert insights, price predictions, and analysis
Dive deep into the Gold (XAUUSD) price outlook for 2026 and beyond, combining technical analysis, expert forecasts, and key macroeconomic factors. It explains the drivers behind gold’s recent surge, explores potential scenarios including a move toward 4,500 to 5,000 USD per ounce, and highlights why the metal remains a strong hedge during global uncertainty.
Forecasts presented in this section only reflect the author’s private opinion and should not be considered as guidance for trading. RoboForex bears no responsibility for trading results based on trading recommendations described in these analytical reviews.