Daily technical analysis and forecast for 11 June 2025
Here is a detailed daily technical analysis and forecast for EURUSD, USDJPY, GBPUSD, AUDUSD, USDCAD, XAUUSD and Brent for 11 June 2025.
EURUSD forecast
On the H4 chart, EURUSD is forming a consolidation range around 1.1414 without a clear trend. Today, 11 June 2025, a downward expansion to 1.1333 is expected. Once this level is reached, the market may rise towards 1.1515. Afterwards, the outlook suggests the beginning of a new downward wave towards 1.1275.
This scenario is supported by the Elliott wave structure and the growth wave matrix with a pivot at 1.1275, seen as a key reference in the EURUSD structure. The price has previously reached the upper boundary of the price Envelope at 1.1494. Today’s forecast considers a correction towards the lower boundary at 1.1333.
Technical indicators for today’s EURUSD forecast suggest a potential decline to 1.1333.

USDJPY forecast
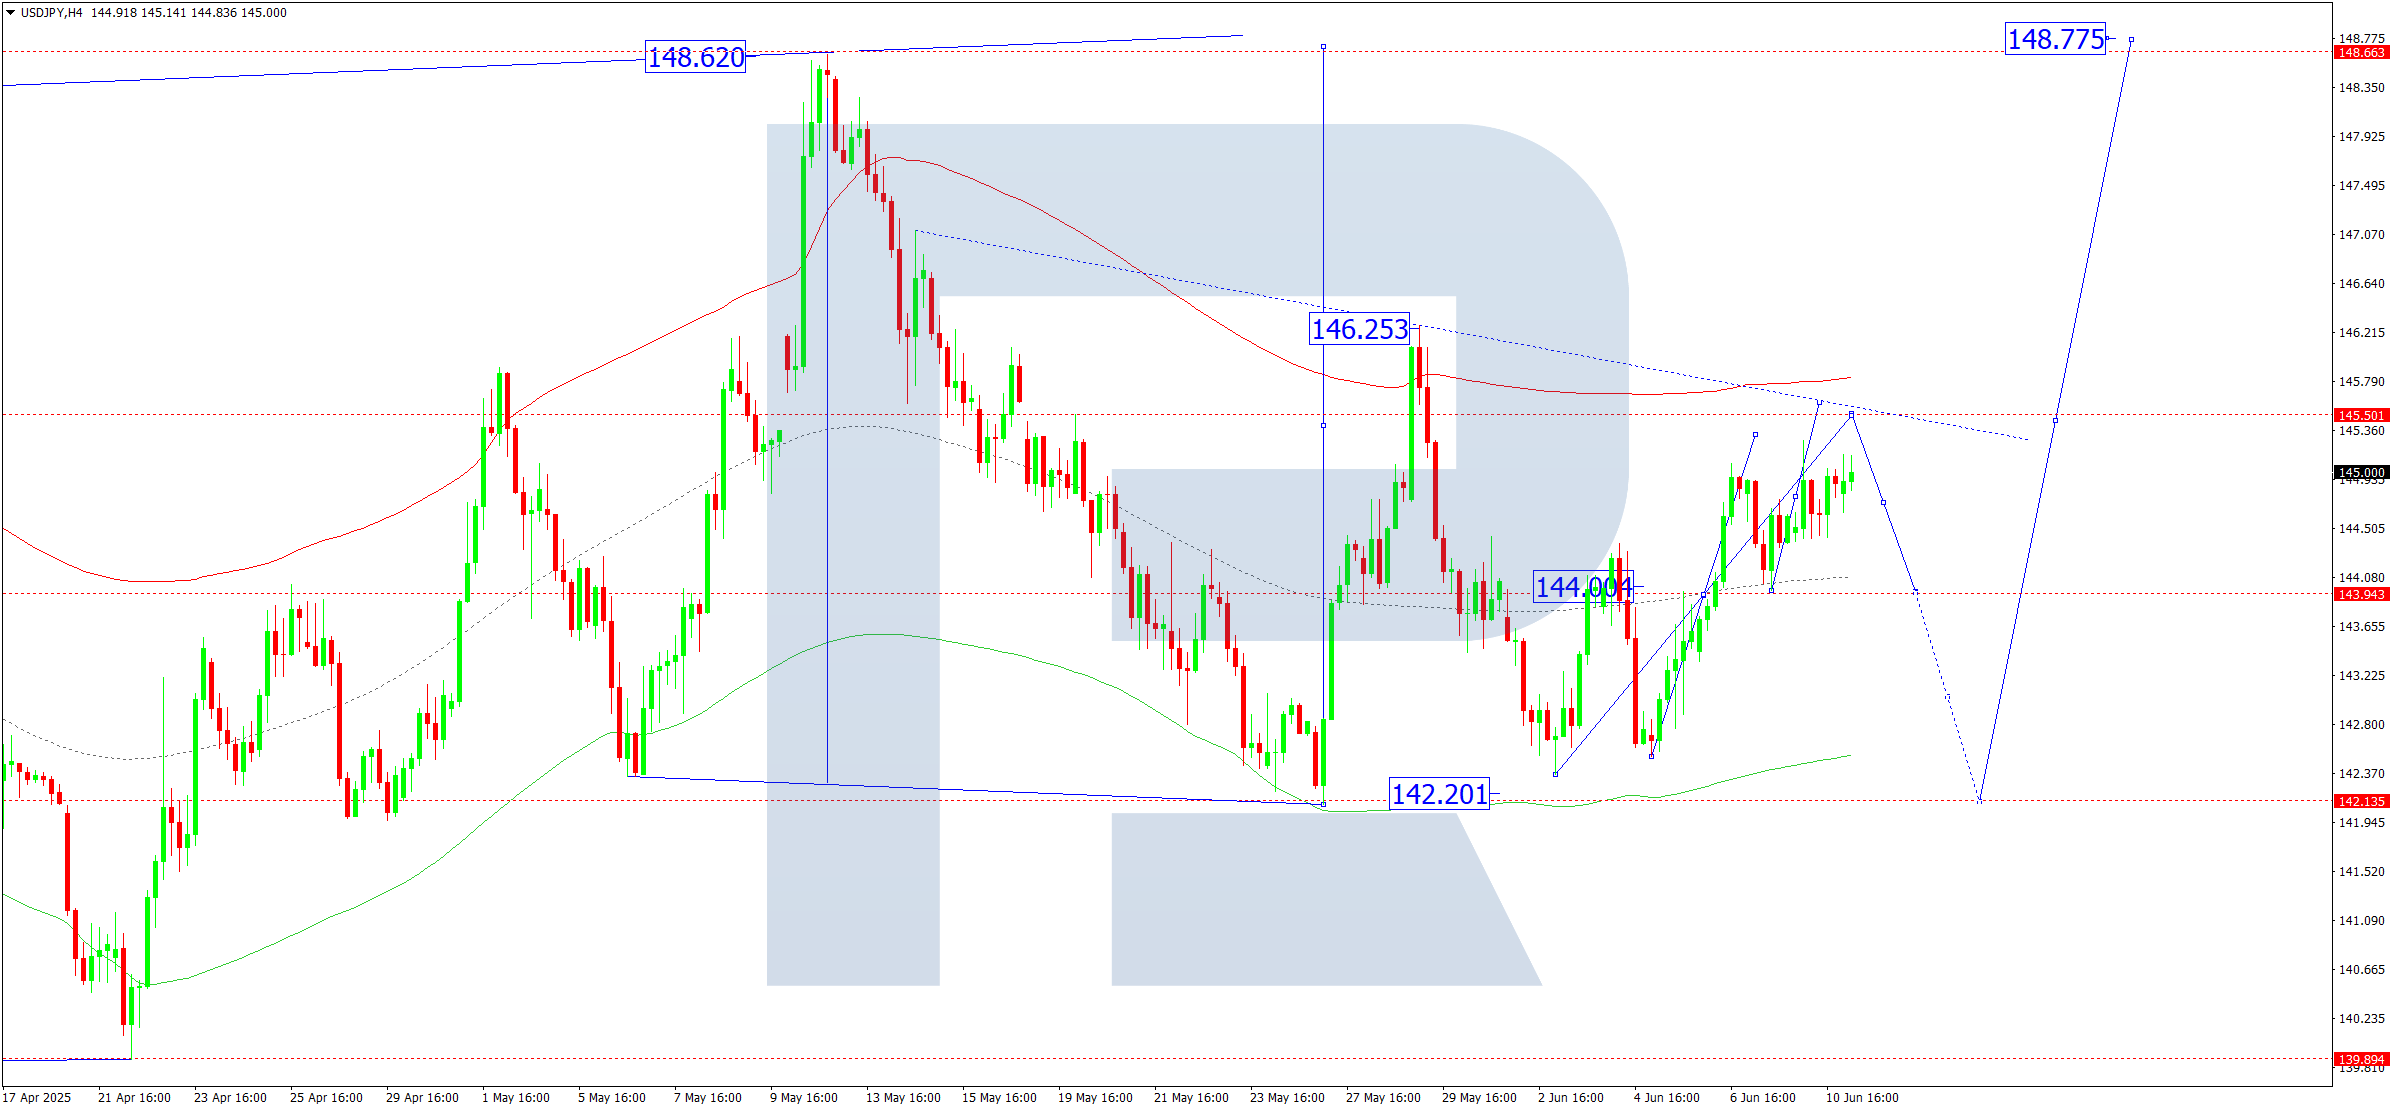
On the H4 chart, USDJPY continues to develop a consolidation range around 144.00. The market has completed an upward leg to 145.25. Today, 11 June 2025, a further rise to 145.50 is possible. Afterwards, a pullback to 144.00 is expected. If the market breaks below this range, the wave may continue towards 142.20. A breakout upwards may drive the trend to 148.77.
This outlook is confirmed by the Elliott wave structure and the growth matrix pivoting at 144.00. It plays a central role in the USDJPY structure. The price fulfilled a local growth target at 145.25 and corrected to the price Envelope’s central line at 144.00. Today, a move towards the upper boundary at 145.50 is expected.
Technical indicators for today’s USDJPY forecast support an upward wave towards 145.50.
GBPUSD forecast
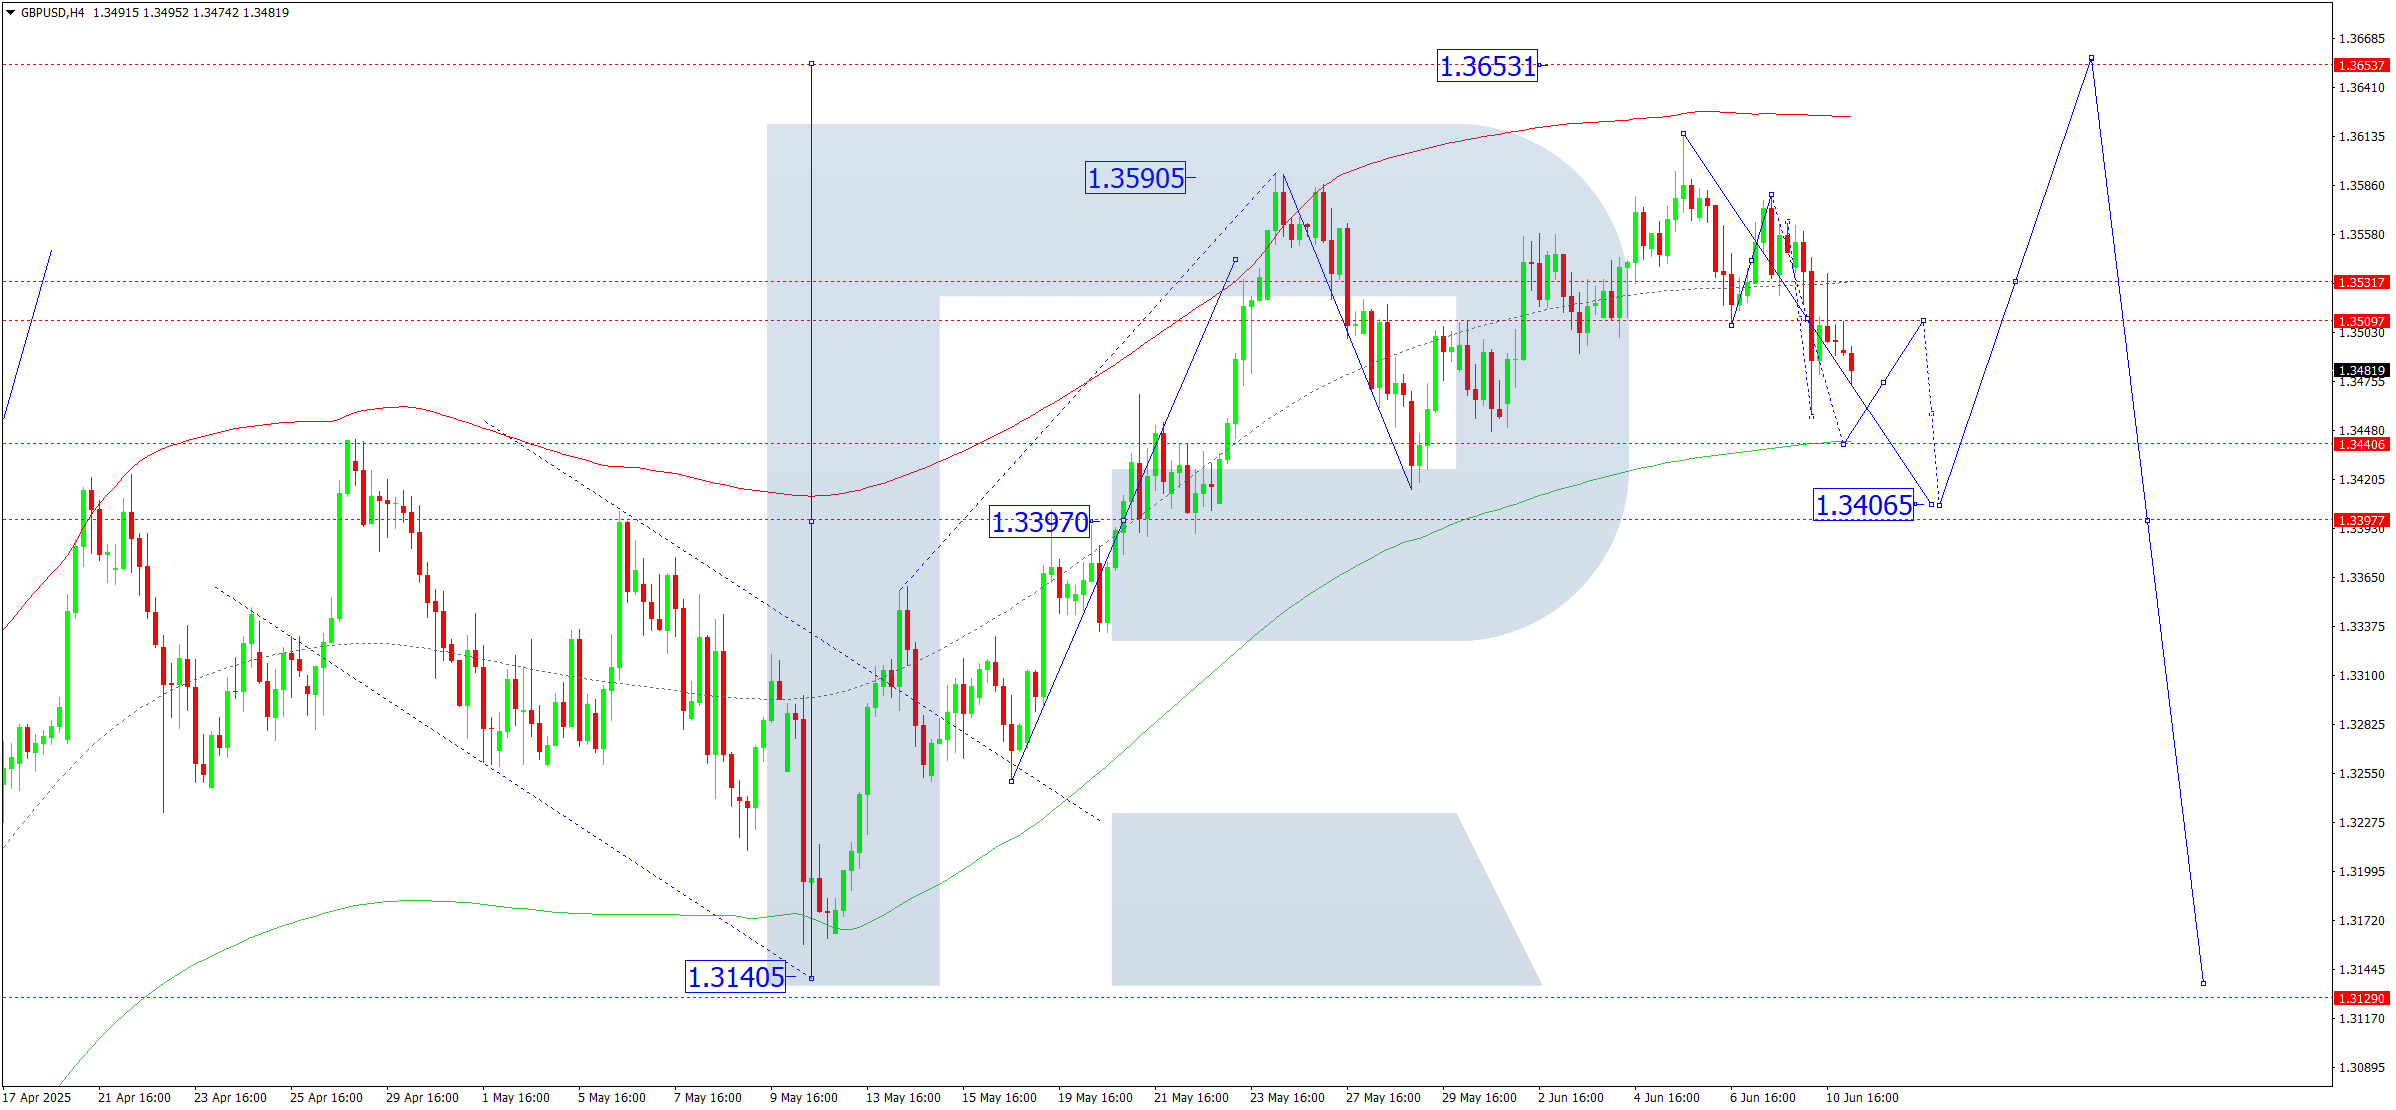
On the H4 chart, GBPUSD is consolidating around 1.3500. Today, 11 June 2025, a move down to 1.3444 is anticipated, followed by a rise back to 1.3500. A downward breakout could lead to an extension of the wave to 1.3400. If the price breaks out upwards, a stretch to 1.3655 is possible.
This view is confirmed by the Elliott wave structure and the growth matrix with a pivot at 1.3400. It serves as a key in the current wave. The market is consolidating near the price Envelope’s central line at 1.3500, with a potential dip to its lower boundary at 1.3440 and growth to its upper boundary at 1.3655.
Technical indicators for today’s GBPUSD forecast suggest a decline to 1.3444.
AUDUSD forecast
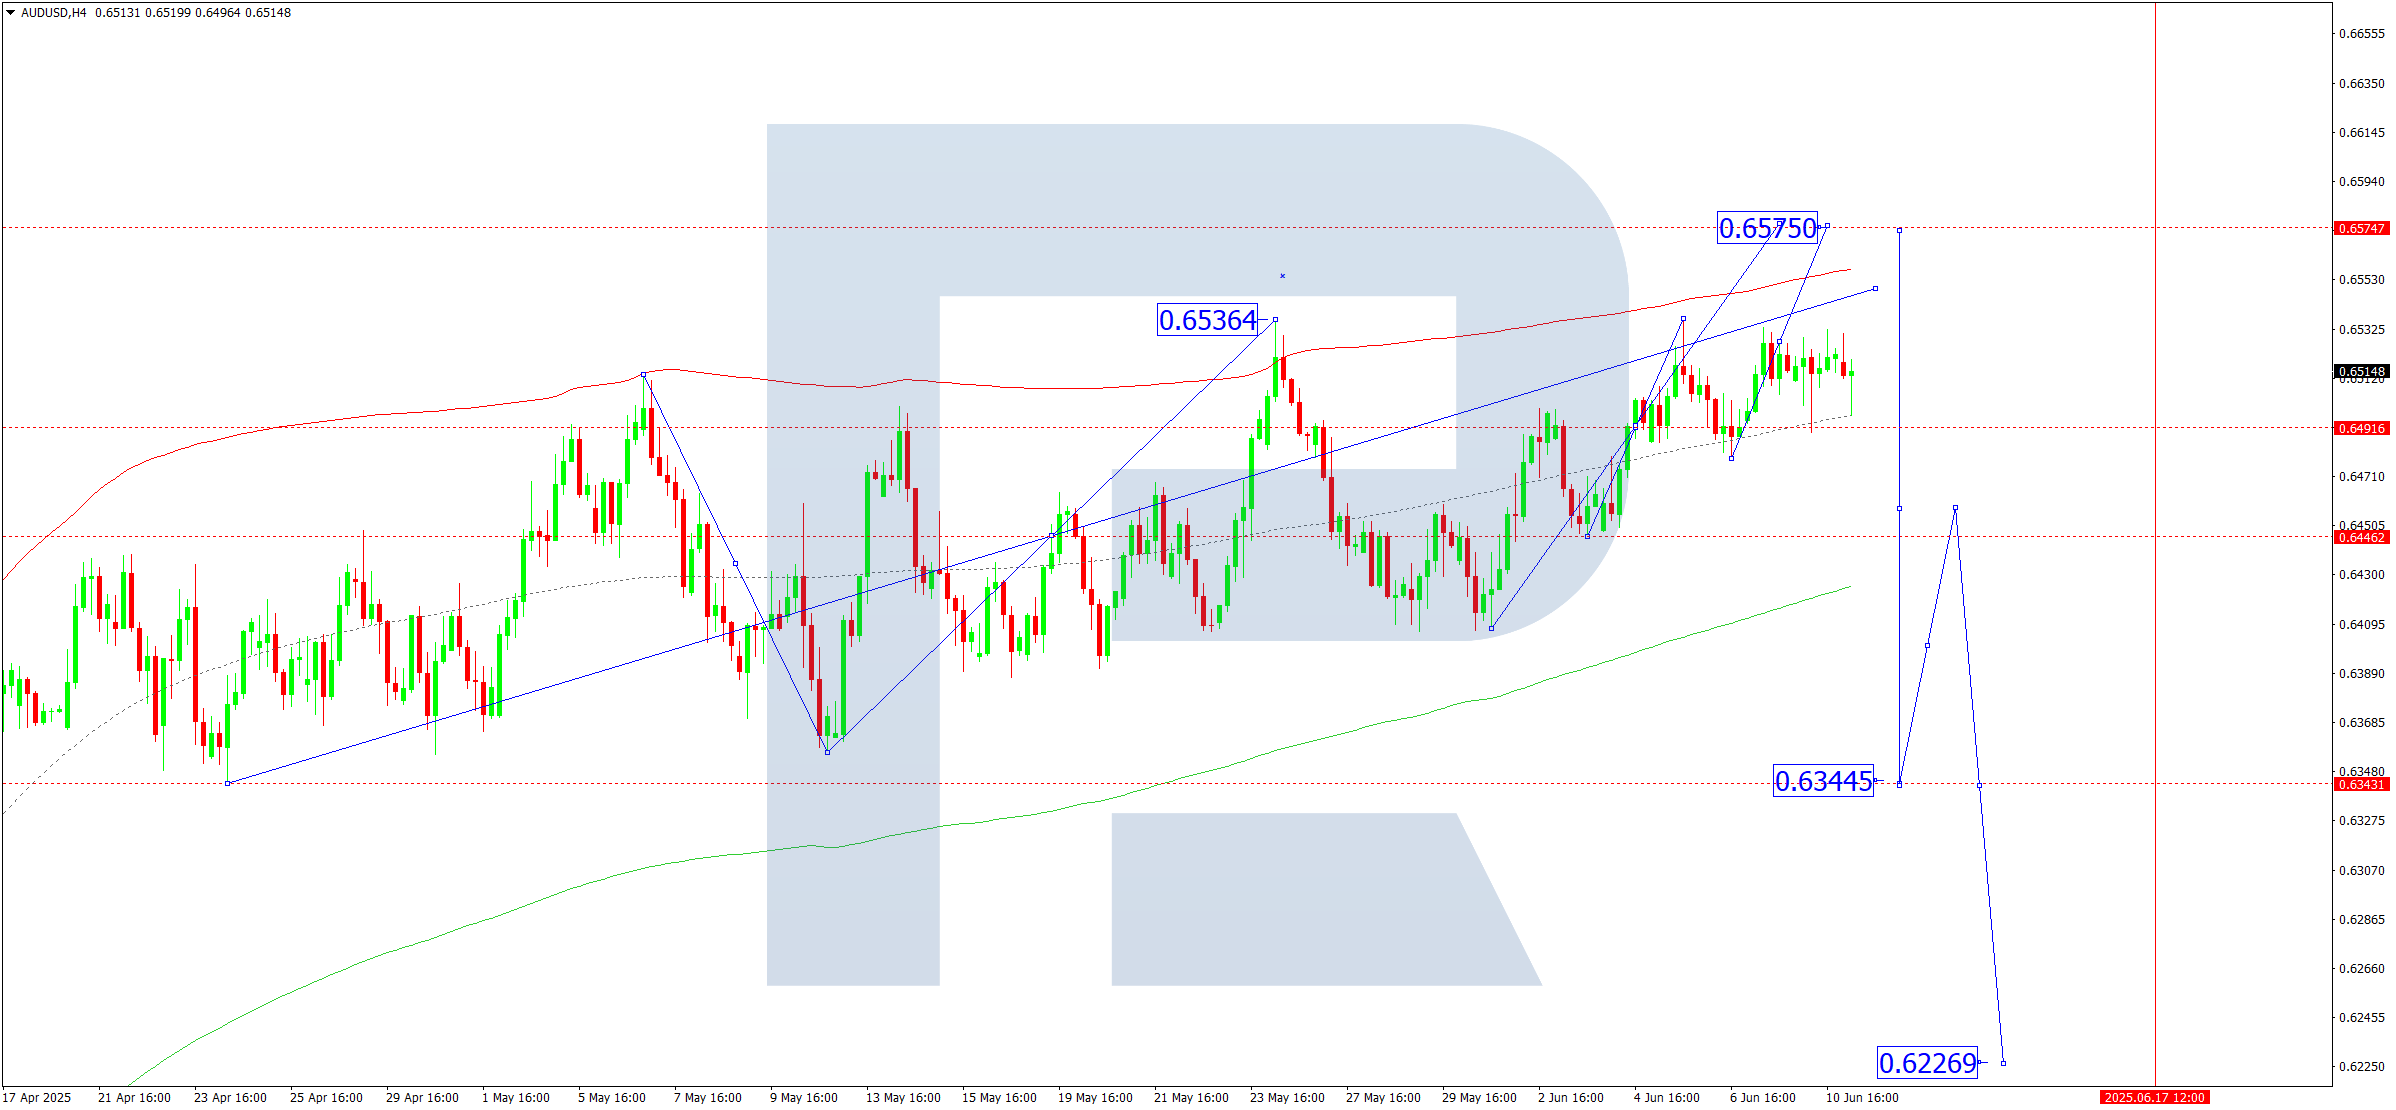
On the H4 chart, AUDUSD continues to form a consolidation range around 0.6490. Today, 11 June 2025, a rise to 0.6575 is possible. Later, the forecast anticipates a new downward wave towards 0.6444.
This scenario is backed by the Elliott wave structure and the growth wave matrix centred at 0.6444, which is key in the current formation. The market is developing an upward wave towards the upper boundary of the price Envelope at 0.6575. Once that level is reached, a decline to the lower boundary at 0.6444 could follow.
Technical indicators for today’s AUDUSD forecast suggest continued growth towards 0.6575.
USDCAD forecast
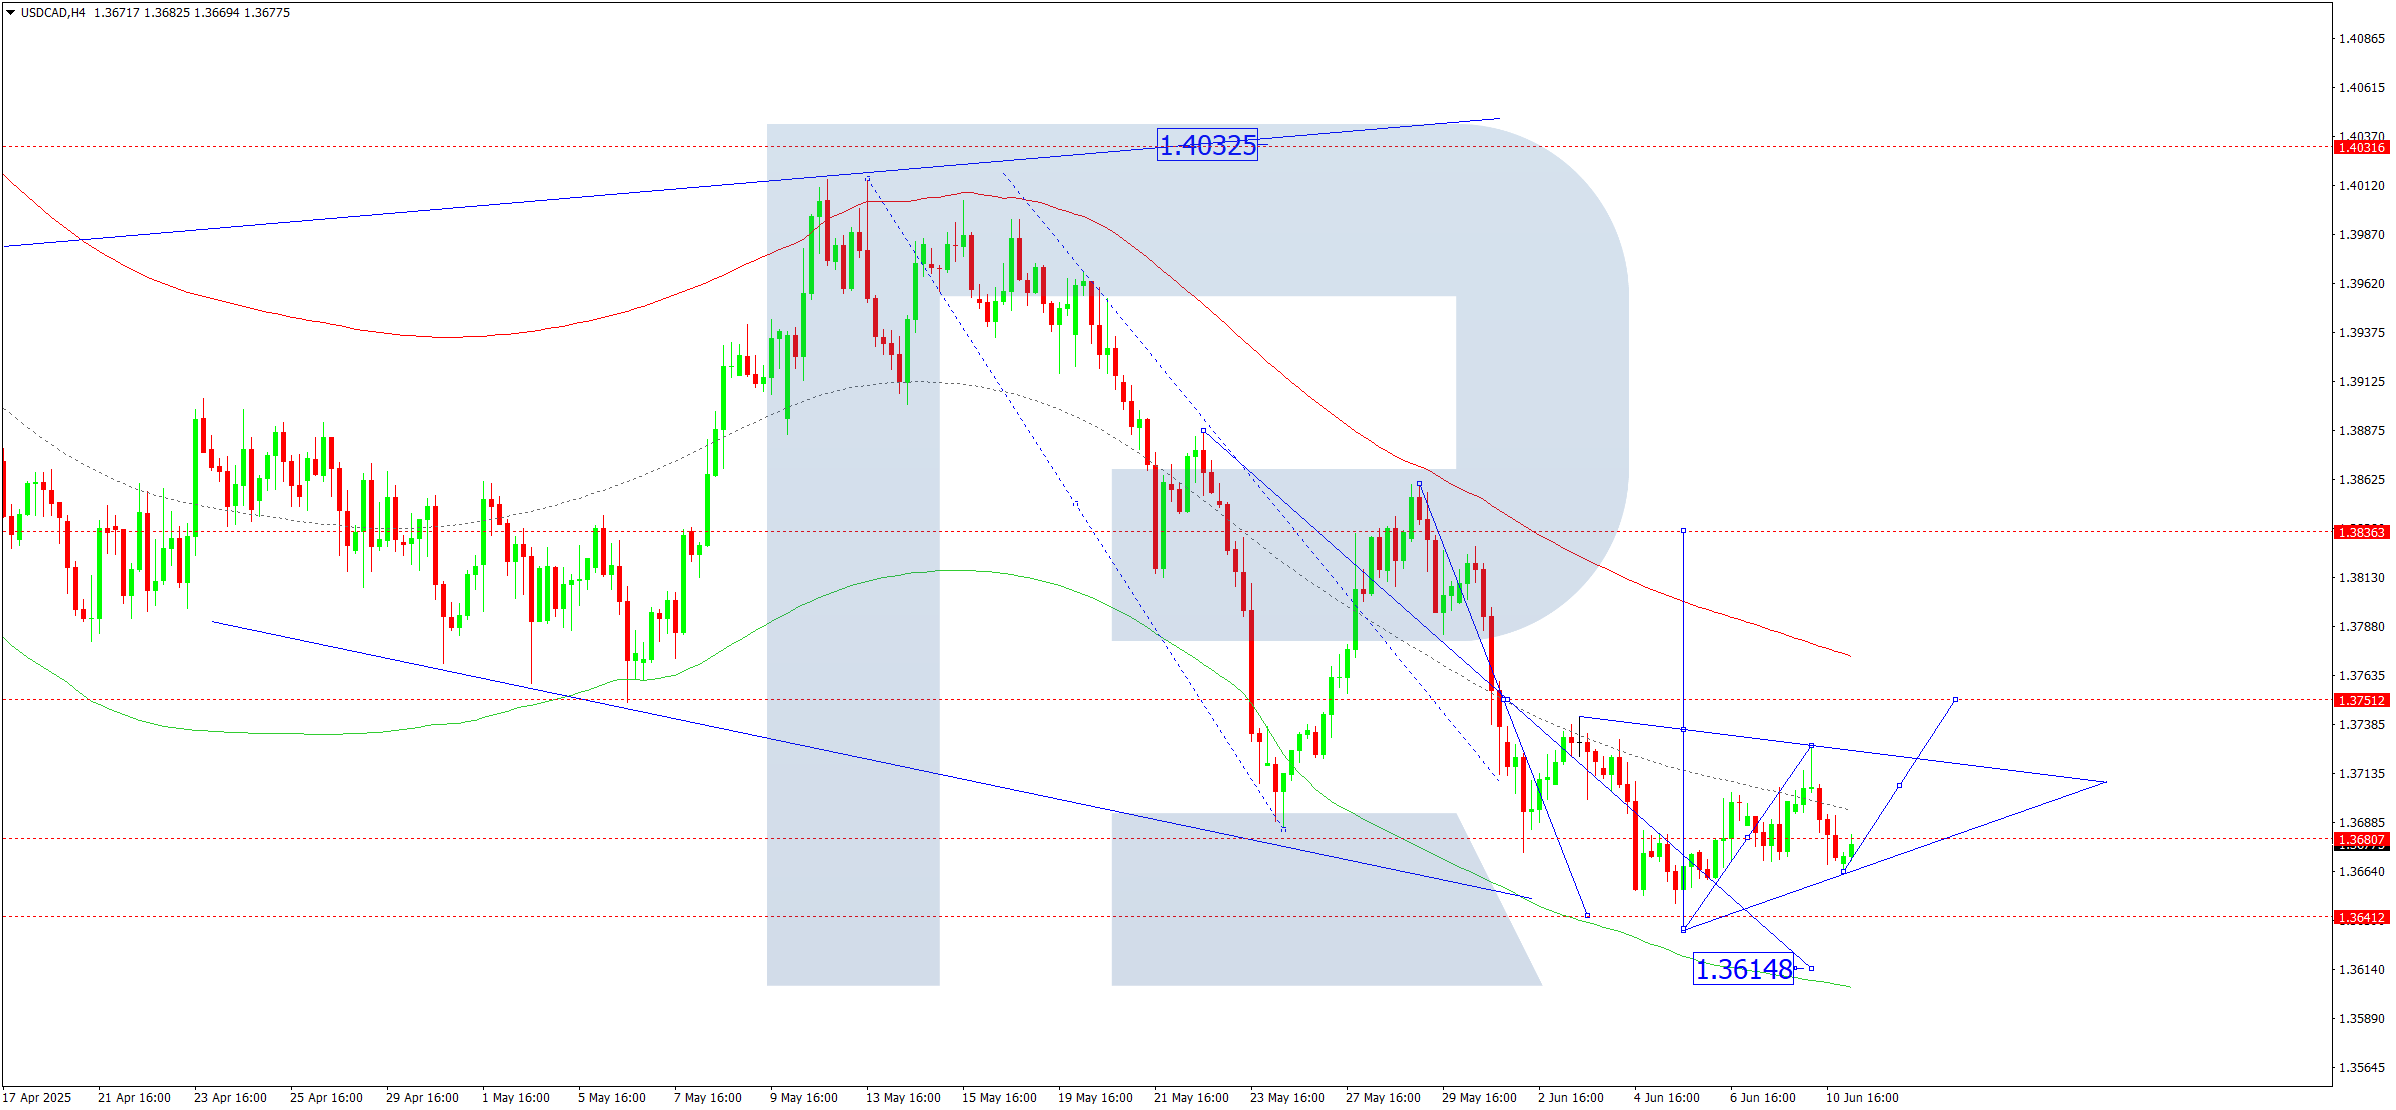
On the H4 chart, USDCAD is consolidating around 1.3680. Today, 11 June 2025, an upward breakout could push the price towards 1.3836. If it breaks down, the wave may stretch to 1.3615.
The Elliott wave structure and the decline matrix with a pivot at 1.3838 confirm this scenario, which plays a central role in the current wave. The market is currently correcting towards the price Envelope’s upper boundary at 1.3750. After the correction ends, a move towards the lower boundary at 1.3615 may follow.
Technical indicators for today’s USDCAD forecast suggest a potential downward wave to 1.3615.
XAUUSD forecast
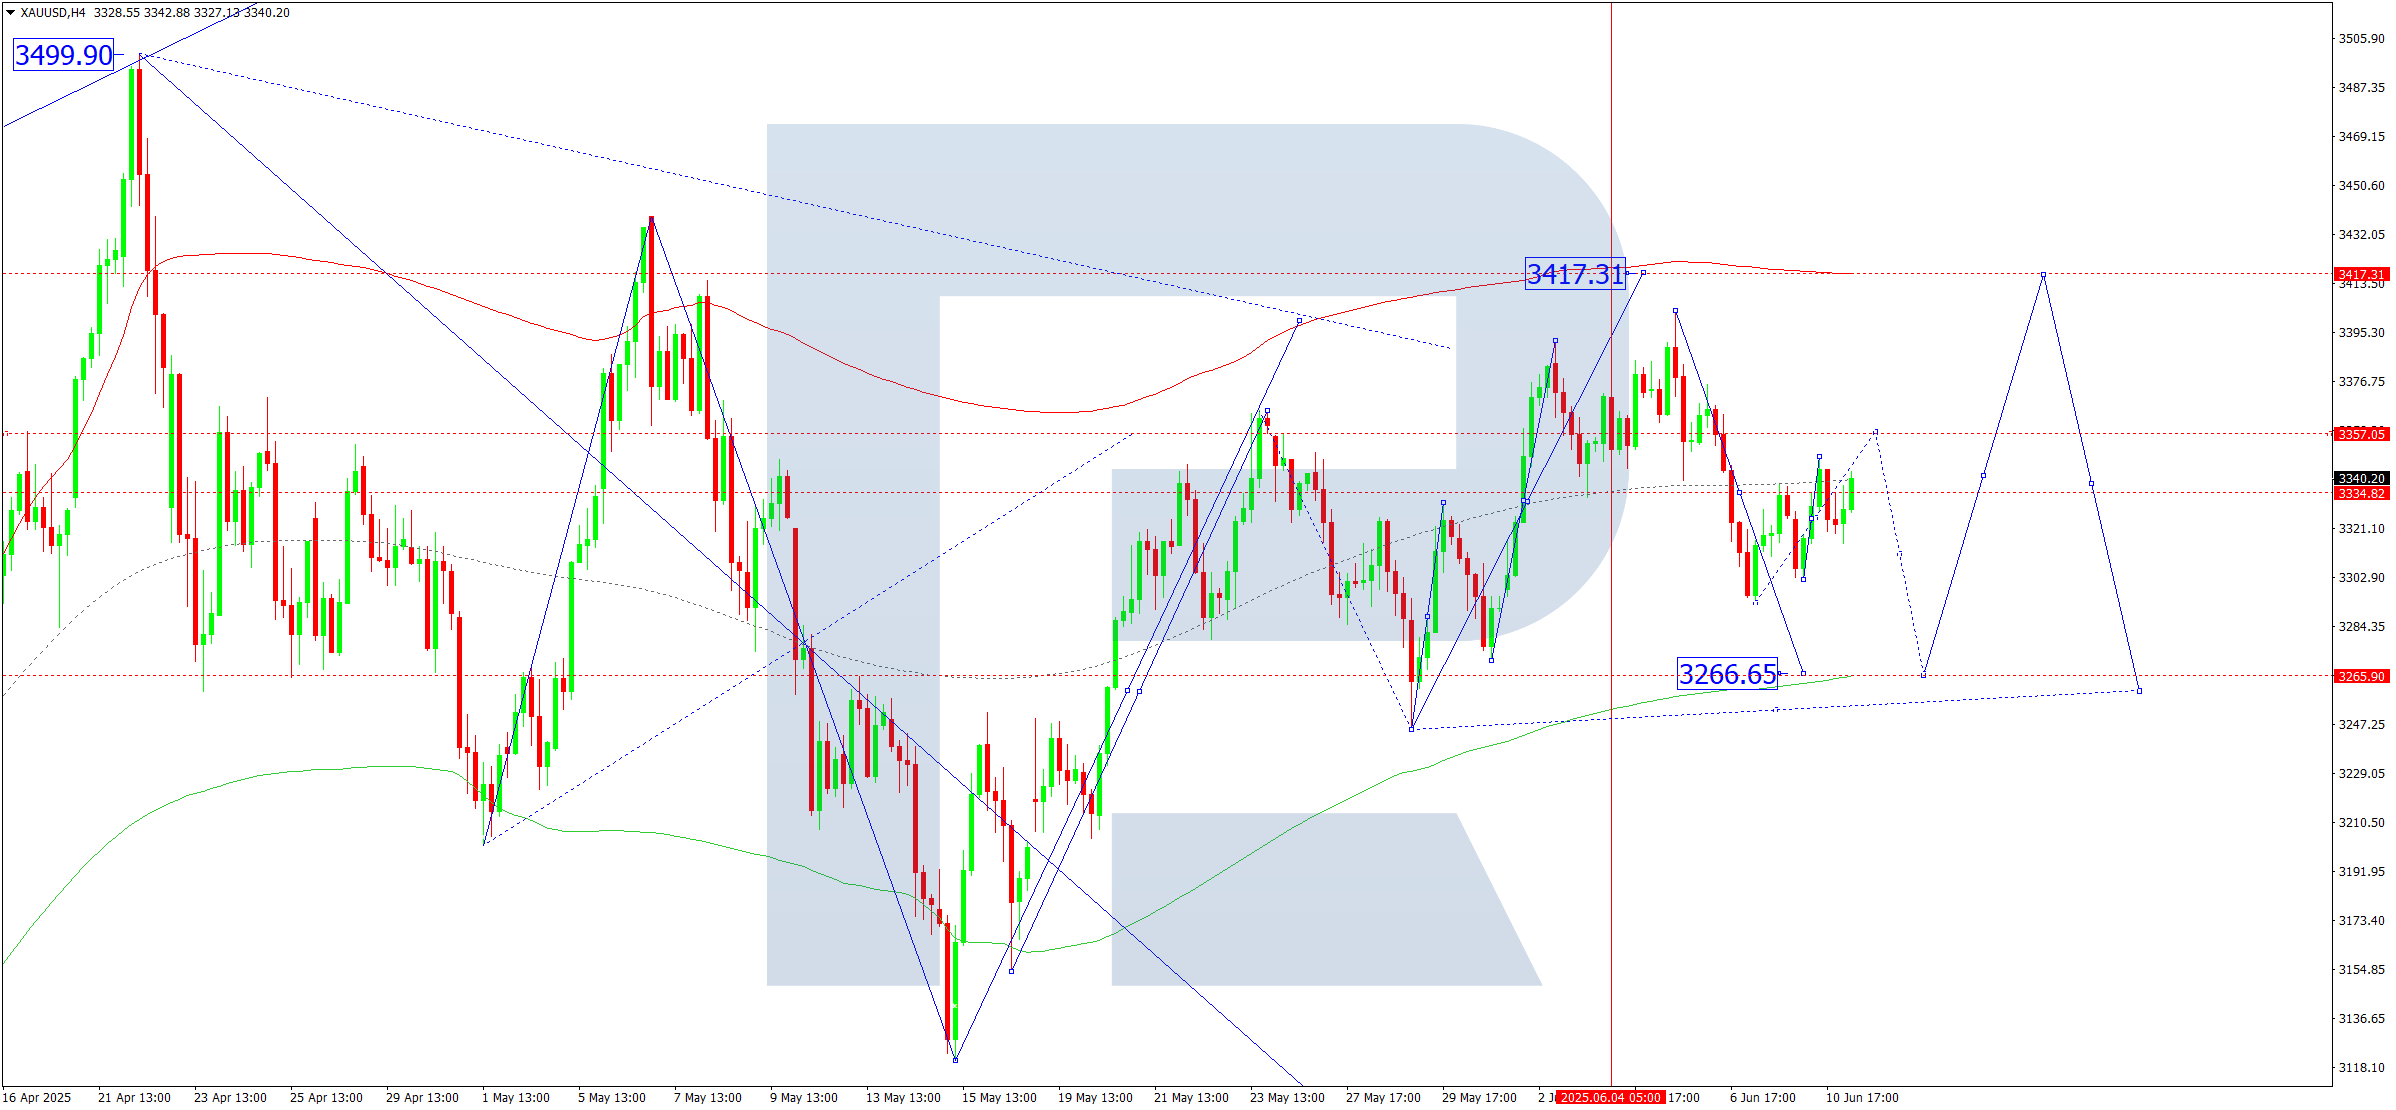
On the H4 chart, XAUUSD is continuing a correction wave towards 3,357 (testing from below). Today, 11 June 2025, a potential end to the correction and beginning of a decline to 3,266 is expected.
This view is confirmed by the Elliott wave structure and the decline matrix pivoting at 3,260, considered key in the XAUUSD structure. The market is developing the fifth wave in a correction towards the price Envelope’s lower boundary at 3,266. A rise to the central line at 3,357 may occur before the wave continues to the lower boundary at 3,266.
Technical indicators for today’s XAUUSD forecast point to a continued decline to 3,266.
Brent forecast
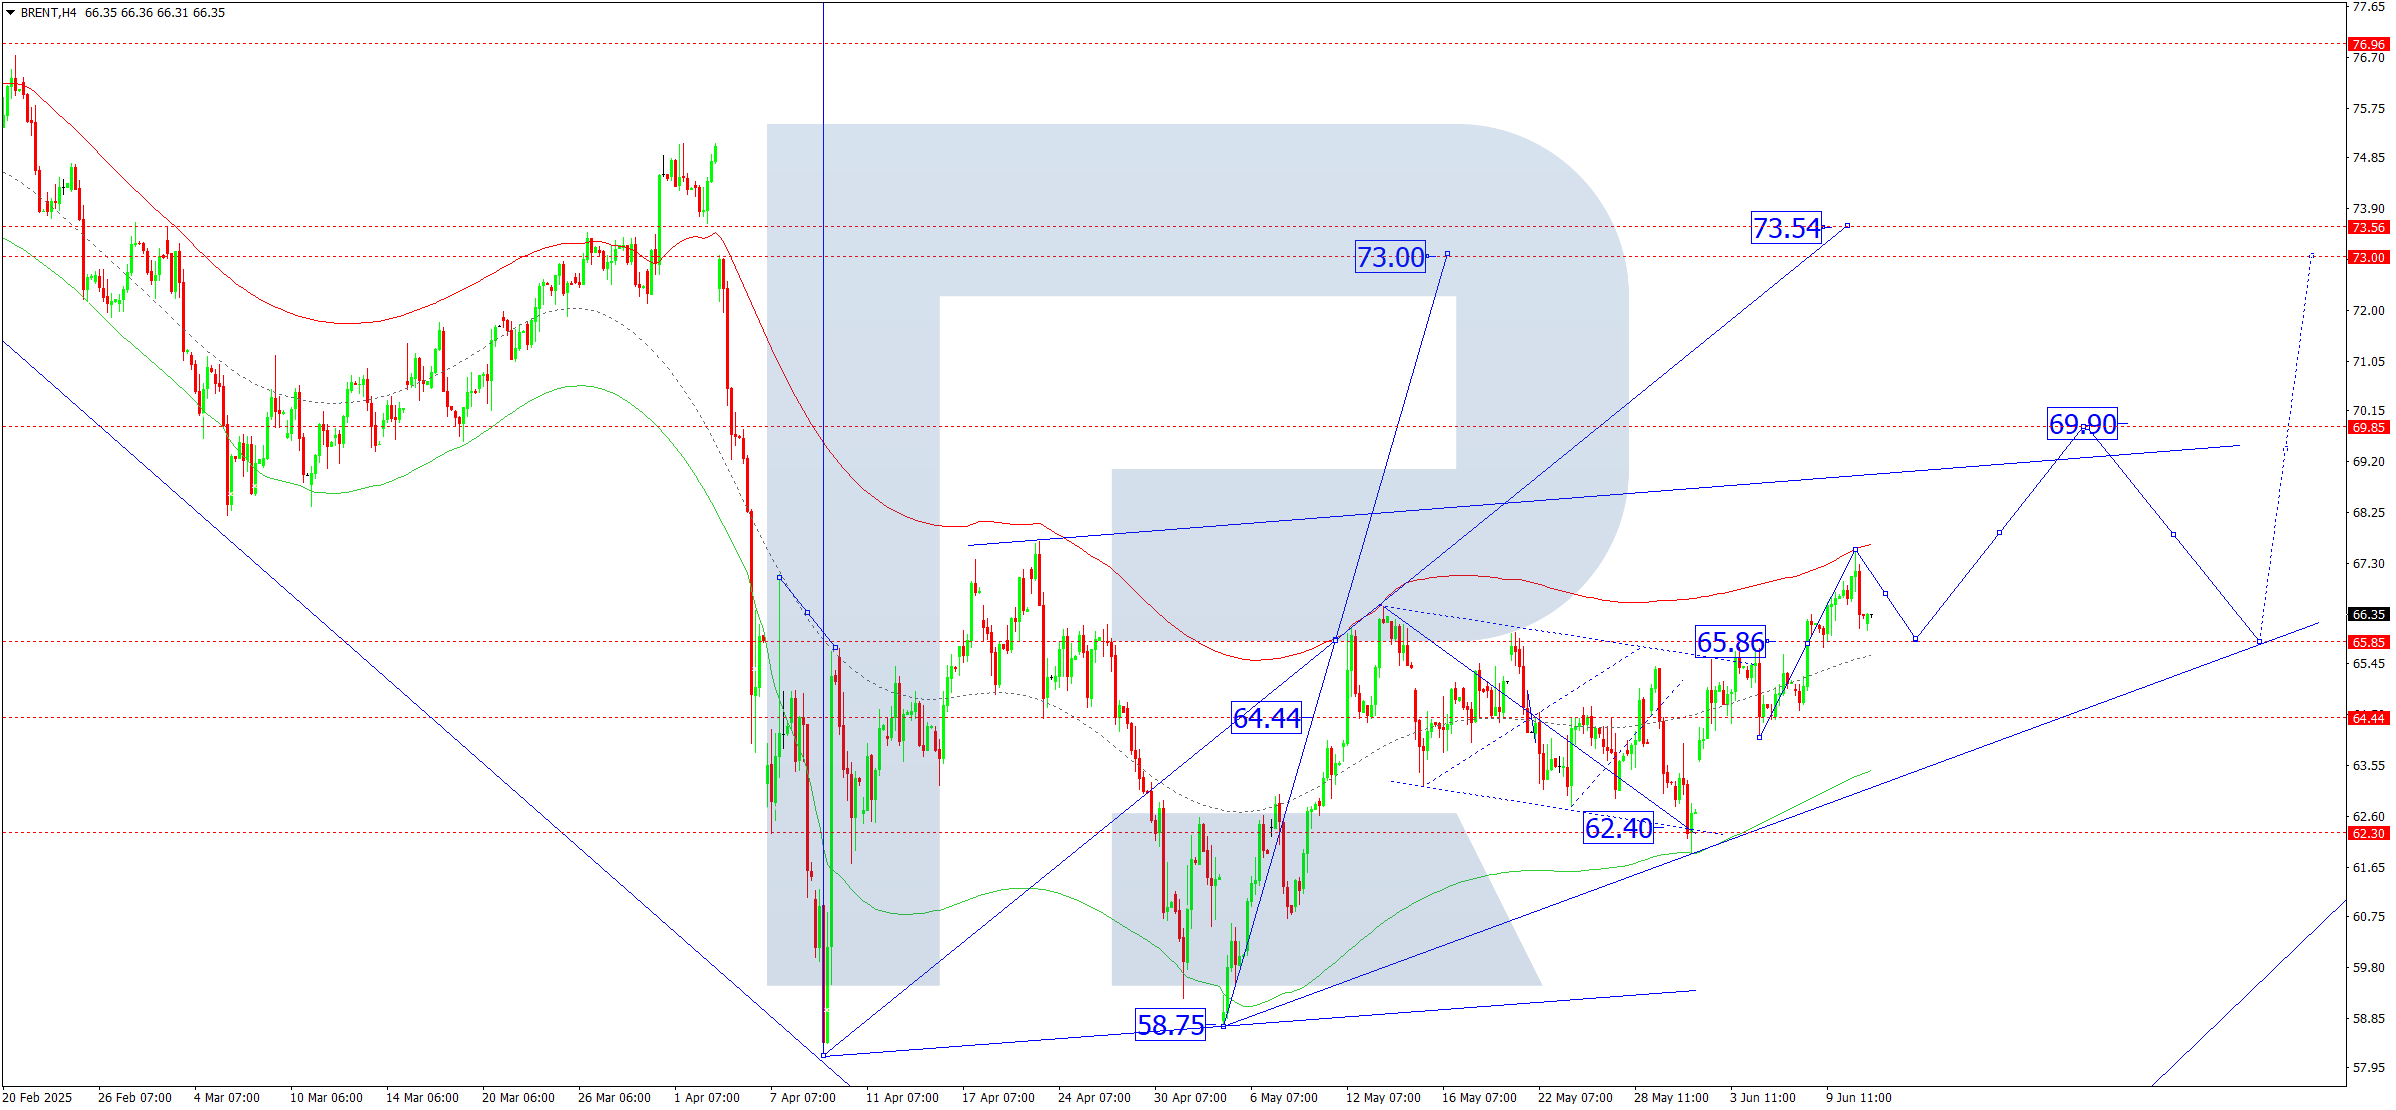
On the H4 chart, Brent crude has completed a growth wave to 67.55. Today, 11 June 2025, a pullback to 65.85 is expected. Afterwards, the forecast suggests a continued rise to the local target of 69.00.
The Elliott wave structure and the growth wave matrix with a pivot at 65.85 support this view, which is key to Brent's current wave. The market is heading towards the price Envelope’s upper boundary at 69.00. After reaching it, a new consolidation range may form.
Technical indicators in today’s Brent forecast suggest a correction to 65.85 followed by growth to 69.00.
Forecasts presented in this section only reflect the author’s private opinion and should not be considered as guidance for trading. RoboForex bears no responsibility for trading results based on trading recommendations described in these analytical reviews.