
EURUSD resumes decline after failed recovery attempt
The EURUSD pair is moving lower amid a sharp rise in oil prices caused by the conflict in the Middle East, with the rate currently at 1.1603. Find more details in our analysis for 1 September 2026.
EURUSD forecast: key takeaways
- Kevin Warsh’s hawkish speech at Jackson Hole on Friday prompted the market to treat interest rate hikes as the base-case scenario
- CME FedWatch estimates have shifted, with the probability of a Federal Reserve rate hike at the September meeting jumping to 66.4%
- EURUSD forecast for 1 September 2026: 1.1545
Fundamental analysis
The EURUSD rate is moving lower after yesterday’s unsuccessful recovery attempt. Sellers are currently attempting to consolidate below the ascending trendline; a breakout below it would signal the end of the bullish correction and a renewed decline.
Market participants are assessing the inflationary impact of rising energy prices triggered by the escalating conflict in the Middle East. Oil prices surged following reports that the US and Iran had exchanged new strikes. The rise in commodity prices further fuelled investor concerns about accelerating inflation and additional monetary policy tightening by the Federal Reserve, which had already increased after Friday’s speech by Fed Chairman Kevin Warsh at the Jackson Hole Symposium.
A Federal Reserve rate hike has become the market’s baseline scenario following the leadership’s hawkish comments. According to the latest CME FedWatch data, the probability of a Federal Reserve rate hike at the September meeting has risen to 66.4%, up from 40.0% just a week earlier.
Technical outlook
The EURUSD pair is declining after rebounding from the EMA-65, with selling pressure increasing. Today’s EURUSD forecast suggests renewed downward momentum towards the 1.1545 target.
Analysis of the Stochastic Oscillator provides an additional signal in favour of the bearish scenario. The oscillator has reached overbought territory, confirming an imminent price reversal. A breakout below the lower boundary of the correction channel, followed by consolidation below the 1.1595 support level, would confirm today’s bearish EURUSD scenario.
At the same time, the risk of an alternative scenario remains if prices rise. If buyers gain a foothold above the upper boundary of the medium-term descending channel and break above the 1.1635 resistance level, this would signal easing bearish pressure. In this case, the EURUSD rate could continue its upward trajectory towards the nearest target at 1.1705.
EURUSD overview
- Asset: EURUSD
- Timeframe: H1 (intraday)
- Trend: bearish
- Key resistance levels: 1.1600 and 1.1655
- Key support levels: 1.1570 and 1.1520
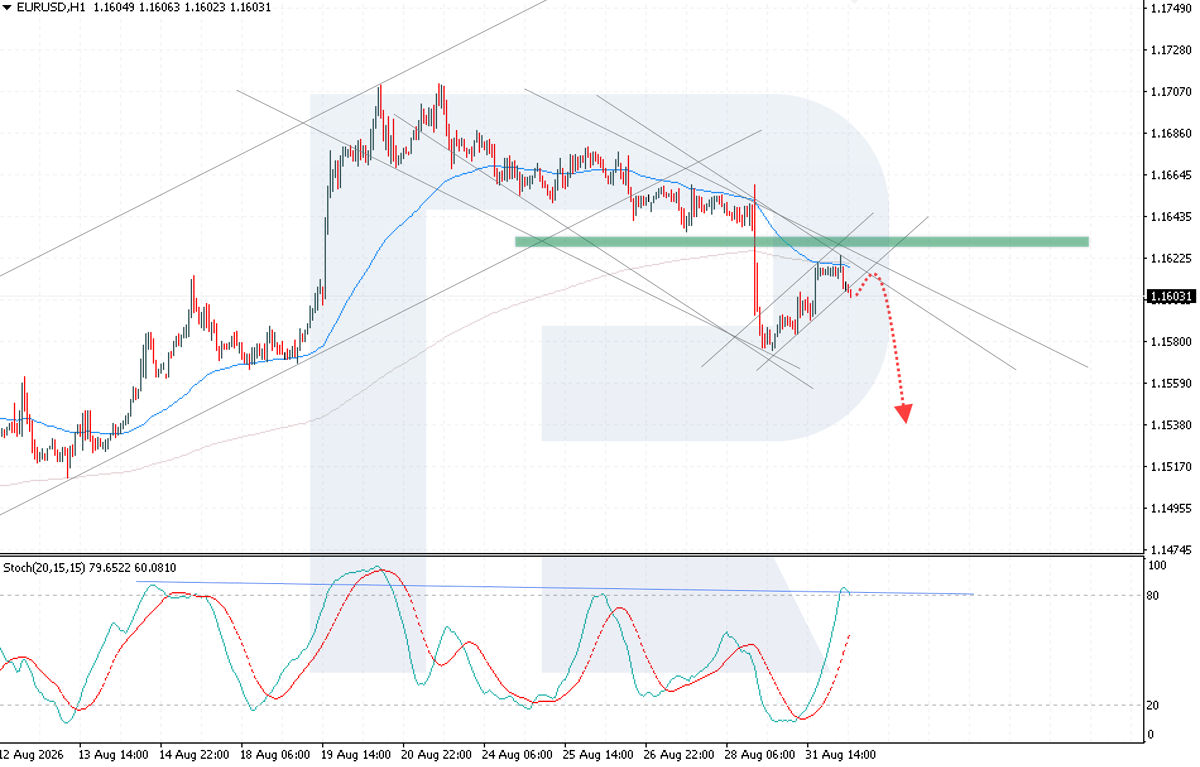
EURUSD trading scenarios for today
Main scenario (Sell Stop)
A consolidation below the lower boundary of the bullish channel, with a breakout below 1.1595, would create conditions for opening short positions and indicate the end of the correction.
- Current price: 1.1603
- Entry price: 1.1595
- Stop loss: 1.1625
- Take profit: 1.1535
- Risk-to-reward ratio: 1:2
Alternative scenario (Buy Stop)
A breakout above the upper boundary of the medium-term descending channel, followed by consolidation above 1.1635, would indicate increased buying pressure and could trigger an upward wave towards 1.1705.
- Entry level: 1.1635
- Stop loss: 1.1595
- Take profit: 1.1715
- Risk-to-reward ratio: 1:2
The trade idea is valid until 8:00 AM on 2 September 2026 (server time, UTC+3).
Risk factors
The main risk to the EURUSD bearish scenario is a potential easing of tensions in the Middle East or the release of weak US macroeconomic data this Friday. In this case, investors’ inflation concerns would fall sharply, prompting traders to reassess the probability of a Federal Reserve rate hike and pushing the EURUSD pair back higher.
Summary
The current EURUSD decline is driven by Kevin Warsh’s hawkish rhetoric and inflation risks from rising oil prices, which have shifted market expectations towards a Federal Reserve rate hike. If sellers successfully consolidate below the trendline, the EURUSD pair will complete its local correction, opening the way for the euro’s medium-term decline to resume.
Editors’ picks
 EURUSD forecast 2026–2027: technical analysis, price levels & predictions
EURUSD has recovered from the July lows and is trading near 1.1545 — back in bullish territory. The pair has reclaimed EMA65 on the daily, formed a bullish EMA crossover on H4, and the US-eurozone GDP gap has narrowed sharply (US 1.5% vs eurozone 1.0%). Goldman Sachs and Deutsche Bank both now target 1.2500 by year-end. A confirmed close above 1.1700 opens the path to 1.1805. We break down the key levels, three trading scenarios, and what the unprecedented 9-3 FOMC dissent vote means for EURUSD.
 Gold (XAUUSD) forecast 2026: technical analysis, price levels & predictions
Gold has reversed its downtrend and is trading near 4,360 USD, back above both EMA65 and EMA200. ETF flows turned positive in July with 3 billion USD of net inflows, and central banks bought 288.9 tonnes in Q2 — up 62% year-on-year. A breakout above 4,500 USD opens the path to 4,855 USD and the 5,597 USD all-time high. We break down the key levels, three trading scenarios with entry triggers, and what J.P. Morgan, Deutsche Bank and Goldman Sachs are forecasting for gold in 2026.
Forecasts presented in this section only reflect the author’s private opinion and should not be considered as guidance for trading. RoboForex bears no responsibility for trading results based on trading recommendations described in these analytical reviews.