EURUSD is down again: everyone wants the safe-haven dollar
The EURUSD pair slipped to 1.1532. The US dollar is in a strong position, as no one expects a quick Federal Reserve rate cut. Find more details in our analysis for 2 April 2026.
EURUSD forecast: key takeaways
- The EURUSD pair is retreating as external pressure mounts
- The market remains negative on Middle East risks
- EURUSD forecast for 2 April 2026: 1.1500
Fundamental analysis
The EURUSD rate fell to 1.1532 on Thursday. The US dollar was supported by uncertainty over the timing of the end to the conflict in the Middle East following statements by US President Donald Trump.
In his evening address the previous day, Trump noted that Washington was close to accomplishing its key strategic objectives in Iran, but allowed for the possibility of new hard strikes over the next two to three weeks. This increased tension and maintained a high degree of uncertainty for global markets.
A day earlier, he also stated that the President of Iran had allegedly expressed readiness for a ceasefire. Tehran promptly denied this information.
The dollar is receiving additional support from a revision in monetary policy expectations. Market participants are increasingly less likely to expect the Federal Reserve to cut interest rates this year. Rising oil prices amid the conflict are increasing inflation risks, which is narrowing the room for policy easing.
The EURUSD forecast is mixed.
Technical outlook
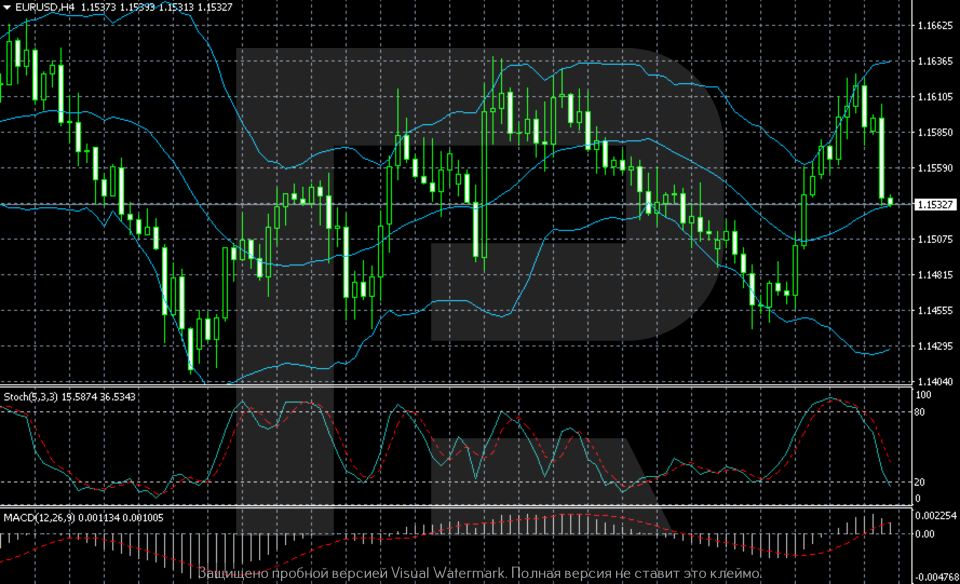
On the H4 chart, the EURUSD pair is moving in a wide sideways range with increased volatility. After declining to the 1.1400–1.1450 zone, the pair rebounded and formed a series of higher lows, but growth is being capped by the 1.1600–1.1630 area. The price is currently hovering around 1.1530, closer to the middle of the range, indicating the absence of a clear trend and a balance of power between buyers and sellers.
Bollinger Bands are narrowing after a recent expansion, indicating a gradual loss of momentum. The price recently touched the upper boundary of the channel and then sharply pulled back downwards – a typical signal of profit-taking and local overbought conditions. Meanwhile, the structure remains neutral, with no upward or downward breakouts of key levels.
Oscillators confirm waning upward momentum. The Stochastic Oscillator has moved out of overbought territory and is pointing downwards, signalling short-term selling pressure. MACD remains in positive territory, but the histogram is slowing, suggesting weaker growth momentum. In the near term, continued range-bound movement is likely, with the risk of testing the lower boundary around 1.1500.
EURUSD overview
- Asset: EURUSD
- Timeframe: H4 (Intraday)
- Trend: sideways with a downward bias
- Key resistance levels: 1.1600 and 1.1630
- Key support levels: 1.1500 and 1.1450
EURUSD trading scenarios for today
Main scenario (Sell Stop)
A price consolidation below 1.1525 would indicate stronger selling pressure amid geopolitical tensions and open the way to a test of the range’s lower boundary. The decline may accelerate if demand for the dollar as a safe-haven asset remains in place.
- Take Profit: 1.1465
- Stop Loss: 1.1580
Alternative scenario (Buy Stop)
A breakout above the resistance level and consolidation above 1.1605 would confirm the return of risk appetite and allow the pair to test the upper boundary of the range. Growth is possible if the news backdrop stabilises and the dollar weakens.
- Take Profit: 1.1660
- Stop Loss: 1.1560
Risk factors
Risks to the decline remain in place amid stronger geopolitical tensions in the Middle East and reduced expectations of Federal Reserve rate cuts. This supports the dollar and limits the pair’s upside potential. At the same time, softer regulator rhetoric or signs of de-escalation in the conflict may restore demand for the euro and trigger an upward move.
Summary
The EURUSD pair has declined noticeably in response to stronger geopolitical tension. The EURUSD forecast for today, 2 April 2026, suggests the pair could test the 1.1500 level.
Editors’ picks
 EURUSD 2026-2027 forecast: key market trends and future predictions
This article provides the EURUSD forecast for 2026 and 2027 and highlights the main factors determining the direction of the pair’s movements. We will apply technical analysis, take into account the opinions of leading experts, large banks, and financial institutions, and study AI-based forecasts. This comprehensive insight into EURUSD predictions should help investors and traders make informed decisions.
 Gold (XAUUSD) forecast 2026 and beyond: expert insights, price predictions, and analysis
Dive deep into the Gold (XAUUSD) price outlook for 2026 and beyond, combining technical analysis, expert forecasts, and key macroeconomic factors. It explains the drivers behind gold’s recent surge, explores potential scenarios including a move toward 4,500 to 5,000 USD per ounce, and highlights why the metal remains a strong hedge during global uncertainty.
Forecasts presented in this section only reflect the author’s private opinion and should not be considered as guidance for trading. RoboForex bears no responsibility for trading results based on trading recommendations described in these analytical reviews.