Brent full of doubts: key events ahead
Brent crude has fallen to 70.73 USD. Geopolitics supports growth, while US inventory data weighs on prices. Discover more in our analysis for 26 February 2026.
Brent forecast: key takeaways
- Brent prices are under pressure ahead of the next round of US-Iran talks
- US inventory data showed the strongest weekly increase in two years
- Brent forecast for 26 February 2026: 70.20 or 72.00
Fundamental analysis
Brent crude has declined for the second consecutive session on Thursday, slipping to 70.73 USD. Investors are preparing for the third round of nuclear negotiations between the US and Iran, scheduled for today.
The market is closely watching the meeting in Geneva. The US delegation is led by Special Envoy Steve Witkoff, while Iran is represented by Foreign Minister Abbas Araghchi. The talks are taking place amid heightened tensions and increased military presence in the Middle East. President Donald Trump previously stated that the US could carry out limited strikes if no agreement is reached.
However, price growth is being restrained by a sharp rise in US crude inventories. According to the EIA, stockpiles increased by 16 million barrels last week, marking the largest weekly gain since February 2023.
Concerns over oversupply are intensifying. Saudi Arabia is approaching its highest export volumes in nearly three years, while Iran has accelerated tanker loadings.
The outlook for Brent is mixed.
Technical outlook
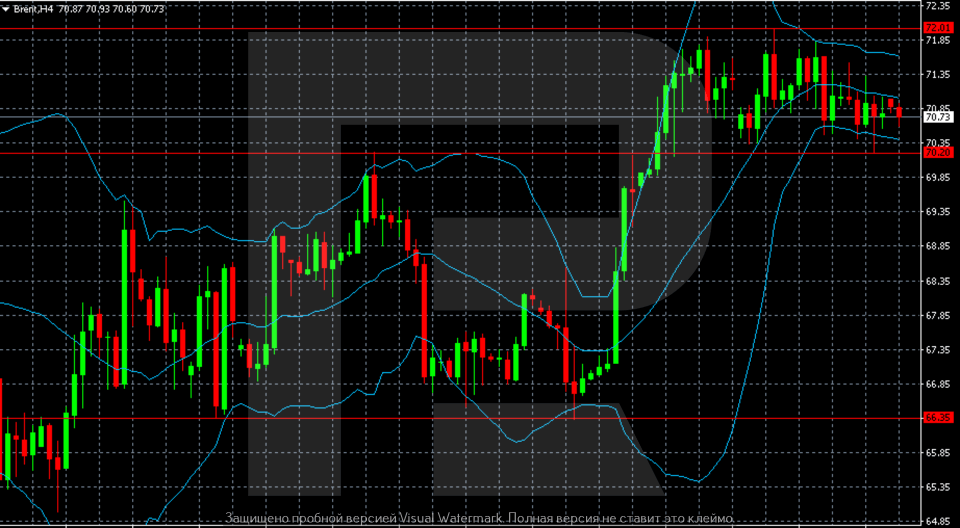
On the H4 chart, Brent prices rebounded from the 66.35 area, formed a strong upward impulse, broke above 70.20, and reached highs near 72.00. The rally was accompanied by widening Bollinger Bands, signalling increased volatility.
Currently, prices are consolidating within the 70.20–72.00 range and trading around 70.7. Volatility is decreasing, and Bollinger Bands are gradually narrowing, indicating a sideways phase after the sharp rise.
The nearest resistance level is located at 72.00, with support at 70.20. A breakout below this level would increase the risk of a decline towards the 68–69 area. As long as prices remain above 70.20, the structure is moderately positive, although momentum has noticeably weakened.
Brent overview
- Asset: Brent
- Timeframe: H4 (Intraday)
- Trend: range
- Key resistance levels: 72.00 and 74.55
- Key support levels: 70.20 and 68.50
Brent trading scenarios for today
Main scenario (Buy Stop)
A breakout and consolidation above 72.00 would confirm a breakout out of the 70.20–72.00 range and renewed upward momentum after the rebound from 66.35. The target is 74.55. The potential profit is around 255 pips with a risk of approximately 115 pips. The risk-to-reward ratio exceeds 1:2.
- Take Profit: 74.55 USD
- Stop Loss: 70.85 USD
Alternative scenario (Sell Stop)
A breakout and consolidation below 70.20 would add to corrective pressure and open the way towards 68.50.
- Take Profit: 68.50 USD
- Stop Loss: 71.20 USD
Risk factors
The bullish scenario will be questioned if prices consolidate below 70.20, signalling a weakening bullish structure on the H4 chart. Additional negative factors may include further increases in US oil inventories or easing geopolitical tensions surrounding US-Iran talks.
Summary
Brent crude is declining as the market awaits news and technical signals. The Brent forecast for today, 26 February 2026, suggests continued sideways movement within the 70.20–72.00 range.
Editors’ picks
 EURUSD 2026-2027 forecast: key market trends and future predictions
This article provides the EURUSD forecast for 2026 and 2027 and highlights the main factors determining the direction of the pair’s movements. We will apply technical analysis, take into account the opinions of leading experts, large banks, and financial institutions, and study AI-based forecasts. This comprehensive insight into EURUSD predictions should help investors and traders make informed decisions.
 Gold (XAUUSD) forecast 2026 and beyond: expert insights, price predictions, and analysis
Dive deep into the Gold (XAUUSD) price outlook for 2026 and beyond, combining technical analysis, expert forecasts, and key macroeconomic factors. It explains the drivers behind gold’s recent surge, explores potential scenarios including a move toward 4,500 to 5,000 USD per ounce, and highlights why the metal remains a strong hedge during global uncertainty.
Forecasts presented in this section only reflect the author’s private opinion and should not be considered as guidance for trading. RoboForex bears no responsibility for trading results based on trading recommendations described in these analytical reviews.